Measures of cognitive reserve in Alzheimer’s disease
Medidas de reserva cognitiva na doença de Alzheimer
Margarida Sobral,1 Maria Helena Pestana,2 Constança Paúl3
Abstract
Introduction: Cognitive reserve (CR), a hypothetical construct used to obtain information about cognitive aging, describes the capacity of the adult brain to cope with the effects of neurodegenerative processes. This study evaluated CR using a CR questionnaire (CRQ) and a set of variables (education, leisure activities, lifelong occupation) that inform CR. It also developed a CR index, validated the CRQ, and examined the correlation between the different CR measures.
Methods: Functional and neuropsychological capacities of 75 outpatients (mean age: 80.2 years) with a probable AD diagnosis were evaluated. Socio-demographic data and clinical variables were collected. Patients completed two questionnaires: the Participation in Leisure Activities throughout Life questionnaire, and the CRQ.
Results: Participants with a greater CR had higher scores in cognitive tests than the elderly with a lower CR. A CR index was developed. CRQ reliability was 0.795 (Cronbach’s alpha). There was a close association between the CR Index and the CRQ.
Conclusions: This study found an association between CR measures and education, occupation and participation in leisure activities. The CRQ seems to be a suitable instrument to measure CR in Portuguese populations.
Keywords: Alzheimer’s disease, cognitive reserve, education, leisure activities, lifelong occupation, Cognitive Reserve Index, Cognitive Reserve Questionnaire.
Resumo
Introdução: A reserva cognitiva (RC), um construto usado para informar sobre o envelhecimento cognitivo, descreve a capacidade do cérebro adulto em lidar com os efeitos de processos neurodegenerativos. Este estudo teve como objetivos avaliar a RC com o Questionário de RC (QRC) e através de variáveis (escolaridade, actividades de lazer, ocupação ao longo da vida) que informam sobre a RC; desenvolver um índice de RC; validar o QRC; e correlacionar as diferentes medidas de RC.
Métodos: Foram avaliadas as capacidades funcionais e neuropsicológicas de 75 doentes (idade média: 80,2 anos) com diagnóstico de provável doença de Alzheimer, seguidos em ambulatório. Os dados recolhidos incluíram variáveis
sócio-demográicas e clínicas. Os pacientes completaram dois
questionários: Participação em Atividades de Lazer ao Longo da Vida; e QCR.
Resultados: Os doentes com os níveis mais elevados de RC obtiveram os valores mais elevados nos testes cognitivos. Neste estudo foi desenvolvido um IRC. O QRC (versão portuguesa) teve
uma idelidade de 0,795 (alpha de Cronbach) e foi demonstrada
uma associação alta entre o IRC e o QRC.
Conclusões: Veriicou-se a existência de uma associação entre
as medidas de RC e a escolaridade, ocupação e participação em atividades de lazer. O CRQ pode ser considerado um instrumento adequado para medir o CR da população portuguesa.
Descritores: Doença de Alzheimer, reserva cognitiva, escolari-dade, atividades de lazer, ocupação ao longo da vida, Índice de Reserva Cognitiva, Questionário de Reserva Cognitiva.
1 Psychogeriatric Service, Hospital Magalhães Lemos, Porto, Portugal. Unidade de Investigação e Formação sobre Adultos e Idosos (UNIFAI), Instituto de Ciências Biomédicas Abel Salazar (ICBAS), Universidade do Porto, Porto, Portugal. 2 UNIFAI, ICBAS, Universidade do Porto, Porto, Portugal. Instituto Universitário de Lisboa (ISCTE-IUL), Lisbon, Portugal. 3 UNIFAI, ICBAS, Universidade do Porto, Porto, Portugal.
Financial support: none.
Submitted May 07 2014, accepted for publication Jul 10 2014. No conlicts of interest declared concerning the publication of this article.
Introduction
Alzheimer’s disease (AD), the most common form of dementia among the elderly,1,2 is a progressive
neurodegenerative disorder characterized by deterioration of cognitive and functional capacities and a number of neuropsychiatric and behavioral symptoms.3
The risk of dementia grows exponentially with age.4
In 1988, a study reported that 10 cognitively healthy elderly women had pathological features of Alzheimer’s
disease, conirmed by plaques found at autopsy.5
Cognitive reserve (CR), a hypothetical construct that provides information about cognitive aging, describes the capacity of the adult brain to cope with the effects of neurodegenerative processes and to minimize the clinical signs of dementia. CR may result from innate intelligence or life experiences.6 The CR hypothesis suggests that
individual differences in the ability to cope with AD6,7 are
consistent with the prediction that people with a greater CR cope with advancing AD longer before the disease is observed clinically.7-9 CR is not ixed, and continues to
evolve across the lifespan.9 The major barrier to studying
CR lies in its measurement.10,11 As a hypothetical construct,
CR is not measured directly. Variables pertaining to lifetime experience, such as education, occupation and leisure activities, all of which help to retain cognitive function in old age, are the most commonly used proxies for CR.
According to Albert et al.,12 persons with a higher
educational attainment show less cognitive decline with advancing age, and other studies showed that persons with a higher education perform better in cognitive tests.13 James et al.14 showed that more socially active
older adults experience less cognitive decline in old age. A greater understanding of the concept of CR may lead to interventions to slow cognitive aging.8 Sobral &
Paúl15 demonstrated that patients with AD and higher
levels of education achieved better results in cognitive tests, and that individuals with greater participation in leisure activities (PLA) had better results in cognitive and functional tests than those with a lower participation.
The risk of developing AD is reduced in individuals with a higher education,8 greater occupational
attainment8 and PLA.8,16,17 Other studies found no
association between education and incident dementia18
and no association between occupation and incident AD in several population-based longitudinal studies.19
The objectives of this study were: 1) to assess CR using a CR questionnaire (CRQ) and a set of variables (education, leisure activities, lifelong occupation) that inform CR; 2) to develop a CR index; 3) to validate the CRQ; and 4) to examine the correlation between different measures of CR (CRQ, CR index, education, PLA and lifelong occupation).
Methods
Participants
This study included 75 outpatients (mean age: 80.2 years; range: 61-92 years) diagnosed with probable AD, recruited by convenience at the psychogeriatric service of a psychiatric hospital. This psychogeriatric service is designed to follow up patients with dementia, using an integrated multidisciplinary approach to diagnosing and managing dementia. Physical, neurological, neuropsychological and psychiatric examinations, neuroimaging and additional tests, including blood tests, were used to distinguish between the various types of dementia.
All patients fulilled the criteria of both the Diagnostic
and Statistical Manual of Mental Disorders, 4th edition (DSM-IV)20 and the National Institute for Neurological
and Communicating Disorders and Stroke/AD and Related Disorders Association for probable AD.21 The
participants had no severe medical conditions other than those pertinent to the study. They all had normal or corrected levels of hearing and vision acuity. The patients, their caregivers or their legal guardians signed a written consent form.
Mean age (± standard deviation) was 80.20 ± 5.64 years, and mean educational level was 5.45 years. Table 1 shows the demographic and clinical characteristics of participants with AD.
There were signiicantly more women than men
(binomial test; p < 0.001). The age difference between
sexes was not statistically signiicant (t test; p = 0.3). There were more married men (80.5%) than married women (30.9%) (Likelihood ratio; p < 0.001), but differences in other marital statuses were not relevant (p = 0.6, LR). Women had very different levels of education. The mean of 5.75 years of education was replaced with a trimmed mean of 5% (5% trimmed mean = 5.45), and the standard deviation was replaced with the interquartile range (Tukey’s hinges): 50% of the men had 4 to 10 years of education, whereas 50% of the women had 3 to 4.5 years. Men had a mean 2.63 more years of education than women. At each higher educational level, there was a 13% greater
likelihood to ind men than women, according to the
binary logistic regression model and good sampling adequacy (Hosmer and Lemeshow test = 1.73; df = 4; p = 0.79) and Exp (sex) = 1.13. The presence of unskilled women (70.9%) was more likely than that of unskilled men (20%) (LR; p < 0.001), but differences
in the other work status categories were not signiicant
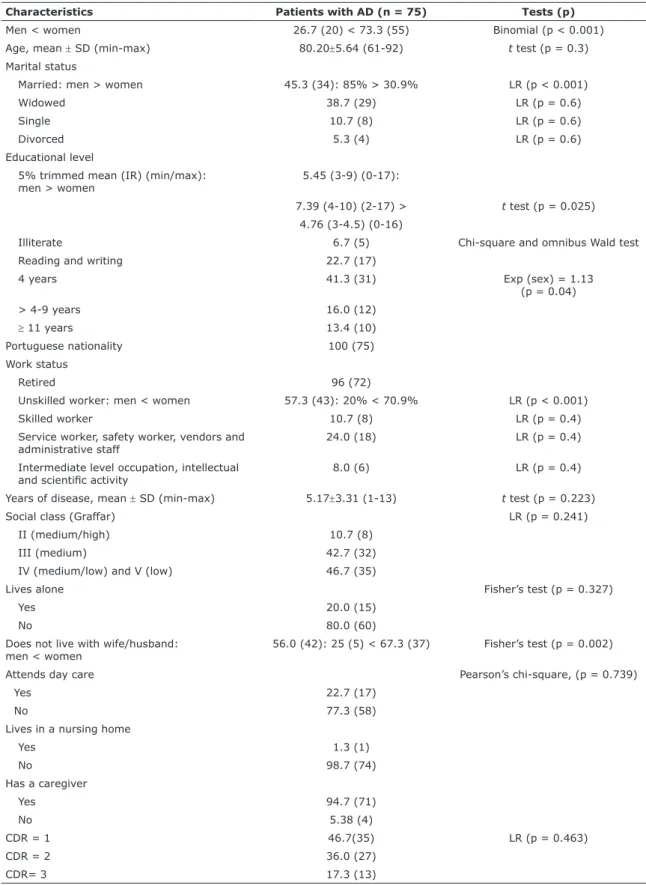
Characteristics Patients with AD (n = 75) Tests (p)
Men < women 26.7 (20) < 73.3 (55) Binomial (p < 0.001) Age, mean ± SD (min-max) 80.20±5.64 (61-92) t test (p = 0.3) Marital status
Married: men > women 45.3 (34): 85% > 30.9% LR (p < 0.001)
Widowed 38.7 (29) LR (p = 0.6)
Single 10.7 (8) LR (p = 0.6)
Divorced 5.3 (4) LR (p = 0.6)
Educational level
5% trimmed mean (IR) (min/max): men > women
5.45 (3-9) (0-17):
7.39 (4-10) (2-17) > t test (p = 0.025)
4.76 (3-4.5) (0-16)
Illiterate 6.7 (5) Chi-square and omnibus Wald test
Reading and writing 22.7 (17)
4 years 41.3 (31) Exp (sex) = 1.13
(p = 0.04)
> 4-9 years 16.0 (12)
≥ 11 years 13.4 (10)
Portuguese nationality 100 (75)
Work status
Retired 96 (72)
Unskilled worker: men < women 57.3 (43): 20% < 70.9% LR (p < 0.001)
Skilled worker 10.7 (8) LR (p = 0.4)
Service worker, safety worker, vendors and administrative staff
24.0 (18) LR (p = 0.4)
Intermediate level occupation, intellectual
and scientiic activity 8.0 (6) LR (p = 0.4)
Years of disease, mean ± SD (min-max) 5.17±3.31 (1-13) t test (p = 0.223)
Social class (Graffar) LR (p = 0.241)
II (medium/high) 10.7 (8)
III (medium) 42.7 (32)
IV (medium/low) and V (low) 46.7 (35)
Lives alone Fisher’s test (p = 0.327)
Yes 20.0 (15)
No 80.0 (60)
Does not live with wife/husband: men < women
56.0 (42): 25 (5) < 67.3 (37) Fisher’s test (p = 0.002)
Attends day care Pearson’s chi-square, (p = 0.739)
Yes 22.7 (17)
No 77.3 (58)
Lives in a nursing home
Yes 1.3 (1)
No 98.7 (74)
Has a caregiver
Yes 94.7 (71)
No 5.38 (4)
CDR = 1 46.7(35) LR (p = 0.463)
CDR = 2 36.0 (27)
CDR= 3 17.3 (13)
Table 1 - Demographic and clinical characteristics
Results expressed as % (n), unless otherwise stated.
a standard algorithm to stage the patient’s level of impairment: 0, no impairment; 0.5, very mild impairment; 1, mild dementia; 2, moderate dementia; and 3, severe dementia. The scale was administered to the patients and an informant using a semi-structured interview. The Addenbrooke’s Cognitive Examination - Revised (ACE-R)26 is a brief cognitive test that assesses
ive cognitive domains, namely: attention/orientation, memory, verbal luency, language and visuospatial
abilities. The total score is 100, and higher scores indicate better cognitive functioning.
Functional capacities were assessed using two scales of activities of daily living: the Barthel’s Index (BI), for basic activities of daily living, such as grooming, eating, bathing, dressing and mobility; and the Lawton & Brody’s Index (LBI), for instrumental activities, such as managing money and using the telephone. The BI total score may range from 0 to 100 (fully independent) and the LBI, from 8 (independent) to 30 (completely dependent).
Socioeconomic status was evaluated according to the Graffar Index.27 This index has ive categories,
from I (very low) to V (very high). Lifelong occupation
was assessed using the National Classiication of
Occupations.28
Procedures and statistical design
This cross-sectional study retrieved data from the database of a larger study to investigate Dementia and Cognitive Reserve (DCR) in patients recruited at Hospital Magalhães Lemos, Porto, Portugal. This study was approved by the Review Board (ethics committee) of the institution where it was conducted. Socio-demographic and clinical variables (age, gender, marital status and retirement status), as well as variables that usually inform CR (education level, lifelong occupation and frequency of PLA), were collected. Each participant underwent a standard evaluation, including medical history, physical examination, laboratory tests and a neuroimaging study (axial CT). All patients with AD were evaluated using MMSE
and CDR at a irst consultation for a multidisciplinary
assessment before recruitment. Participants underwent functional and neuropsychological evaluations, and
speciic neuropsychological domains were examined:
memory, language, attention, visuospatial ability and executive functioning.
According to the hypothesis of this study, the following variables may affect CR: CRQ score, Cognitive Reserve Index (CRI), level of educational attainment, PLA score and lifelong occupation.
General exploratory analyses were conducted to determine sample characteristics. Means, standard
Instruments
The CRQ22 was administered to measure CR. The
contribution of factors such as activities (reading, intellectual games), years of education, years of parents’ education, occupation, training courses, musical training and language studies of participants during their adult lifetime were included to calculate CR. The CRQ has eight items with several different possible answers.
Data about PLA was obtained from a questionnaire, the Participation in Leisure Activities throughout Life, answered by the participants or their caregivers.15
Most were completed by the participant with the help of the caregiver. This questionnaire was limited to the assessment of leisure activities throughout life and not current activities (after onset of disease). This tool included mental activities (reading books/ newspapers, jigsaw puzzles), physical activities (walking or sports), social activities (playing cards/ board games, visiting friends or relatives), productive activities (housekeeping, babysitting, gardening, crocheting) and recreational activities (listening to the radio, watching television). Participants reported the frequency of PLA throughout life as daily, several days per week, once a week, two or three days a month, monthly, and never or less than once a month. They were asked whether they engaged regularly in
other speciic activities, and all had to specify which
activities and the frequency of PLA throughout life.
The instrument produced a total score and classiied
people in three categories: low, medium and high PLA throughout life. The PLA throughout life questionnaire has 17 questions; in each question, 5 points were added if the frequency was daily, 4, if several days per week, 3, if once a week, 2, if two or three days per month, 1, if monthly and 0, if less than once a month or never. Total scores ranged from 0 to 85 points.
All participants were given the Mini Mental State Examination (MMSE)23 for cognitive screening and
the Clinical Dementia Rating (CDR). We used the Portuguese version of the MMSE.24 The normative
cut-off values were adjusted to education level for a Portuguese population. The cut-off points for the diagnosis of dementia were greater than 27 if the participant had > 11 years of education, ≤ 22 if they had 1-11 years of education, and ≤ 15 if they were illiterate. The CDR25 classiies dementia into 3 stages
Results
The cognitive assessment revealed that patients with AD had a low level of CR (CRQ), and their mean scores were 16.25 on MMSE, 37.96 on ACE-R, 9.24 in attention and orientation (ACE-R), 4.51 in memory (ACE-R), 2.35
in luency (ACE-R), 14.53 in language (ACE-R) and 7.53
on the visuospatial test (ACE-R), whereas patients with AD and a medium and high level of CR (CRQ) had a mean score of 19.79 on MMSE, 52.05 on ACE-R, 10.89 in attention and orientation (ACE-R), 6.82 in memory
(ACE-R), 3.65 in luency (ACE-R), 19.59 in language
(ACE-R), and 10.18 on the visuospatial test (ACE-R). The participants with higher CR levels had higher scores on cognitive tests than the elderly with lower CR levels.
The results of functional tests revealed that mean BI was 86.67, and mean LBI, 23.36. Mean BI of patients with AD and a low CR (CRQ) was 87.23, and LBI, 23.66. Mean BI of patients with AD and a medium or high CR (CRQ) was 85.00, and LBI, 22.47.
Association between CR (CRQ and CRI) and education, participation in leisure activities and lifelong occupation
Mean CRQ score was 5.53, and mean CRI was 4.85. Pearson’s correlation (r = 0.674) and Spearman’s rho
correlation (r = 0.645) were signiicant at a level of signiicance of 0.01 (2-tailed) when comparing CRQ and CRI.
Participants with a higher CRI had the highest CRQ scores.
Signiicant results at a level of 0.01 (2-tailed) were
found for Pearson’s correlation (r = 0.604) and Spearman’s rho correlation (r = 0.645) between CRQ and education; Pearson’s correlation (r = 0.306) and Spearman’s rho correlation (r = 0.340) between CRQ and PLA; and Pearson’s correlation (r = 0.621) and Spearman’s rho correlation (r = 0.589) between CRQ and lifelong occupation. Patients with AD and a higher educational level had higher CRQ scores than those with a lower educational level. Patients with a higher PLA score had higher CRQ scores than those with a lower level of PLA. Participants that had complex occupations had higher CRQ scores than patients with less
complex occupations. Signiicant results at a level of 0.01
(2-tailed) were found for Pearson’s correlation (r = 0.864) and Spearman’s rho correlation (r = 0.883) between CRI and education; Pearson’s correlation (r = 0.633) and Spearman’s rho correlation (r = 0.648) between CRI and PLA; and, Pearson’s correlation (r = 0.713) and Spearman’s rho correlation (r = 0.662) between CRI and lifelong occupation. Patients with AD and a higher educational level had a higher CRI. Patients with higher PLA scores had a higher CRI. Participants with more complex occupations had a higher CRI.
deviations, interquartile ranges and percentiles were used for descriptive statistics. Logistic regression and the Student t test were used to infer the relationship between metric and binary response data; multinomial regression and analysis of variance (ANOVA) were used when the response variable had more than two categories. Contingency tables were prepared to examine the association between categorical variables whenever odds ratio (OR), the Pearson chi-square test, the Fisher exact test, likelihood ratios and Cochran’s statistics did not reveal any interactive effects.29
Factorial analysis of principal components and the Kaiser-Meyer-Olkin and Bartlett’s test of sphericity were used to test CRQ construct validity and the underlying dimension of CR. CRQ reliability was assessed using Cronbach’s alpha, which measures internal consistency and indicates to what degree the instrument produces consistent results or equivalents.
A CR index (CRI) was developed and tested in our sample. An index is a latent variable that summarizes the group of correlated variables to simplify their interpretation. To create the CRI, we selected variables that are measures of CR (education, PLA and lifelong occupation) according to the literature and tested them for homogeneity of variance. An equation was used to standardize these variables. This CRI was composed of the following CR variables: education (illiterate, reading and writing, = 4 years, > 4 years), PLA (≤ 25, 26-35, ≥ 36) and lifelong occupation (unskilled worker, skilled worker, service worker, safety worker, vendor and administrative staff, intermediate level
occupation, intellectual and scientiic activity). These
variables were scored using different scales, and we
deined an equation of linear transformation when
minimum and maximum values were not symmetrical to the mean. The new 0-to-10 scale was constructed using the expression below:
Cognitive Reserve Index = Cognitive Reserve Index_construction x 5 x (1.63 + 1.29)/[Cognitive Reserve Index_construction x (1.63-1.29)-2 x (-1.29 x 1.63)] + 5
This linear equation is given by the following transformation:
t = 1
m x z + c
+ b = 5z x (max - min)
z x (min + max) - 2x minx max +5
Where: m = min+ max
5(max- min)
; c = 2 x minx max 5 x (min- max)
; b = 5
z = represents the standardized variables
The analysis of CRI according to educational level (Figure 1A) revealed that the > 4 years group had the highest CRI; mean CRI in the illiterate group was 0.83, in the reading and writing group, 2.57, in the = 4 years group, 4.55, and in the > 4 years group, 9.67. There
were signiicant differences in CRI between the levels
of education (t
(3) = 77.61; p < 0.001). In this study, we
found that the patients with a higher educational level had a greater CR according to CRI.
The patterns of CRI for different PLA levels (Figure 1B) showed that the ≥ 36 group had the highest CRI. Mean CRI for the group with ≤ 25 scores was 3.10, for the group with 26-35 scores, 4.63, and for the group with ≥
36 scores, 6.93. There were signiicant differences in CRI
between PLA levels (t
(2) = 17.88; p < 0.001). Patients
with higher PLA scores had a greater CR according to CRI than the patients with lower PLA scores.
The patterns of CRI for different lifelong occupations (Figure 1C) showed that the group of participants with intermediate level occupations and intellectual and
scientiic activity had the highest CRI. For unskilled
workers, mean CRI was 3.54; for skilled workers, 4.53, for service workers, safety worker, vendors and administrative staff, 6.64, and for intermediate level occupations and individuals that work with intellectual
and scientiic activity, 9.23. There were signiicant
differences in CRI between lifelong occupation groups (t
(3) = 25.94; p = 0.000). Patients with more complex
occupations had a higher CR according to CRI than patients with less complex occupations.
The patterns of CRQ scores for different educational levels (Figure 2A) showed that individuals with more than four years of education (> 4 years) had the highest scores. Mean CRQ scores for the group of illiterate individuals was 1.00, for the reading and writing group, 2.85, for the = 4 years group, 4.48, and for the > 4
years group, 9.67. There were signiicant differences in
CRQ scores between educational levels (t
(3) = 18.36; p
= 0.000). Patients with higher educational levels had a greater CR according to CRQ scores than the patients with a lower educational level
The analysis of CRQ scores for different PLA levels (Figure 2B) revealed that the ≥ 36 group had the highest scores. The group with ≤ 25 scores had a mean 4.29 CRI, the group with 26-35 scores had a mean of 4.97, and the group with ≥ 36 scores had a mean of 6.67. There were
signiicant differences in CRQ scores between PLA levels
(t
(2) = 3.58; p = 0.033). Patients with higher PLA scores
had a greater CR according to CRQ than patients with a lower PLA score.
CRQ scores for groups of individuals with different lifelong occupations (Figure 2C) showed that the groups with intermediate level occupations and intellectual and
Figure 1 - Cognitive Reserve Index compared with: A) education (illiterate, reading and writing, 4 years, > 4 years); B) participation in leisure activities (PLA) (≤ 25, 26-35, ≥ 36 scores); and C) lifelong occupation (unskilled worker, skilled worker, service worker, safety worker, vendor
and administrative staff, intermediate level occupations, intellectual and scientific activity).
Cognitive Reserve Index Iliterate Reading and
whiting
4 years > 4 years 9
8
7
6
5
4
3
2
1
0
8
7
6
5
4
3
2
1
0
Cognitive Reserve Index
<25 26-35 >36
Cognitive Reserve Index Unskilled work
ers
Skilled work ers
Service work ers
Intermediate lev el 10
9 8 7 6 5 4 3 2 1 0 A
B
We demonstrated a close association between CRI and CRQ (eta = 0.674), which corroborates the validity of the cognitive reserve construct. We found that 45.4% of the variation of CRI was determined by CRQ scores, and that 45.4% of the variation of CRQ score was determined by CRI.
scientiic activities had the highest CRQ scores. The group
of unskilled workers had a mean 3.37 CRQ score, the group of skilled workers, a mean of 5.00, the group of service workers, safety workers, vendors and administrative staff, a mean of 8.00, and the group of individuals with intermediate level occupations and intellectual and
scientiic activity, a mean of 14.33. There were signiicant
differences in CRQ score between the groups of lifelong occupations (t
(3) = 25.35; p = 0.000). Patients with more
complex occupations had a greater CR according to CRQ scores than patients with less complex occupations.
Validation of the Cognitive Reserve Questionnaire
Two independent translations were made from Spanish into Portuguese, followed by two independent back-translations. Some adaptations to linguistic and cultural aspects of Portuguese individuals were made,
and a irst version was produced.
CRQ construct validity of the underlying CR dimension was analyzed using factorial analysis of principal components, and internal consistency was assessed using Cronbach’s alpha.
In the analysis of construct validity, factorial analysis of principal components with varimax rotation adapted well to data and was a good indicator of the quality of the
adjustment obtained by goodness of it (index = 0.99) and
by root mean square residual (0.048), which were based on the residual matrix correlation. The existence of an eigenvalue > 1 (Kaiser criterion) and the steepening of the scree plot indicated the existence of a single dimension in CR. Responses were consistent, because there was a good correlation between items according to the measure of sampling adequacy (Kaiser-Meyer-Olkin = 0.761; Bartlett’s sphericity test = 204.159; df = 28; p < 0.01).
The reliability of the 8-item Portuguese version of the CRQ had good internal consistency (Cronbach’s alpha = 0.795), similar to that found in the original CRQ study.21
Table 2 shows the results of statistics for CRQ items. Musical training had the lowest correlation with the other items due to weak variability in responses, as 97.3% reported not playing or listening to music (Table 3).
We found that the values of alpha with and without any item were close, which showed that the CRQ was not
dependent on any particular item. This conirmed that all
matters relating to the CR are relevant.
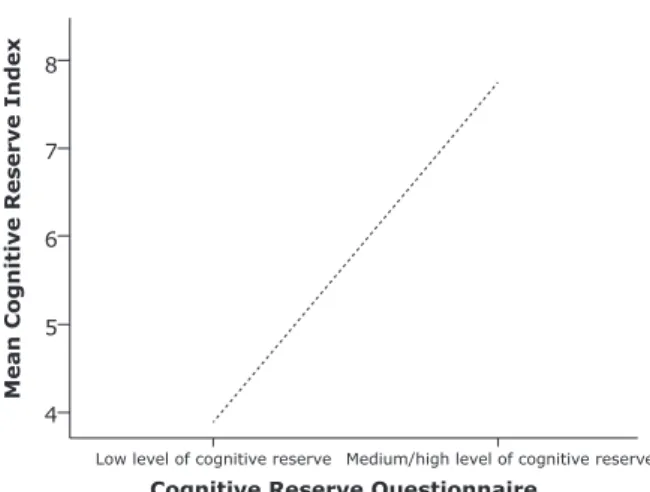
Figure 3 shows that the higher the mean value of CRI, the greater the CR according to CRQ scores. Moreover, higher CRI results are followed by a greater likelihood of patients having an average or great CR, represented by CRQ scores, according to the F test as one-way ANOVA (F = 60.638; p < 0.001).
Figure 2 - Cognitive Reserve Questionnaire scores compared with A) education (Illiterate, reading and writing, = 4 years,
> 4 years); B) participation in leisure activities (≤ 25, 26-35, ≥ 36 scores); and C) lifelong occupation (unskilled worker, skilled worker, service worker, safety worker, vendor
and administrative staff, intermediate level occupation, intellectual and scientific activity).
Cognitive Reserve Questionnaire Iliterate Reading and
writing
4 years > 4 years 12
10
8
6
4
2
0
8
7
6
5
4
3
2
1
0
<25 26-35 >36
Cognitive Reserve Questionnaire
14 16
12 10 8 6 4
2 0
Cognitive Reserve Questionnaire
Unskilled work ers
Skilled work ers
Service work ers
Intermediate lev el
A
B
This questionnaire is a simple tool to evaluate the CR in Portuguese populations. CRQ is a questionnaire with good psychometric properties and may be a suitable instrument to measure CR in Portuguese populations.
Discussion
Our irst objective was to assess CR using the CRQ and
a set of variables (education, PLA, lifelong occupation) that inform CR. According to the CRI and CRQ scores, greater CR was found in the groups of patients with a higher educational level, a higher PLA score and more complex occupations. These results are in agreement
with indings reported in previous studies that conirmed
that variables describing lifetime experience (education, PLA, lifelong occupation) are the most commonly used proxies for CR.8,10,11,15
Our second objective was to develop a CR index. We selected the variables described in the literature as measures of CR (education, PLA and lifelong occupation) and we tested them for homogeneity of variance.
Our third objective was to validate a CR questionnaire. We found a close association between CRI and CRQ. The CRQ is a simple tool to evaluate CR in Portuguese populations. Our analysis revealed that the CRQ has high reliability and suitable content validity.
Our fourth objective was to examine the correlation between the different measures of CR (CRQ, CRI, education, PLA and lifelong occupation). We found that CR (CRQ and CRI) correlates with education, PLA and
lifelong occupation, in agreement with indings reported
in other studies.8,9,16
The main limitations of this study were its cross-sectional design and its small sample size. Future longitudinal studies with larger samples should be conducted to address these limitations.
Scale mean if item deleted
Scale variance if item deleted
Corrected item-total correlation
Squared multiple correlation
Cronbach’s alpha if item deleted
Education 2.95 8.107 0.769 0.649 0.733
Parental education
4.50 13.788 0.452 0.284 0.783
Training courses
5.15 12.265 0.632 0.529 0.755
Occupation 4.77 9.494 0.755 0.674 0.723
Musical training
5.38 15.718 -0.055 0.029 0.818
Languages 5.00 11.205 0.664 0.519 0.744
Reading 4.92 13.391 0.550 0.408 0.773
Intellectual games
5.27 14.830 0.258 0.233 0.802
Table 2 - Items-total statistics
CR Questionnaire (items 1-8) n (%)
Education
Illiterate 4 (5.3)
Can read and write (self-taught) 8 (10.7) Primary school (< 6 years) 41 (54.7) Elementary school (6-8 years) 2 (2.7) High school (+9 years) 12 (16.0)
Higher education 8 (10.7)
Parental education
No education 12 (16.0)
Primary or elementary school 57 (76.0) High school or higher education 6 (8.0) Training courses
Without 61 (82.4)
1 or 2 8 (10.8)
2 to 5 3 (4.1)
≥ 6 2 (2.7)
Occupation
Unskilled worker 51 (68.0)
Skilled manual worker 9 (12.0) Skilled non-manual worker 7 (9.3)
Professional 7 (9.3)
Executive position 1 (1.3)
Musical training
Does not play or listening 73 (97.3) Plays s little/often hears 1 (1.3)
Formal training 1 (1.3)
Languages
Only one language 60 (80.0)
2 languages 14 (18.7)
≥ 3 languages 1 (1.3)
Reading
Never 38 (50.7)
Occasionally 37 (49.3)
2 to 5 books/year 0 (0)
Over 10 books/year 0 (0)
Intellectual games
Never or sometimes 64 (85.3)
1 to 5 times/month 11 (14.7)
≥ 6 times/month 0 (0)
11. Zahodne LB, Manly JJ, Brickman AM, Siedlecki KL, Decarli C, Stern Y. Quantifying cognitive reserve in older adults by decomposing episodic memory variance: replication and extension. J Int Neuropsychol Soc. 2013;19:854-62. Epub 2013 Jul 18.
12. Albert MS, Jones K, Savage CR, Berkman L, Seeman T, Blazer D, et al. Predictors of cognitive change in older persons: MacArthur studies of successful aging. Psychol Aging. 1995;10:578-89. 13. Ganguli M, Ratcliff G, Huff FJ, Belle S, Kancel MJ, Fischer L, et al.
Effects of age, gender, and education on cognitive tests in a rural elderly community sample: norms from the Monongahela Valley Independent Elders Survey. Neuroepidemiology. 1991;10:42-52. 14. James BD, Boyle PA, Buchman AS, Bennett DA. Relation of late-life social activity with incident disability among community-dwelling older adults. J Gerontol A Biol Sci Med Sci. 2011;66:467-73. Epub 2011 Feb 7.
15. Sobral M, Paúl C. Education, leisure activities and cognitive and functional ability of Alzheimer’s disease patients: a follow-up study. Dement Neuropsychol. 2013;7:181-89.
16. Scarmeas N, Stern Y. Cognitive reserve: implications for diagnosis and prevention of Alzheimer’s disease. Curr Neurol Neurosci Rep. 2004;4:374-80.
17. Fratiglioni L, Paillard-Borg S, Winblad B. An active and socially integrated lifestyle in late life might protect against dementia. Lancet Neurol. 2004;3:343-53.
18. Graves AB, Larson EB, Edland SD, Bowen JD, McCormick WC, McCurry SM, et al. Prevalence of dementia and its subtypes in the Japanese American population of King County, Washington state. The Kame Project. Am J Epidemiol. 1996;144:760-71.
19. Helmer C, Letenneur L, Rouch I, Richard-Harston S, Barberger-Gateau P, Fabrigoule C, et al. Occupation during life and risk of dementia in French elderly community residents. J Neurol Neurosurg Psychiatry. 2001;71:303-9.
20. American Psychiatric Association. Diagnostic and Statistical Manual of Mental Disorders, 4th ed, text revision (DSM-IV-TR). Washington DC: American Psychiatric Association; 2000. 21. McKhann G, Drachman D, Folstein M, Katzman R, Price D, Stadlan
EM. Clinical diagnosis of Alzheimer’s disease: report of the NINCDS-ADRDA Work Group under the auspices of Department of Health and Human Services Task Force on Alzheimer’s Disease. Neurology. 1984;34:939-44.
22. Rami L, Valls-Pedret C, Bartrés-Faz D, Caprile C, Solé-Padullés C, Castellvi M, et al. [Cognitive reserve questionnaire. Scores obtained in a healthy elderly population and in one with Alzheimer’s disease]. Rev Neurol. 2011;52:195-201.
23. Folstein MF, Folstein SE, McHugh PR. “Mini-mental state”. A practical method for grading the cognitive state of patients for the clinician. J Psychiatri Res. 1975;12:189-98.
24. Guerreiro MS, Botelho MA, Leitão O, Castro-Caldas A, Garcia C. Avaliação breve do estado mental. Adaptação Portuguesa do Mini Mental State Examination (MMSE) (Folstein, Folstein, & McHugh, 1975). Lisboa: Grupo de Estudos de Envelhecimento Cerebral e
Demências; 1994.
25. Hughes CP, Berg L, Danziger WL, Coben LA, Martin RL. A new clinical scale for the staging of dementia. Br J Psychiatry. 1982;140:566-72.
26. Mioshi E, Dawson K, Mitchell J, Arnold R, Hodges JR. The Addenbrooke’s Cognitive Examination Revised (ACE-R): a brief cognitive test battery for dementia screening. Int J Geriatr Psychiatry. 2006;21:1078-85.
27. Graffar M. Une methode de classiication sociale d’echantillons de
population. Courier. 1956;6:455.
28. Instituto Nacional de Estatística. Classiicação Nacional de Proissões 2010. Lisboa: INE; 2011.
29. Pestana MH, Gageiro JN. Análise de dados para Ciências Sociais: a complementaridade do SPSS, 5a ed. Portugal: Edições Sílabo,
Lda; 2008.
Conclusion
CR can be measured using the CRQ, CRI and a set of variables, such as education, PLA and lifelong occupation. Participants with a greater CR had higher scores on cognitive tests than the elderly with a lower CR. This study found an association between CR and education, occupation and PLA. The favorable psychometric properties of the Portuguese version of the CRQ recommend its use as an instrument to assess CR in Portugal. Patients with
a great CR may beneit from it after the diagnosis of AD.
References
1. Berr C, Wancata J, Ritchie K. Prevalence of dementia in elderly in Europe. Eur Neuropsychopharmacol. 2005;15:463-71.
2. Cummings JL. Alzheimer’s disease. N Engl J Med. 2004;351:56-67. 3. Jalbert JJ, Daiello LA, Lapane KL. Dementia of the Alzheimer type.
Epidemiol Rev. 2008;30:15-34. Epub 2008 Jul 16.
4. Ziegler-Graham K, Brookmeyer R, Johnson E, Arrighi HM. Worldwide variation in the doubling time of Alzheimer’s disease incidence rates. Alzheimers Dement. 2008;4:316-23.
5. Katzman R, Terry R, DeTeresa R, Brown T, Davies P, Fuld P, et al. Clinical, pathological, and neurochemical changes in dementia: a subgroup with preserved mental status and numerous neocortical plaques. Ann Neurol. 1988;23:138-44.
6. Siedlecki KL, Stern Y, Reuben A, Sacco RL, Elkind MS, Wright CB. Construct validity of cognitive reserve in a multiethnic cohort: The Northern Manhattan Study. J Int Neuropsychol Soc. 2009;15:558-69.
7. Scarmeas N, Albert SM, Manly JJ, Stern Y. Education and rates of cognitive decline in incident Alzheimer’s disease. J Neurol Neurosurg Psychiatry. 2006;77:308-16.
8. Stern Y. Cognitive reserve in ageing and Alzheimer’s disease. Lancet Neurol. 2012;11:1006-12.
9. Tucker AM, Stern Y. Cognitive reserve in aging. Curr Alzheimer Res. 2011;8:354-60.
10. Jones RN, Manly J, Glymour MM, Rentz DM, Jefferson AL, Stern Y. Conceptual and measurement challenges in research on cognitive reserve. J Int Neuropsychol Soc. 2011;17:593-601.
Figure 3 - Association between cognitive reserve index (CRI) and cognitive reserve questionnaire (CRQ) scores. 8
7
6
5
4
Mean Cognitive Reserve Index
Medium/high level of cognitive reserve Low level of cognitive reserve
Cognitive Reserve Questionnaire
Correspondence:
Margarida Sobral
Hospital de Magalhães Lemos Rua do Professor Álvaro Rodrigues 4149-003 - Porto - Portugal