Free Levels of Selected Organic Solutes and
Cardiovascular Morbidity and Mortality in
Hemodialysis Patients: Results from the
Retained Organic Solutes and Clinical
Outcomes (ROSCO) Investigators
Tariq Shafi1,2*, Timothy W. Meyer3, Thomas H. Hostetter4, Michal L. Melamed5, Rulan S. Parekh6, Seungyoung Hwang1, Tanushree Banerjee7, Josef Coresh1,2,8, Neil R. Powe7
1Department of Medicine, Division of Nephrology, Johns Hopkins University, Baltimore, Maryland, United States of America,2Welch Center for Prevention, Epidemiology and Clinical Research, Johns Hopkins University, Baltimore, Maryland, United States of America,3Department of Medicine, Division of Nephrology, Veterans Administration Palo Alto Health Care System and Stanford University, Palo Alto, California, United States of America,4Department of Medicine, Case Western University School of Medicine, Cleveland, Ohio, United States of America,5Departments of Medicine and Epidemiology & Population Health, Albert Einstein College of Medicine, Bronx, New York, United States of America,
6Departments of Medicine and Pediatrics, University of Toronto, Toronto, Canada,7Department of Medicine, University of California San Francisco, San Francisco, California, United States of America,
8Departments of Epidemiology and Biostatistics, Johns Hopkins Bloomberg School of Public Health, Baltimore, Maryland, United States of America
*tshafi@jhmi.edu
Abstract
Background and Objectives
Numerous substances accumulate in the body in uremia but those contributing to cardio-vascular morbidity and mortality in dialysis patients are still undefined. We examined the as-sociation of baseline free levels of four organic solutes that are secreted in the native kidney
—p-cresol sulfate, indoxyl sulfate, hippurate and phenylacetylglutamine—with outcomes
in hemodialysis patients.
Design, Setting, Participants and Measurements
We measured these solutes in stored specimens from 394 participants of a US national pro-spective cohort study of incident dialysis patients. We examined the relation of each solute and a combined solute index to cardiovascular mortality and morbidity (first cardiovascular event) using Cox proportional hazards regression adjusted for demographics, comorbidi-ties, clinical factors and laboratory tests including Kt/VUREA.
Results
Mean age of the patients was 57 years, 65% were white and 55% were male. In fully adjust-ed models, a higher p-cresol sulfate level was associatadjust-ed with a greater risk (HR per SD
a11111
OPEN ACCESS
Citation:Shafi T, Meyer TW, Hostetter TH, Melamed ML, Parekh RS, Hwang S, et al. (2015) Free Levels of Selected Organic Solutes and Cardiovascular Morbidity and Mortality in Hemodialysis Patients: Results from the Retained Organic Solutes and Clinical Outcomes (ROSCO) Investigators. PLoS ONE 10(5): e0126048. doi:10.1371/journal. pone.0126048
Academic Editor:Daniel Schneditz, Medical University of Graz, AUSTRIA
Received:January 29, 2015
Accepted:March 28, 2015
Published:May 4, 2015
Copyright:© 2015 Shafi et al. This is an open access article distributed under the terms of the
Creative Commons Attribution License, which permits unrestricted use, distribution, and reproduction in any medium, provided the original author and source are credited.
Data Availability Statement:All data underlying the findings are freely available in the manuscript, supplemental files.
increase; 95% CI) of cardiovascular mortality (1.62; 1.17–2.25; p=0.004) and first
cardio-vascular event (1.60; 1.23–2.08; p<0.001). A higher phenylacetylglutamine level was
asso-ciated with a greater risk of first cardiovascular event (1.37; 1.18–1.58; p<0.001). Patients in
the highest quintile of the combined solute index had a 96% greater risk of cardiovascular mortality (1.96; 1.05–3.68; p=0.04) and 62% greater risk of first cardiovascular event (1.62;
1.12–2.35; p=0.01) compared with patients in the lowest quintile. Results were robust in
sensitivity analyses.
Conclusions
Free levels of uremic solutes that are secreted by the native kidney are associated with a higher risk of cardiovascular morbidity and mortality in incident hemodialysis patients.
Introduction
Cardiovascular disease is the leading cause of morbidity and mortality in dialysis patients but ac-cumulated substances that contribute to cardiovascular morbidity and mortality remain unde-fined. [1–5] These substances are often referred to as organic uremic solutes or uremic toxins.
They vary greatly in their size, distribution and protein binding.[3,6] Urea, the current standard
for dialysis adequacy, is a non-toxic uremic solute that is easily removed by dialysis. Convention-al diConvention-alysis maintains plasma urea levels within five to ten times normConvention-al. Levels of many non-urea
solutes, however, are much less effectively controlled by Kt/VUREA-guided intermittent dialysis
schedules.[4,6–8] Such solutes may contribute to the persistent uremic symptoms and
accelerat-ed cardiovascular disease that has been referraccelerat-ed to as the“Residual Uremic Syndrome”.[9]
The current study examined four solutes—p-cresol sulfate, indoxyl sulfate, hippurate and phenylacetylglutamine—that share the property of colon microbial derivation,[10–14] rapid clearance by secretion in the normal kidney and accumulation in dialysis patients.[8] P-cresol sulfate and indoxyl sulfate have direct vasculotoxic and cytopathic effects and prior studies have suggested an association between the free levels of these solutes and cardiovascular out-comes.[15–25] Hippurate and phenylacetylglutamine also accumulate in dialysis patients but their association with long-term outcomes is not well known. Demonstrating the association of uremic solutes with long-term clinically-relevant outcomes in dialysis patients is an important step in establishing causality between solute accumulation and toxicity and ultimately moving towards reducing toxic levels to improve outcomes.
We measured these four solutes in stored specimens of a national prospective cohort study of incident dialysis patients. The goal of our study was to analyze the longitudinal association between these uremic solutes and cardiovascular morbidity and mortality in dialysis patients.
Methods
Study Design
The Choices for Healthy Outcomes in Caring for ESRD (CHOICE) Study is a national prospec-tive cohort of incident dialysis patients.[26] From October 1995 to June 1998, we enrolled 1,041 participants (767 hemodialysis and 274 peritoneal dialysis) from 19 U.S. states, a median of 45 days after initiation of dialysis (95% within 3.5 months). Eligibility criteria were initiation of maintenance dialysis therapy in the preceding 3 months, ability to provide informed
con-sent, age>18 years and ability to speak English or Spanish. We established a specimen bank
8/2008 to 6/2015 (National Institute of Diabetes & Digestive & Kidney Diseases NIDDK). Dr. Shafi is supported by K23-DK-083514 and National Kidney Foundation of Maryland Professional Development Award. Dr. Parekh was supported by R01-DK-072367. Dr. Coresh is supported in part as an American Heart Association established investigator (01-4019-7N). Dr. Powe is supported in part by K24-DK-02643 and R01-DK-080123. Research reported in this publication was supported by the National Institute of Diabetes and Digestive and Kidney Diseases of the National Institutes of Health. The content is solely the responsibility of the authors and does not necessarily represent the official views of the National Institutes of Health. The reagents for low molecular weight solutesβ-Trace Protein,β2 microglobulin and cystatin C were provided by Siemens to the University of Minnesota, where the measurements were performed. Siemens had no role in the design, analysis, and interpretation of data or the preparation of this manuscript. The funders had no role in study design, data collection and analysis, decision to publish, or preparation of the manuscript.
for all Dialysis Clinic, Inc. (DCI) participants of the CHOICE study. We followed the partici-pants for all-cause mortality through 12/31/2008 and for cardiovascular mortality through 12/ 31/2004. The Johns Hopkins Medicine Institutional Review Board (Baltimore, Maryland) and the DCI Institutional Review Board approved the study and participants provided written in-formed consent. Our sub-study sample includes 521 CHOICE participants from 77 dialysis units with available stored specimens.
Data Collection
Specimens. Detailed methods for CHOICE special blood draws have been published
pre-viously.[27] Briefly, we collected a non-fasting pre-dialysis blood sample, centrifuged at 2500– 3000 revolutions per minute for 15 minutes, separated and refrigerated in the dialysis unit then
shipped on ice and stored at−80° Celsius at the DCI central laboratory (Nashville, TN). For
this study, we thawed the specimens at the central laboratory, aliquoted and mailed by over-night courier on dry ice to the study laboratory (Stanford University) where we stored them at
−80° Celsius until they were thawed for analysis.
Uremic Solutes. P-cresol sulfate, indoxyl sulfate, hippurate and phenylacetylglutamine
were measured by stable isotope dilution liquid chromatography—tandem mass spectrometry in samples of plasma ultrafiltrate prepared using Nanosep 30K Omega separators (Pall, Ann Arbor, MI), as previously described.[28] The reliability correlation coefficients from masked duplicate specimens were 0.971 for p-cresol sulfate, 0.982 for indoxyl sulfate, 0.977 for hippu-rate and 0.972 for phenylacetylglutamine.
Outcomes. Our primary outcomes were cardiovascular mortality and first cardiovascular
event. Secondary outcome was all-cause mortality. We adjudicated mortality using information from clinic report, hospital records, National Death Index, Centers for Medicare & Medicaid Services (CMS) death notification forms, and Social Security records, as previously described. [29] We defined first atherosclerotic cardiovascular event (fatal or nonfatal) as an event due to myocardial infarction, cardiac revascularization procedure, stroke, carotid endarterectomy, ex-tremity gangrene or peripheral revascularization procedure, limb amputation, or abdominal aortic aneurysm repair that occurred after enrolment in the study.[29]
Other Covariates. We collected data on participants’age, sex, race, residual kidney
func-tion (self-reported ability to produce>1 cup of urine daily) and body mass index (BMI). We
adjudicated baseline comorbidities including prevalent cardiovascular disease by abstraction of dialysis unit records, hospital discharge summaries, medication lists, consultation notes, diag-nostic imaging, and cardiac imaging reports and scoring of the Index of Coexistent Disease (ICED) by two trained nurses.
ICED is a validated medical record-derived index that captures both presence and severity
of comorbid conditions.[30,31] It is derived using peak scores from Index of Disease Severity
We obtained routine laboratory data including serum albumin, creatinine, Kt/VUREAand
phosphate from medical records. We assessed residual kidney function in our study in two
dif-ferent ways. First, we used data on self-reported ability to produce>1 cup of urine daily. This
information was available for all study participants (N = 394). Second, we had previously
mea-sured serumβ-trace protein,β2 microglobulin and cystatin C, as markers of residual kidney
function, in a different subsample of the CHOICE Study. Of the 394 patients in this study, 206 patients had data available for these low molecular weight proteins. These measurements were performed at the University of Minnesota.
Statistical Analysis
We compared the baseline characteristics of participants overall and across each solute tertiles using chi-squared tests and linear regression for categorical and continuous variables, respec-tively. Relationships among solutes and blood urea nitrogen were compared using scatterplots and Pearson and Spearman correlation coefficients.
Our initial review of the data revealed some samples with very high values for free levels of p-cresol sulfate and indoxyl sulfate. Comparison with total p-cresol sulfate and indoxyl sulfate levels measured previously using high pressure liquid chromatography (HPLC)[32] also re-vealed unusually high free fractions for these solutes. We identified extreme values based on data distribution in an external dataset of 119 freshly collected and processed plasma samples from 43 patients (S1 Table). Because of the possibility that these extreme values might repre-sent problems with sample handling, we excluded samples with extreme values of either p-cre-sol sulfate or indoxyl sulfate from the primary analysis. However, in sensitivity analyses we tested how robust the finding were when we included the full sample. We defined extreme val-ues as samples with either p-cresol sulfate or indoxyl sulfate above two standard deviation (SD) of the mean based on external data [n = 87 (16.7%)]. Of the remaining samples, we further
ex-cluded samples if either percent free p-cresol sulfate or indoxyl sulfate values were>15% of
total concentration [n = 40 (7.7%)].
Covariates with missing values included body mass index (5.6%), residual kidney function
(3.7%), phosphate (9.4%), creatinine (9.2%), albumin (9.4%) and Kt/VUREA(22.7%). To avoid
listwise deletion,[33] we imputed missing data with 10 data replicates using multiple imputation by the chained equations method implemented by the ice program in STATA. We used Cox proportional hazards regression to model the risk of outcomes per SD increase in solute levels, censoring participants at transplantation or end of study period. We adjusted our analyses for demographics (age, sex and race), clinical characteristics (body mass index, residual kidney
function as defined by self-reported ability to produce>1 cup of urine daily, ICED score,
diabe-tes and cardiovascular disease) and laboratory diabe-tests (albumin, phosphate, creatinine and Kt/
VUREA). We checked proportional hazards assumptions by tests of Schoenfeld residuals.[34]
In additional analyses, we sought to determine the combined effects of high levels of multi-ple solutes (combined solute index). We generated this index by first standardizing the value of each solute (mean = 0; SD = 1) followed by categorization of the standardized values into dec-iles (range 1–10) and then creating an average of the decile category for each participant. We analyzed this combined solute index as a continuous and a categorical (quintiles) variable.
We generated graphical displays of the adjusted hazard of outcomes with the solutes and the combined solute index modeled as restricted cubic spline with 3 knots to allow for the visu-al assessment of the functionvisu-al association between solutes and outcomes. We investigated non-linear associations by incorporating splines in our analysis based on these graphical dis-plays. Sensitivity analyses included analyses of the full cohort without excluding extreme values
with previously measured low molecular weight proteins (serumβ-trace protein,β2 microglo-bulin and cystatin C), we explored further adjustment for residual kidney function by adding these low molecular weight proteins to the primary analysis Cox model. This analysis is there-fore adjusted for: demographics (age, sex and race), clinical characteristics (body mass index,
residual kidney function as defined by self-reported ability to produce>1 cup of urine daily,
ICED score, diabetes and cardiovascular disease), laboratory tests (albumin, phosphate,
creati-nine and Kt/VUREA) and residual kidney function biomarkers (serumβ-trace protein,β2
microglobulin and cystatin C).
Statistical analyses were performed using STATA software, version 12.1 (Stata Corp.www.
stata.com). Statistical significance was defined asp<0.05 using two-tailed tests.
Results
Baseline Characteristics
There were 521 hemodialysis participants with available stored samples. After excluding those with extreme values from our primary analysis, our final cohort included 394 participants from 73 dialysis units. Participants included versus excluded were less likely to be white or have car-diovascular disease, had slightly lower urea, hemoglobin and higher albumin (S2 Table). Table 1describes the overall characteristics of the 394 participants. The average age of the par-ticipants was 57 years, 65% were white and 55% were male.
Uremic Solutes
S3 Tablepresents the concentrations of solutes overall and after exclusion of extreme values. After exclusion, the free concentrations of all four solutes were lower and had less variance. The correla-tion between the total and free concentracorrela-tions of solutes improved after removal of extreme obser-vations. The correlation between total and free p-cresol sulfate improved from 0.525 to 0.832 and between total and free indoxyl sulfate improved from 0.646 to 0.838. There was moderate correla-tion between all solutes except for p-cresol and hippurate which showed weak correlacorrela-tion (Fig 1).
There was weak correlation between the solutes and predialysis urea (S1 Fig).S4 Tabledescribe
the characteristics of the 394 participants by tertiles of the solutes. Older age was associated with higher p-cresol sulfate, indoxyl sulfate and phenylacetylglutamine. Those with diabetes and higher random blood glucose were more likely to have lower indoxyl sulfate and hippurate. Higher potas-sium was associated with higher concentration of all solutes. Higher creatinine, phosphate and al-bumin were associated with higher concentrations of indoxyl sulfate, hippurate and
phenylacetylglutamine. Presence of residual kidney function (self-reported urine output>1 cup
daily) was associated with lower levels of phenylacetylglutamine but none of the other solutes.
Cardiovascular Mortality
There were 121 cardiovascular deaths over 1,393 person-years of follow-up (median 3.4 years). In fully adjusted analyses, p-cresol sulfate was associated with a higher risk of cardiovascular
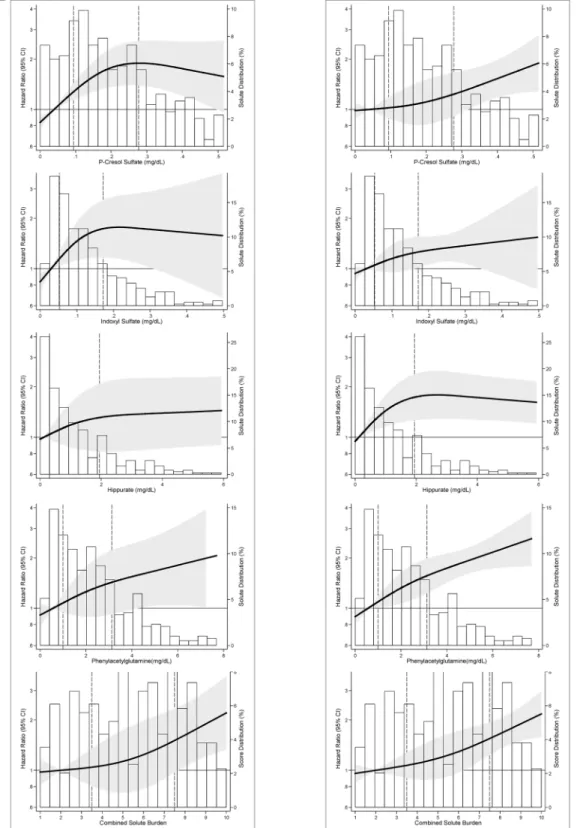
death [hazard ratio per SD increase (HRPerSD), 1.62; 95% CI, 1.17–2.25; p = 0.004;Table 2].Fig
2Adisplays the adjusted hazard of cardiovascular mortality with the solutes. Hippurate and
phenylacetylglutamine had a linear increase in risk. P-cresol sulfate had a linear increase in risk
below the 75thpercentile (HRPerSD, 2.57; 95% CI, 1.19–4.75; p = 0.003) with attenuation of the
hazard above this level although the change in slope did not reach statistical significance
(p-value for change in slope = 0.13;S5 Table). Indoxyl sulfate also had a functional association
similar to p-cresol sulfate (HRPerSDbelow 75thpercentile, 1.83; 95% CI, 0.98–3.42; p = 0.06) but
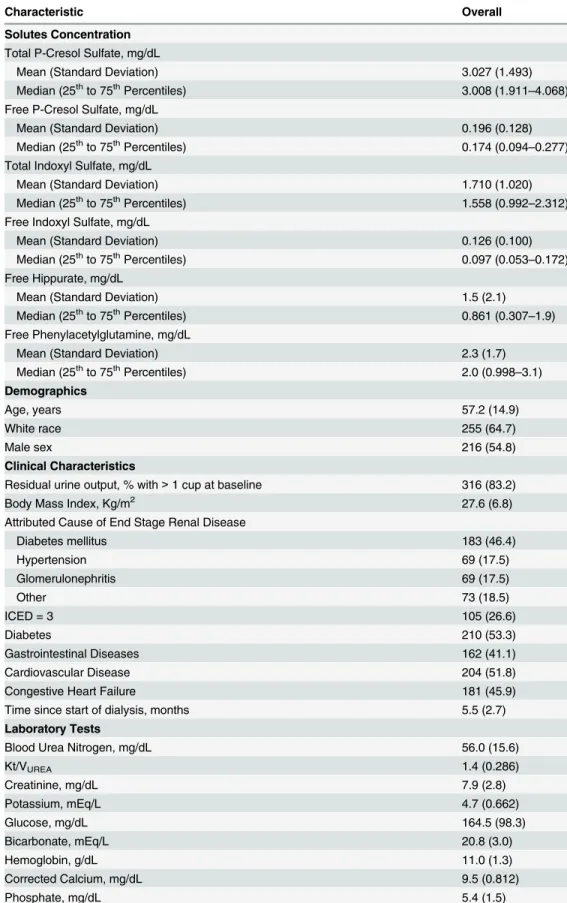
Table 1. Baseline Characteristics of 394 Hemodialysis Participants of the CHOICE Study.
Characteristic Overall
Solutes Concentration
Total P-Cresol Sulfate, mg/dL
Mean (Standard Deviation) 3.027 (1.493)
Median (25thto 75thPercentiles) 3.008 (1.911
–4.068)
Free P-Cresol Sulfate, mg/dL
Mean (Standard Deviation) 0.196 (0.128)
Median (25thto 75thPercentiles) 0.174 (0.094
–0.277)
Total Indoxyl Sulfate, mg/dL
Mean (Standard Deviation) 1.710 (1.020)
Median (25thto 75thPercentiles) 1.558 (0.992
–2.312)
Free Indoxyl Sulfate, mg/dL
Mean (Standard Deviation) 0.126 (0.100)
Median (25thto 75thPercentiles) 0.097 (0.053–0.172)
Free Hippurate, mg/dL
Mean (Standard Deviation) 1.5 (2.1)
Median (25thto 75thPercentiles) 0.861 (0.307
–1.9)
Free Phenylacetylglutamine, mg/dL
Mean (Standard Deviation) 2.3 (1.7)
Median (25thto 75thPercentiles) 2.0 (0.998
–3.1) Demographics
Age, years 57.2 (14.9)
White race 255 (64.7)
Male sex 216 (54.8)
Clinical Characteristics
Residual urine output, % with>1 cup at baseline 316 (83.2)
Body Mass Index, Kg/m2 27.6 (6.8)
Attributed Cause of End Stage Renal Disease
Diabetes mellitus 183 (46.4)
Hypertension 69 (17.5)
Glomerulonephritis 69 (17.5)
Other 73 (18.5)
ICED = 3 105 (26.6)
Diabetes 210 (53.3)
Gastrointestinal Diseases 162 (41.1)
Cardiovascular Disease 204 (51.8)
Congestive Heart Failure 181 (45.9)
Time since start of dialysis, months 5.5 (2.7)
Laboratory Tests
Blood Urea Nitrogen, mg/dL 56.0 (15.6)
Kt/VUREA 1.4 (0.286)
Creatinine, mg/dL 7.9 (2.8)
Potassium, mEq/L 4.7 (0.662)
Glucose, mg/dL 164.5 (98.3)
Bicarbonate, mEq/L 20.8 (3.0)
Hemoglobin, g/dL 11.0 (1.3)
Corrected Calcium, mg/dL 9.5 (0.812)
Phosphate, mg/dL 5.4 (1.5)
First Cardiovascular Event
There were 217 cardiovascular events. In the unadjusted and fully adjusted models, both p-cre-sol sulfate and phenylacetylglutamine were associated with the risk of first cardiovascular event
(Table 2).Fig 2Bdemonstrates the linear association between hippurate and first
Table 1. (Continued)
Characteristic Overall
Albumin, g/dL 3.8 (0.357)
CRP, mg/L (median, 25th–75thpercentiles) 0.392 (0.168–0.947)
IL-6, mg/L (median, 25th
–75thpercentiles) 4.1 (2.5–7.4)
Note: Numbers presented are mean (standard deviation) or percent unless otherwise specified.
Conversion factors for units: albumin in g/dL to g/L, x 10; calcium in mg/dL to mmol/L, x 0.2495; phosphate in mg/dL to mmol/L, x 0.3229; hemoglobin in g/dL to g/L, x 10; BUN in mg/dL to urea in mmol/L, x 0.357; creatinine in mg/dL toμmol/L, x 88.4; p-cresol sulfate in mg/dL toμmol/L, x 53.1; indoxyl sulfate in mg/dL toμmol/L, x 46.9; hippuric acid in mg/dL toμmol/L, x 55.8; phenylacetylglutamine in mg/dL toμmol/L, x 37.8.
No conversion is necessary for potassium and bicarbonate in mEq/L to mmol/L.
Abbreviations: ICED: Index of Coexistent Disease Score; Kt/V: dialysis dose (K-dialyzer clearance of urea, t-dialysis time, V-volume of distribution of urea); CRP: C-Reactive Protein; IL-6: Interleukin 6
doi:10.1371/journal.pone.0126048.t001
Fig 1. Correlations between Solutes in 394 Incident Hemodialysis Patients of the CHOICE Study.
Scatterplots demonstrate the association between the solutes. Dots represent to concentrations of the two solutes on scatterplot. Line represents the linear fit between the two solutes. Spearman and Pearson correlation coefficients are also reported in a text box. P-values for all correlations were0.001 for both Spearman and Pearson correlations.
cardiovascular event below the 75thpercentile (HRPerSD, 1.69; 95% CI, 1.11–2.56; p = 0.01)
with attenuation of the hazard above this level (p-value for change in slope 0.01;S5 Table).
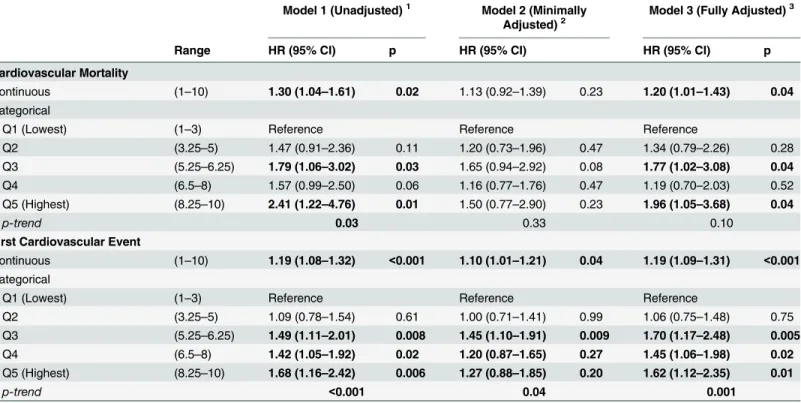
Combined Solute Index
The combined solute index was associated with older age and higher urea, creatinine, potassi-um and phosphate (S6 Table). Those in the highest quintile for combined solute index had a 96% higher risk of cardiovascular death (HR, 1.96; 95% CI, 1.05–3.68; p = 0.04) and a 62% higher risk of first cardiovascular event (HR, 1.62; 95% CI, 1.12–2.35; p = 0.01) compared with
those in the lowest quintiles (Table 3andFig 2). A combined solute index that includes only
p-cresol sulfate and phenylacetylglutamine showed results that were generally similar to the asso-ciations with the combined solute index with all four solutes (S7 Table).
Secondary Outcome: All-Cause Mortality
There were 236 deaths during follow-up. In fully adjusted models, none of the solutes were as-sociated with a statistically significant association with death although p-cresol, hippurate and
phenylacetylglutamine had a trend towards increased risk of death (S8 TableandS2 Fig).
Sensitivity Analyses
Analysis of the full cohort without excluding extreme observations (n = 521) showed results similar to the primary analysis in terms of magnitude and direction of effect (S9 Table).
Re-stricting primary analysis to the subgroup with available Kt/VUREA(n = 303) also showed
simi-lar results (data not shown). In the subset of 206 patients with data on low molecusimi-lar weight
proteins (β-trace protein,β2 microglobulin and cystatin C), measured as markers of residual
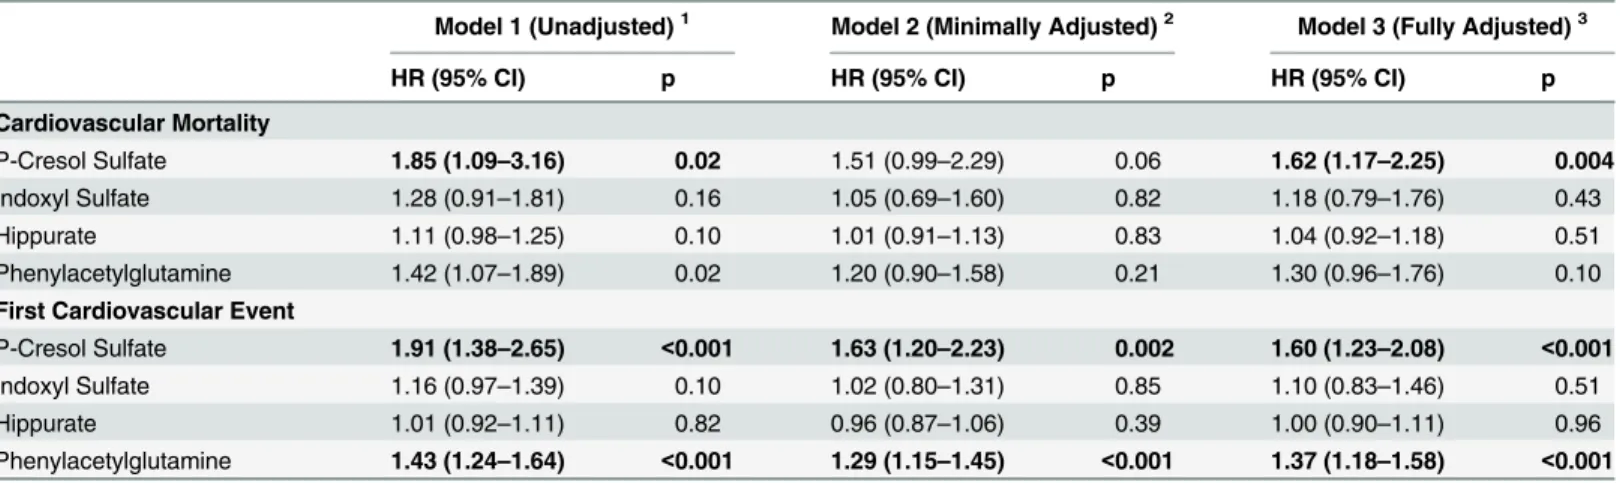
Table 2. Association of Uremic Solutes with Outcomes among 394 Hemodialysis Participants of the CHOICE Study.
Model 1 (Unadjusted)1 Model 2 (Minimally Adjusted)2 Model 3 (Fully Adjusted)3
HR (95% CI) p HR (95% CI) p HR (95% CI) p
Cardiovascular Mortality
P-Cresol Sulfate 1.85 (1.09–3.16) 0.02 1.51 (0.99–2.29) 0.06 1.62 (1.17–2.25) 0.004
Indoxyl Sulfate 1.28 (0.91–1.81) 0.16 1.05 (0.69–1.60) 0.82 1.18 (0.79–1.76) 0.43
Hippurate 1.11 (0.98–1.25) 0.10 1.01 (0.91–1.13) 0.83 1.04 (0.92–1.18) 0.51
Phenylacetylglutamine 1.42 (1.07–1.89) 0.02 1.20 (0.90–1.58) 0.21 1.30 (0.96–1.76) 0.10 First Cardiovascular Event
P-Cresol Sulfate 1.91 (1.38–2.65) <0.001 1.63 (1.20–2.23) 0.002 1.60 (1.23–2.08) <0.001
Indoxyl Sulfate 1.16 (0.97–1.39) 0.10 1.02 (0.80–1.31) 0.85 1.10 (0.83–1.46) 0.51
Hippurate 1.01 (0.92–1.11) 0.82 0.96 (0.87–1.06) 0.39 1.00 (0.90–1.11) 0.96
Phenylacetylglutamine 1.43 (1.24–1.64) <0.001 1.29 (1.15–1.45) <0.001 1.37 (1.18–1.58) <0.001
Abbreviations: HR, Hazard Ratio; CI, Confidence Interval.
Hazard ratio per 1 standard deviation increase in the solute level modeled using Cox proportional hazards regression.
1Model 1: Crude model without adjustment.
2Model 2: Minimally adjusted: HR adjusted for demographics (age, sex and race).
3Model 3: Fully adjusted: HR adjusted for demographics (age, sex and race), clinical characteristics [body mass index, residual kidney function
(self-reported ability to produce>1 cup of urine daily), Index of Coexistent Disease (ICED) score, diabetes and cardiovascular disease] and laboratory tests (Kt/
VUREA, albumin, phosphate and creatinine).
Note: Mean (Standard Deviation) for the free solutes are: P-cresol sulfate 0.196 (0.128) mg/dL; Indoxyl Sulfate 0.126 (0.100) mg/dL; Hippurate 1.5 (2.1) mg/dL and Phenylacetylglutamine 2.3 (1.7) mg/dL.
Fig 2. Adjusted Relative Hazard of Outcomes in 394 Incident Hemodialysis Patients of the CHOICE Study. Panel 2A:Adjusted hazard of Cardiovascular Mortality.Panel 2B:Adjusted hazard of First Cardiovascular Event. Relative hazard predicted using Cox proportional hazards regression adjusted for demographics (age, sex and race), clinical characteristics [body mass index, residual kidney function (self-reported ability to produce>1 cup of urine daily), Index of Coexistent Disease (ICED) score, diabetes and cardiovascular disease] and laboratory tests (Kt/VUREA, albumin, phosphate and
creatinine). Solutes and combined solute index are modeled as restricted cubic splines with knots at the 10th, 50th, and 90th percentiles. The solid line is the adjusted HR; 10th percentile is used as the reference (HR = 1). The shaded area is the 95% CI of the HR. Bars are the frequency histogram, showing the distribution of each solute and combined solute index. Vertical broken lines mark the 25thand 75thpercentile of the distribution.
kidney function, there was weak correlation with p-cresol sulfate (S3 Fig) and moderate corre-lation with indoxyl sulfate (S4 Fig), hippurate (S5 Fig) and phenylacetylglutamine (S6 Fig).
Further adjusting for residual kidney function biomarkers (serumβ-trace protein,β2
microglo-bulin and cystatin C) in addition to the variables in Model 4 [demographics (age, sex and race), clinical characteristics (body mass index, residual kidney function as defined by self-reported
ability to produce>1 cup of urine daily, ICED score, diabetes and cardiovascular disease),
Table 3. Association of Combined Solute Index Quintiles and Outcomes among 394 Hemodialysis Participants of the CHOICE Study. Model 1 (Unadjusted)1 Model 2 (Minimally
Adjusted)2
Model 3 (Fully Adjusted)3
Range HR (95% CI) p HR (95% CI) HR (95% CI) p
Cardiovascular Mortality
Continuous (1–10) 1.30 (1.04–1.61) 0.02 1.13 (0.92–1.39) 0.23 1.20 (1.01–1.43) 0.04
Categorical
Q1 (Lowest) (1–3) Reference Reference Reference
Q2 (3.25–5) 1.47 (0.91–2.36) 0.11 1.20 (0.73–1.96) 0.47 1.34 (0.79–2.26) 0.28
Q3 (5.25–6.25) 1.79 (1.06–3.02) 0.03 1.65 (0.94–2.92) 0.08 1.77 (1.02–3.08) 0.04
Q4 (6.5–8) 1.57 (0.99–2.50) 0.06 1.16 (0.77–1.76) 0.47 1.19 (0.70–2.03) 0.52
Q5 (Highest) (8.25–10) 2.41 (1.22–4.76) 0.01 1.50 (0.77–2.90) 0.23 1.96 (1.05–3.68) 0.04
p-trend 0.03 0.33 0.10
First Cardiovascular Event
Continuous (1–10) 1.19 (1.08–1.32) <0.001 1.10 (1.01–1.21) 0.04 1.19 (1.09–1.31) <0.001
Categorical
Q1 (Lowest) (1–3) Reference Reference Reference
Q2 (3.25–5) 1.09 (0.78–1.54) 0.61 1.00 (0.71–1.41) 0.99 1.06 (0.75–1.48) 0.75
Q3 (5.25–6.25) 1.49 (1.11–2.01) 0.008 1.45 (1.10–1.91) 0.009 1.70 (1.17–2.48) 0.005
Q4 (6.5–8) 1.42 (1.05–1.92) 0.02 1.20 (0.87–1.65) 0.27 1.45 (1.06–1.98) 0.02
Q5 (Highest) (8.25–10) 1.68 (1.16–2.42) 0.006 1.27 (0.88–1.85) 0.20 1.62 (1.12–2.35) 0.01
p-trend <0.001 0.04 0.001
Abbreviations: HR, Hazard Ratio; CI, Confidence Interval.
Hazard ratio per 1 standard deviation increase in the combined solute index in the continuous analysis modeled using Cox proportional hazards regression.
Note: Mean (Standard Deviation) for combined solute index is 5.5 (2.4).
1Model 1: Crude model without adjustment.
2Model 2: Minimally adjusted: HR adjusted for demographics (age, sex and race).
3Model 3: Fully adjusted: HR adjusted for demographics (age, sex and race), clinical characteristics [body mass index, residual kidney function
(self-reported ability to produce>1 cup of urine daily), Index of Coexistent Disease (ICED) score, diabetes and cardiovascular disease] and laboratory tests (Kt/ VUREA, albumin, phosphate and creatinine).
NOTE: Combined solute index is calculated as follows
1)Generate standardized value of each solute with a mean of 0 and standard deviation of 1. 2)For each standardized solute create deciles based on percentiles of the data (range 1
–10) 3)Calculate the combined solute index by averaging the decile category for each participant 4)Generate quintiles of the combined solute index. The lowest quintile is the reference.
laboratory tests (albumin, phosphate, creatinine and Kt/VUREA)], did not change the direction
of effect for p-cresol sulfate and phenylacetylglutamine (S10 Table).
Discussion
In this report from a US national prospective cohort of incident hemodialysis patients from 73 dialysis centers, we found that colon-derived organic solutes that are removed by the native kidney by secretion had a graded association with cardiovascular morbidity and mortality. Plasma p-cresol sulfate was associated with a 62% higher risk of cardiovascular mortality and a 60% higher risk of first cardiovascular event and plasma phenylacetylglutamine was associated with a 37% higher risk of first cardiovascular event, per 1 SD higher solute concentration. Pa-tients in the highest quintile of combined solute index that incorporated the four solutes mea-sured in this study (p-cresol sulfate, indoxyl sulfate, hippurate and phenylacetylglutamine) had a 96% higher risk of cardiovascular mortality and 62% higher risk of first cardiovascular event compared to those in the lowest quintile. Our findings suggest that these four accumulated non-urea solutes in dialysis patients may be associated with toxicity and, in particular, a higher risk of cardiovascular events.
Advancing kidney failure leads to accumulation of numerous substances that are cleared by the native kidney by glomerular filtration, tubular secretion and tubular uptake. The four sol-utes studied share the property of colon microbial derivation as well as rapid clearance by se-cretion in the normal kidney. P-cresol sulfate (187 Da) is the sulfate of p-cresol made through the action of the unusual microbial enzyme 4-hydroxyphenylacetate decarboxylase on 4-hydroxyphenylacetate which is derived from tyrosine and from plant polyphenols.[10–12, 14] Indoxyl sulfate (212 Da) is the sulfate of indoxyl made from indole produced by the action of microbial tryptophanase on tryptophan. Hippurate (178 Da) is the glycine conjugate of ben-zoic acid which is partially derived from colon microbial action on various plant compounds. [35–38] Phenylacetylglutamine (263 Da) is the glutamine conjugate of phenylacetic acid which
is produced almost exclusively by the action of colon microbes on phenylalanine.[13,39]
Con-ventionally“adequate”dialysis dose guided by Kt/VUREAmaintains predialysis urea (60 Da) at
a low level but is much less effective in controlling the levels of these other solutes. We recently found that expressed as multiple of their average concentrations in normal subjects, the pre-di-alysis free concentrations of p-cresol sulfate (41-fold higher), indoxyl sulfate (111-fold higher), hippurate (108-fold higher) and phenylacetylglutamine (122-fold higher) were strikingly great-er than those of urea (5-fold highgreat-er) or creatinine (13-fold highgreat-er) in hemodialysis patients. [28] P-cresol sulfate accumulation can cause shedding of endothelial microparticles that impair
nitric oxide signaling and induce endothelial dysfunction.[22,23] Indoxyl sulfate accumulation
can cause impairment of cellular oxidative systems leading to free radical generation which can
cause toxicity in the renal tubular cells and vascular endothelium.[17,24] There has been less
consideration of toxicity from hippurate and phenylacetylglutamine. The current study dem-onstrates an association between solute accumulation and cardiovascular events suggesting the retained solutes might indeed be toxic.
A number of earlier, smaller, studies have reported an association between free p-cresol fate, indoxyl sulfate and outcomes in dialysis patients. In a single center study, free p-cresol sul-fate and indoxyl sulsul-fate measured in a cohort of chronic kidney disease patients (including 44
on dialysis) were associated with risk of death.[16,18] In another single center study of
p = 0.02).[15] Another group of investigators reported an association between p-cresol sulfate and risk of cardiovascular events in 50 hemodialysis patients (HR for free p-cresol sulfate, 1.66;
p<0.01) and 46 peritoneal dialysis patients (HR for total p-cresol, 1.05; p<1.01).(19, 20) In a
single center study of 112 prevalent hemodialysis patients, both free p-cresol sulfate and indox-yl sulfate were associated with the risk of death (HR 1.01 for p-cresol and 1.10 for indoxindox-yl sul-fate).[25] We had previously reported in the same cohort as this study that total (free and bound) p-cresol sulfate and indoxyl sulfate were not associated with outcomes in incident dial-ysis patients.[32] A reanaldial-ysis of the total solutes data, restricting to the 394 participants in-cluded in this study demonstrated that total p-cresol sulfate was associated with 21% higher risk of cardiovascular mortality per SD higher level (S11 Table). The reasons for the discrepan-cy between the relation of total and free solutes levels to outcomes cannot be known with cer-tainty. We presume the free level is a better indicator of the potential toxicity of uremic solutes, as tissues are exposed to free solute levels. Confounding by albumin concentration may be an-other explanation. A higher albumin concentration tends to increase the total solute level for any given free solute level, and higher albumin concentrations are also associated with better outcomes in dialysis patients.[40] It is possible that unmeasured solutes also compete for the same binding sites on albumin. A high total burden of such solutes will tend to impair the bind-ing of individual solutes. As a result, among patients with the same total levels of a particular solute, those with the higher aggregate solute burden would have higher free levels of that ute and measurement only of total solute levels could tend to conceal an association of that sol-ute with poor outcomes.
We noted approximately 25% reduction in the hazard estimates (log HR) for p-cresol sulfate and phenylacetylglutamine compared with no change with hippurate after adjustment for age, sex and race (Table 2, Model 2). Although the direction of effects did not change and the confi-dence intervals overlap, these findings appear intriguing. They could reflect partial adjustment for comorbidities with adjustment for age as older age is associated with more comorbidities. Older age could also mean a longer cumulative exposure to uremic toxins, perhaps even prior to start of dialysis, leading to higher uremic vasculopathy. Biological differences in sex and race or associated environmental and social determinants may also contribute to variations in sol-utes. These findings are hypothesis generating and should be confirmed in other studies.
In conclusion, in this national prospective study of incident dialysis patients in the US, we demonstrate an association between free levels of colon-derived organic solutes that are nor-mally removed by the native kidney by secretion and cardiovascular outcomes. Our findings suggest that these solutes that are not adequately cleared by conventional dialysis may contrib-ute to morbidity and mortality in dialysis patients. Replication of our findings in other large prospective cohorts will provide further scientific evidence to pursue clinical trials targeted to
reducing solute production, improving dialytic removal or both.[3,4,6,42–52]
Supporting Information
S1 Fig. Correlations between Predialysis Urea and Solutes in 303 Incident Hemodialysis
Patients of the CHOICE Study.Scatterplots demonstrate the association between predialysis
urea and solutes. Dots represent to concentrations of the two solutes on scatterplot. Line repre-sents the linear fit between the two solutes. Spearman and Pearson correlation coefficients are
also reported in a text box. P-values for all correlations were0.001 for both Spearman and
Pearson correlations. (TIFF)
S2 Fig. Adjusted Relative Hazard of All-Cause Mortality in 394 Incident Hemodialysis
Pa-tients of the CHOICE Study.Relative hazard predicted using Cox proportional hazards
re-gression adjusted for demographics (age, sex and race), clinical characteristics [body mass
index, residual kidney function (self-reported ability to produce>1 cup of urine daily), Index
of Coexistent Disease (ICED) score, diabetes and cardiovascular disease] and laboratory tests
(Kt/VUREA, albumin, phosphate and creatinine). Solutes and combined solute index are
mod-eled as restricted cubic splines with knots at the 10th, 50th, and 90th percentiles. The solid line is the adjusted HR; 10th percentile is used as the reference (HR = 1). The shaded area is the 95% CI of the HR. Bars are the frequency histogram, showing the distribution of each solute
and combined solute index. Vertical broken lines mark the 25thand 75thpercentile of
the distribution. (TIFF)
S3 Fig. Correlations between P-Cresol Sulfate and Low Molecular Weight Proteins in 206
Incident Hemodialysis Patients of the CHOICE Study.Scatterplots demonstrate the
associa-tion of p-cresol sulfate withβ-Trace Protein,β2 microglobulin and cystatin C. Dots represent
concentrations of the two solutes on scatterplot. Line represents the linear fit between the two solutes. Spearman and Pearson correlation coefficients are also reported in a text box. (TIFF)
S4 Fig. Correlations between Indoxyl Sulfate and Low Molecular Weight Proteins in 206
Incident Hemodialysis Patients of the CHOICE Study.Scatterplots demonstrate the
associa-tion of indoxyl sulfate withβ-Trace Protein,β2 microglobulin and cystatin C. Dots represent
concentrations of the two solutes on scatterplot. Line represents the linear fit between the two solutes. Spearman and Pearson correlation coefficients are also reported in a text box. (TIFF)
S5 Fig. Correlations between Indoxyl Sulfate and Low Molecular Weight Proteins in 206
Incident Hemodialysis Patients of the CHOICE Study.Scatterplots demonstrate the
associa-tion of indoxyl sulfate withβ-Trace Protein,β2 microglobulin and cystatin C. Dots represent
S6 Fig. Correlations between Hippurate and Low Molecular Weight Proteins in 206
Inci-dent Hemodialysis Patients of the CHOICE Study.Scatterplots demonstrate the association
of hippurate withβ-Trace Protein,β2 microglobulin and cystatin C. Dots represent
concentra-tions of the two solutes on scatterplot. Line represents the linear fit between the two solutes. Spearman and Pearson correlation coefficients are also reported in a text box.
(TIFF)
S1 Table. P-Cresol Sulfate and Indoxyl Sulfate Levels from 43 Patients with Freshly Collect-ed and ProcessCollect-ed Specimens.
(DOCX)
S2 Table. Comparison of the Baseline Characteristics of the Included versus Excluded Par-ticipants.
(DOCX)
S3 Table. Concentrations of Solutes Before and After Excluding Extreme Observations.
(DOCX)
S4 Table. Baseline Characteristics of 394 Hemodialysis Participants of the CHOICE Study by Tertiles of P-Cresol Sulfate (S4A_Table), Indoxyl Sulfate (S4B_Table), Hippurate (S4C_Table) and Phenylacetylglutamine (S4D_Table).
(DOCX)
S5 Table. Spline Models and Outcomes among 394 Hemodialysis Participants of the CHOICE Study.
(DOCX)
S6 Table. Baseline Characteristics of 394 Hemodialysis Participants of the CHOICE Study by Quintiles of Solute Score.
(DOCX)
S7 Table. Association of Combined Solute Index and Outcomes among 394 Hemodialysis Participants of the CHOICE Study (Model 3, Fully Adjusted).
(DOCX)
S8 Table. Association of Uremic Solutes with All-Cause Mortality among 394 Hemodialysis Participants of the CHOICE Study.
(DOCX)
S9 Table. Association of Uremic Solutes and Outcomes among 521 Hemodialysis Partici-pants of the CHOICE Study (Without Excluding Extreme Values).
(DOCX)
S10 Table. Association of Uremic Solutes with Outcomes among 206 Hemodialysis Partici-pants of the CHOICE Study (With Data on Low Molecular Weight Proteins).
(DOCX)
S11 Table. Comparison of Total Solutes Results with Previous Analysis of Total Solute Lev-els and Outcomes.
(DOCX)
Acknowledgments
We thank the Cardiovascular Endpoint Committee: Bernard G. Jaar, MD, MPH; Michael J. Choi, MD; Josef Coresh, MD, PhD; Joseph A. Eustace, MD, MHS; Nancy E. Fink, MPH; Caro-line Fox, MD, MPH; Melanie H. Katzman, MD, MHS; Michael J. Klag, MD, MPH; Yongmei Liu, MD, PhD; J. Craig Longenecker, MD, PhD; Michal Melamed, MD, MHS; Laura C. Plan-tinga, ScM; Neil R. Powe, MD, MPH, MBA; Renuka Sothinathan, MD, MHS; Richard M. Ugarte, MD, MHS and Gayanne Yenokian, MD.
This work was presented in abstract form at the 2013 Annual Meeting of the American Soci-ety of Nephrology in Atlanta, GA, November 7–10, 2013.
Disclosure:Parts of this work were presented at the 2013 Annual Meeting of the American
Society of Nephrology, November 5–10, 2013, Atlanta, Georgia.
Author Contributions
Conceived and designed the experiments: TS TWM THH MLM RSP SH TB JC NRP. Per-formed the experiments: TS TWM THH MLM RSP SH TB JC NRP. Analyzed the data: TS SH. Contributed reagents/materials/analysis tools: TWM. Wrote the paper: TS TWM THH MLM RSP SH TB JC NRP.
References
1. U S Renal Data System, USRDS 2013 Annual Data Report: Atlas of Chronic Kidney Disease and End-Stage Renal Disease in the United States, National Institutes of Health, National Institute of Diabetes and Digestive and Kidney Diseases, Bethesda, Maryland. 2015; 4: 2. Available:http://www.usrds.org/ atlas13.aspx.
2. Foley RN, Parfrey PS, Sarnak MJ. Epidemiology of cardiovascular disease in chronic renal disease. J Am Soc Nephrol. 1998; 9(12 Suppl):S16–23. PMID:11443763
3. Dobre M, Meyer TW, Hostetter TH. Searching for uremic toxins. Clin J Am Soc Nephrol. 2013; 8 (2):322–7. doi:10.2215/CJN.04260412PMID:23024165
4. Duranton F, Cohen G, De Smet R, Rodriguez M, Jankowski J, Vanholder R, et al. Normal and patholog-ic concentrations of urempatholog-ic toxins. J Am Soc Nephrol. 2012; 23(7):1258–70. doi:10.1681/ASN.
2011121175PMID:22626821
5. Meyer TW, Hostetter TH. Uremia. N Engl J Med. 2007; 357(13):1316–25. PMID:17898101
6. Meyer TW, Sirich TL, Hostetter TH. Dialysis cannot be dosed. Semin Dial. 2011; 24(5):471–9. doi:10.
1111/j.1525-139X.2011.00979.xPMID:21929590
7. Rhee EP, Souza A, Farrell L, Pollak MR, Lewis GD, Steele DJ, et al. Metabolite profiling identifies mark-ers of uremia. J Am Soc Nephrol. 2010; 21(6):1041–51. doi:10.1681/ASN.2009111132PMID:
20378825
8. Sirich TL, Funk BA, Plummer NS, Hostetter TH, Meyer TW. Prominent accumulation in hemodialysis patients of solutes normally cleared by tubular secretion. J Am Soc Nephrol. 2014; 25(3):615–22. doi:
10.1681/ASN.2013060597PMID:24231664
9. Depner TA. Is Kt/V Urea a Satisfactory Measure for Dosing the Newer Dialysis Regimens? Semin Dial. 2001; 14(1):9–12. PMID:11208030
10. Meijers BK, Evenepoel P. The gut-kidney axis: indoxyl sulfate, p-cresyl sulfate and CKD progression. Nephrol Dial Transplant. 2011; 26(3):759–61. doi:10.1093/ndt/gfq818PMID:21343587
11. Rechner AR, Smith MA, Kuhnle G, Gibson GR, Debnam ES, Srai SK, et al. Colonic metabolism of die-tary polyphenols: influence of structure on microbial fermentation products. Free Radic Biol Med. 2004; 36(2):212–25. PMID:14744633
12. Russell WR, Duncan SH, Scobbie L, Duncan G, Cantlay L, Calder AG, et al. Major phenylpropanoid-derived metabolites in the human gut can arise from microbial fermentation of protein. Mol Nutr Food Res. 2013; 57(3):523–35. doi:10.1002/mnfr.201200594PMID:23349065
13. Seakins JW. The determination of urinary phenylacetylglutamine as phenylacetic acid. Studies on its origin in normal subjects and children with cystic fibrosis. Clin Chim Acta. 1971; 35(1):121–31. PMID:
5126986
14. Yu L, Blaser M, Andrei PI, Pierik AJ, Selmer T. 4-Hydroxyphenylacetate decarboxylases: properties of a novel subclass of glycyl radical enzyme systems. Biochemistry. 2006; 45(31):9584–92. PMID:
15. Bammens B, Evenepoel P, Keuleers H, Verbeke K, Vanrenterghem Y. Free serum concentrations of the protein-bound retention solute p-cresol predict mortality in hemodialysis patients. Kidney Int. 2006; 69(6):1081–7. PMID:16421516
16. Barreto FC, Barreto DV, Liabeuf S, Meert N, Glorieux G, Temmar M, et al. Serum indoxyl sulfate is as-sociated with vascular disease and mortality in chronic kidney disease patients. Clin J Am Soc Nephrol. 2009; 4(10):1551–8. doi:10.2215/CJN.03980609PMID:19696217
17. Fujii H, Nakai K, Fukagawa M. Role of oxidative stress and indoxyl sulfate in progression of cardiovas-cular disease in chronic kidney disease. Ther Apher Dial. 2011; 15(2):125–8. doi:10.1111/j.1744-9987.
2010.00883.xPMID:21426501
18. Liabeuf S, Barreto DV, Barreto FC, Meert N, Glorieux G, Schepers E, et al. Free p-cresylsulphate is a predictor of mortality in patients at different stages of chronic kidney disease. Nephrol Dial Transplant. 2010; 25(4):1183–91. doi:10.1093/ndt/gfp592PMID:19914995
19. Lin CJ, Chuang CK, Jayakumar T, Liu HL, Pan CF, Wang TJ, et al. Serum p-cresyl sulfate predicts car-diovascular disease and mortality in elderly hemodialysis patients. Arch Med Sci. 2013; 9(4):662–8.
doi:10.5114/aoms.2013.36901PMID:24049526
20. Lin CJ, Pan CF, Chuang CK, Liu HL, Sun FJ, Wang TJ, et al. Gastrointestinal-related uremic toxins in peritoneal dialysis: a pilot study with a 5-year follow-up. Arch Med Res. 2013; 44(7):535–41. doi:10.
1016/j.arcmed.2013.09.007PMID:24055267
21. Lin CJ, Wu CJ, Pan CF, Chen YC, Sun FJ, Chen HH. Serum protein-bound uraemic toxins and clinical outcomes in haemodialysis patients. Nephrol Dial Transplant. 2010; 25(11):3693–700. doi:10.1093/
ndt/gfq251PMID:20466687
22. Meijers BK, Claes K, Bammens B, de Loor H, Viaene L, Verbeke K, et al. p-Cresol and cardiovascular risk in mild-to-moderate kidney disease. Clin J Am Soc Nephrol. 2010; 5(7):1182–9. doi:10.2215/CJN.
07971109PMID:20430946
23. Meijers BK, Van Kerckhoven S, Verbeke K, Dehaen W, Vanrenterghem Y, Hoylaerts MF, et al. The ure-mic retention solute p-cresyl sulfate and markers of endothelial damage. Am J Kidney Dis. 2009; 54 (5):891–901. doi:10.1053/j.ajkd.2009.04.022PMID:19615803
24. Niwa T. Indoxyl sulfate is a nephro-vascular toxin. J Ren Nutr. 2010; 20(5 Suppl):S2–6. doi:10.1053/j.
jrn.2010.05.002PMID:20797565
25. Wu I-W, Hsu K-H, Hsu H-J, Lee C-C, Sun C-Y, Tsai C-J, et al. Serum free p-cresyl sulfate levels predict cardiovascular and all-cause mortality in elderly hemodialysis patients—a prospective cohort study.
Nephrol Dial Transplant. 2012; 27(3):1169–75. doi:10.1093/ndt/gfr453PMID:21891772 26. Powe NR, Klag MJ, Sadler JH, Anderson GF, Bass EB, Briggs WA, et al. Choices for Healthy
Out-comes in Caring for End Stage Renal Disease. Semin Dial. 1996; 9(1):9–11.
27. Liu Y, Coresh J, Eustace JA, Longenecker JC, Jaar B, Fink NE, et al. Association between cholesterol level and mortality in dialysis patients: role of inflammation and malnutrition. JAMA. 2004; 291(4):451–
9. PMID:14747502
28. Sirich TL, Funk BA, Plummer NS, Hostetter TH, Meyer TW. Prominent accumulation in hemodialysis patients of solutes normally cleared by tubular secretion. J Am Soc Nephrol. 2014; 25(3):615–22. doi:
10.1681/ASN.2013060597PMID:24231664
29. Longenecker JC, Klag MJ, Marcovina SM, Liu YM, Jaar BG, Powe NR, et al. High lipoprotein(a) levels and small apolipoprotein(a) size prospectively predict cardiovascular events in dialysis patients. J Am Soc Nephrol. 2005; 16(6):1794–802. PMID:15800123
30. Miskulin DC, Meyer KB, Athienites NV, Martin AA, Terrin N, Marsh JV, et al. Comorbidity and other fac-tors associated with modality selection in incident dialysis patients: the CHOICE Study. Choices for Healthy Outcomes in Caring for End-Stage Renal Disease. Am J Kidney Dis. 2002; 39(2):324–36.
PMID:11840373
31. Nicolaos VA, Dana CM, Gladys F, Suphamai B, Gertrude S, Marcia L, et al. Comorbidity Assessment in Hemodialysis and Peritoneal Dialysis Using the Index of Coexistent Disease. Semin Dial. 2000; 13 (5):320–6. PMID:11014695
32. Melamed ML, Plantinga L, Shafi T, Parekh R, Meyer TW, Hostetter TH, et al. Retained organic solutes, patient characteristics and all-cause and cardiovascular mortality in hemodialysis: results from the re-tained organic solutes and clinical outcomes (ROSCO) investigators. BMC Nephrol. 2013; 14(1):134.
33. Donders AR, van der Heijden GJ, Stijnen T, Moons KG. Review: a gentle introduction to imputation of missing values. J Clin Epidemiol. 2006; 59(10):1087–91. PMID:16980149
35. Gonthier MP, Remesy C, Scalbert A, Cheynier V, Souquet JM, Poutanen K, et al. Microbial metabolism of caffeic acid and its esters chlorogenic and caftaric acids by human faecal microbiota in vitro. Biomed Pharmacother. 2006; 60(9):536–40. PMID:16978827
36. Mulder TP, Rietveld AG, van Amelsvoort JM. Consumption of both black tea and green tea results in an increase in the excretion of hippuric acid into urine. Am J Clin Nutr. 2005; 81(1 Suppl):256s–60s. PMID:
15640488
37. Pereira-Caro G, Borges G, van der Hooft J, Clifford MN, Del Rio D, Lean ME, et al. Orange juice (poly) phenols are highly bioavailable in humans. Am J Clin Nutr. 2014; 100(5):1378–84. doi:10.3945/ajcn.
114.090282PMID:25332336
38. Rechner AR, Kuhnle G, Hu H, Roedig-Penman A, van den Braak MH, Moore KP, et al. The metabolism of dietary polyphenols and the relevance to circulating levels of conjugated metabolites. Free Radic Res. 2002; 36(11):1229–41. PMID:12592675
39. Aronov PA, Luo FJ, Plummer NS, Quan Z, Holmes S, Hostetter TH, et al. Colonic contribution to uremic solutes. J Am Soc Nephrol. 2011; 22(9):1769–76. doi:10.1681/ASN.2010121220PMID:21784895 40. Owen WF, Lew NL, Liu Y, Lowrie EG, Lazarus JM. The Urea Reduction Ratio and Serum Albumin
Con-centration as Predictors of Mortality in Patients Undergoing Hemodialysis. N Engl J Med. 1993; 329 (14):1001–6. PMID:8366899
41. Marquez IO, Tambra S, Luo FY, Li Y, Plummer NS, Hostetter TH, et al. Contribution of residual function to removal of protein-bound solutes in hemodialysis. Clin J Am Soc Nephrol. 2011; 6(2):290–6. doi:10.
2215/CJN.06100710PMID:21030575
42. Depner TA. Uremic toxicity: urea and beyond. Semin Dial. 2001; 14(4):246–51. PMID:11489197 43. Eloot S, Schneditz D, Vanholder R. What can the dialysis physician learn from kinetic modelling beyond
Kt/V(urea)? Nephrol Dial Transplant. 2012; 27(11):4021–9. doi:10.1093/ndt/gfs367PMID:22923544 44. Eloot S, Van Biesen W, Glorieux G, Neirynck N, Dhondt A, Vanholder R. Does the adequacy parameter
Kt/V(urea) reflect uremic toxin concentrations in hemodialysis patients? PLoS One. 2013; 8(11): e76838. doi:10.1371/journal.pone.0076838PMID:24236005
45. Eloot S, Van Biesen W, Vanholder R. A sad but forgotten truth: the story of slow-moving solutes in fast hemodialysis. Semin Dial. 2012; 25(5):505–9. doi:10.1111/j.1525-139X.2012.01107.xPMID:
22925227
46. Eloot S, Vanholder R, Van Biesen W. Dialysis Duration: The longer the better, but why? [corrected]. Nephrol Dial Transplant. 2012; 27(11):3975–8. doi:10.1093/ndt/gfs435PMID:23144067
47. Evenepoel P, Meijers BK, Bammens BR, Verbeke K. Uremic toxins originating from colonic microbial metabolism. Kidney Int Suppl. 2009(114: ):S12–9. doi:10.1038/ki.2009.402PMID:19946322
48. Patel KP, Luo FJ, Plummer NS, Hostetter TH, Meyer TW. The production of p-cresol sulfate and indoxyl sulfate in vegetarians versus omnivores. Clin J Am Soc Nephrol. 2012; 7(6):982–8. doi:10.2215/CJN.
12491211PMID:22490877
49. Sirich TL, Luo FJ, Plummer NS, Hostetter TH, Meyer TW. Selectively increasing the clearance of pro-tein-bound uremic solutes. Nephrol Dial Transplant. 2012; 27(4):1574–9. doi:10.1093/ndt/gfr691
PMID:22231033
50. Vanholder R, Eloot S, Neirynck N, Van Biesen W. Home haemodialysis and uraemic toxin removal: does a happy marriage exist? Nat Rev Nephrol. 2012; 8(10):579–88. doi:10.1038/nrneph.2012.189
PMID:22926247
51. Schepers E, Glorieux G, Vanholder R. The gut: the forgotten organ in uremia? Blood Purif. 2010; 29 (2):130–6. doi:10.1159/000245639PMID:20093818