QUALITY CONTROL OF FULL-FAT SOYBEAN USING UREASE ACTIVITY: CRITICAL ASSESSMENT OF THE METHOD
Dragan V. Palić, Jovanka D. Lević, Slavica A. Sredanović and Olivera M. Đuragić
A critical assessment of the method for determination of urease activity, as an indica-tor of the degree of full-fat soybean (FFSB) processing, has been undertaken. FFSB was processed by dry extrusion at five temperatures, ranging from 1150C to 1650C, and analysed for urease activity by two laboratories and by two analysts at each laboratory, using the pH-difference procedure. The in vivo trial with chickens fed the processed FFSB has also been conducted. While the results of two analysts at each laboratory did not differ significantly (P>0.05), there was a significant difference (P<0.05) in urease activity results between the two laboratories. The overall conclusion of this study is that the urease activity determined by pH-difference method can not be recommended as a reliable indicator for FFSB quality control.
KEYWORDS: Full-fat soybean, dry extrusion, degree of processing, quality control, urease activity
INTRODUCTION
The soybean is by far the most important oilseed crop in the world. Crude protein content of about 38%, with high content of essential amino acids, oil content of minimum 18% and low content of fibre, make soybean a superior feedstuff. As an animal feed, it is used as a protein source (1). If the oil is not extracted from the beans, it is referred to as full-fat soybean (FFSB). Raw FFSB contains anti-nutritional factors (2) which make it unfit for feeding of monogastric and immature ruminant animals. Processing of the raw FFSB by means of heat and mechanical treatment destroys the anti-nutrients. Only an optimum level of heat treatment will produce maximal availability of the amino acids to the animal, thus securing the best animal performance. Insufficient heating, i.e. under-processing of the FFSB limits amino acid availability due to only partial destruction of the anti-nutritional factors (ANFs). On the other hand excessive heating
sing) decreases amino acid availability as a result of the Maillard reaction that occurs between the aldehyde groups of sugar and free amino groups (3).
The main objective of heat processing of FFSB is to achieve an optimum balance between degradation of ANFs and maintenance of amino acid availability. The aim of processed FFSB quality control is to establish if that balance has been achieved.
There are a number of analytical procedures for processed FFSB quality control (4). Official methods are Urease Activity (5), Protein Dispersibility Index (6) and Nitrogen Solubility Index (7). Commonly used unofficial methods are those for determining Tryp-sin Inhibitor Activity (8), Available LyTryp-sine (9) and Protein Solubility in Potassium Hyd-roxide (10). It has been clearly illustrated (11, 12) that there are problems associated with the application of these methods in practice, such as that the use of the same method by different laboratories gives different results of analyses of the same FFSM sample, which makes confusion among the FFSB processors, feed manufacturers and end-users.
The AOCS Official Method Ba. 9-58 (5) for the determination of urease activity is based on measurement of pH change and, due to its simplicity, is probably the most widely used method for the FFSB quality control in laboratories. The aim of this study was to assess this widely used method and make appropriate recommendations.
MATERIAL AND METHODS
Full-fat soybean
Full-fat soybean was processed by dry extrusion at five different temperatures: 115C0, 125C0, 135C0, 145C0, and 165C0.
Urease activity determination
Urease activity was determined according to the AOCS official procedure (5). 200 mg of FFSB sample was incubated in 10.0 ml of phosphate buffered urea solution at 300C for 30 minutes, after which the increase in pH units (∆pH) from pH 7.00 was recorded.
Five processed FFSB samples were analysed by two laboratories (Lab A and Lab B) and by two analysts in each laboratory. Seven replicates of each sample were done by each analyst.
In vivo trial
A total of 5 diets, containing the FFSB processed at different temperatures, and a control diet without FFSB, were used. Ross 788 as hatched chickens were housed in floor pens, with 20 birds per pen and 6 replicates per diet, thus a total of 720 chickens were used. The birds received the diets from the hatching to the 14th day, when they were weighed along with the reminding feed. The total body weight gain (BWG) and feed conversion ratio (FCR) were recorded.
Statistical analysis
RESULTS AND DISCUSSION
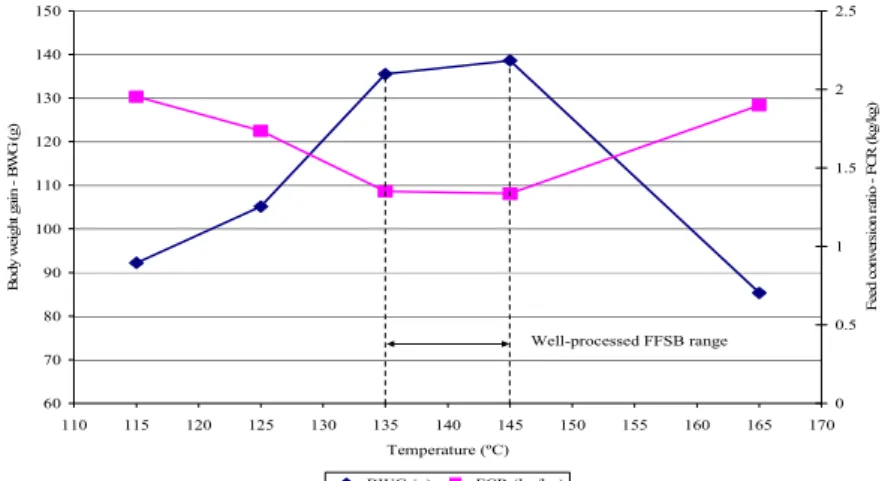
Results of the in vivo trial are shown in Table 1. and Fig. 1.
Table 1. Average body weight gain (BWG) and feed conversion ratio (FCR) of chickens fed FFSB processed at different temperatures in the period from 0 to 14 days of age
Temperature (0C) BWG (g) FCR (kg/kg)
1150C 92.2bc 1.953bc
1250C 105.1b 1.735c
1350C 135.5a 1.350a
1450C 138.6a 1.335a
1650C 85.3c 1.899c
1 SEM 2 CV% 8.92 17.5 0.07 13.2
a,b,c Means in the same column with common superscript do not differ significantly (P>0.01) 1SEM = Standard error of means
2CV% = Coefficient of variation
60 70 80 90 100 110 120 130 140 150
110 115 120 125 130 135 140 145 150 155 160 165 170 Temperature (ºC) B ody w ei ght ga in B W G ( g) 0 0.5 1 1.5 2 2.5 F ee d c onve rs ion r at io F C R ( kg/ k g)
BWG (g) FCR (kg/kg)
Well-processed FFSB range
Figure 1. Average body weight gain (BWG) and feed conversion ration (FCR) of chickens fed FFSB processed at different temperatures in the period
from 0 to 14 days of age
Table 2. Relation between the temperature of extruding and the in vivo assessment of the degree of FFSB processing
Degree of FFSB processing Temperature of extrusion (0C)
Under-processed < 135 Adequately processed 135 – 145
Over-processed > 145
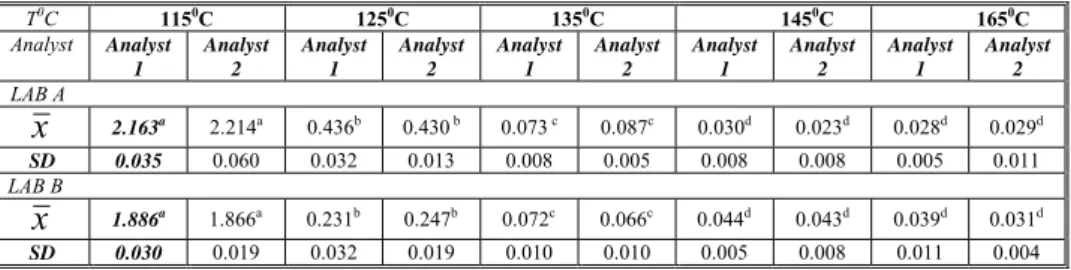
Results of urease activity determined by two analysts at each of the two laboratories (Lab A and Lab B) are shown in Table 3.
Table 3. Urease activity (expressed as ∆pH) in FFSB processed at different temperatures obtained by two analysts in Lab A and Lab B
T0C 1150C 1250C 1350C 1450C 1650C
Analyst Analyst 1
Analyst 2
Analyst 1
Analyst 2
Analyst 1
Analyst 2
Analyst 1
Analyst 2
Analyst 1
Analyst 2
LAB A
x
2.163a 2.214a 0.436b 0.430 b 0.073 c 0.087c 0.030d 0.023d 0.028d 0.029dSD 0.035 0.060 0.032 0.013 0.008 0.005 0.008 0.008 0.005 0.011
LAB B
x
1.886a 1.866a 0.231b 0.247b 0.072c 0.066c 0.044d 0.043d 0.039d 0.031dSD 0.030 0.019 0.032 0.019 0.010 0.010 0.005 0.008 0.011 0.004 a,b,c,d Means in the same raw with common superscript do not differ significantly (P>0.01);
x
= Means of sevenreplicates; SD = Standard deviation
The application of the Student’s t test on urease activity results obtained by the two analysts in Lab A and Lab B, confirmed that the two analysts’ results, at each laboratory and for all five temperatures, did not differ significantly (P>0.05). However, the results of the determination of urease activity were significantly different (P < 0.05) between Lab A and Lab B for the samples processed at 1150C and 1250C (Table 4).
Table 4. Urease activity in FFSB processed at different temperatures obtained by two laboratories
Urease Activity (∆pH) Temperature (0C) 1
Lab 1 1Lab 2
1150C 2.189a 1.876b 1250C 0.433a 0.239b
1350C 0.080c 0.069c 1450C 0.026c 0.044c 1650C 0.028c 0.035c
a,b,c Means without common superscript in the same row differ significantly (P<0.01) 1 Mean of values obtained by two analysts in a laboratory
The relation between the urease activity determined by the two laboratories and the body weight gain of chickens in in vivo trial is shown in Fig. 3.
0.0 0.5 1.0 1.5 2.0 2.5
110 115 120 125 130 135 140 145 150 155 160 165 170
Temperature (ºC)
U
rease act
iv
it
y (pH
-di
ff
erence)
0 20 40 60 80 100 120 140 160
B
o
dy w
ei
ght
gai
n
B
W
G
(
g
)
Lab 1 Lab 2 BWG (g)
Well-processed FFSB range
Figure 3. Relation between the urease activity (expressed as ∆pH)determined by two laboratories and the body weight gain (BWG) of chickens in in vivo trial
Globally accepted values for urease activity in describing the degree of FFSB pro-cesssing (14) are shown in Table 6.
Table 6. Globally accepted relation between the degree of FFSB processing and urease activity
Degree of FFSB processing Urease Activity (∆pH)
Under-processed > 0.20
Adequately processed 0.05 - 0.20
Over-processed < 0.05
It has to be noted that a value of ∆pH=0 does not necessarily indicate that the FFSB was over-processed, as it has been shown in trials with chickens (15).
Based on the results of this study, the following conclusions can be derived:
2. Whereas there was no significant difference (P>0.05) between results obtained by 2 analysts in each laboratory for all five samples, there was a significant difference (P<0.05) in results of urease activity obtained by the two laboratories for the samples processed at 1150C and 1250C, which is the ground for questioning the reliability of this method.
3. The urease activity values fell below ∆pH=0.2, thus indicating adequately-processed FFSB (Table 6) much before the temperature reached 1350C, an actual “entry point” to well-processed FFSB temperature range (Fig. 3).
4. In addition, it has to be noted that when the increase in pH is used as an indicator of the degree of FFSB processing, data may be influenced by whether or not the FFSB had been treated with organic acids, preservatives or sterilizing agents prior to the processing.
CONCLUSION
The overall results of this study show that, if determined by the pH-difference pro-cedure, the value of urease activity in monitoring the FSSB processing is highly questio-nable and it therefore can not be recommended as a reliable indicator for the FFSB quality control.
REFERENCES
1. Wiseman, J.: Recent Advances in Animal Nutrition. Butterworths, London (1986), p. 2.
2. Maclachlan, R.G.: Soybeans: Antinutrients. Symposium: Processing of full fat soya. Irene, South Africa, 12 March 1998, Proceedings p. 10.
3. Palic, D. Laboratory methods for determining the degree of soya processing: South African reality. AFMA Simposium: Use of soya in animal feeds, Pretoria, South Africa, 13 August 2004, Proceedings p. 77
4. Monary, S.: Fullfat Soya Handbook, American Soybean Association, Brussels (1989), p. 6.
5. AOCS Official Methods (1997). Sampling and Analysis of Oilseed By-products, method Ba 9-58.
6. AOCS Official Methods (1999). Sampling and Analysis of Oilseed By-products, method Ba 10-65.
7. AOCS Official Methods, (1997). Sampling and Analysis of Oilseed By-products, method Ba 11-65.
8. Kakade, M.L., J.J. Rackis, J.E. Mc Gee and G. Puski: Determination of trypsin inhibitor activity of soy products: A collaborative analysis of an improved procedure. Cereal Chem. 51 (1974) 376.
10. Araba, M., N.M. Dale: Evaluation of protein solubility as an indicator of under-pro-cessing of soybean meal. Poultry Sci. 69 (1990) 1749.
11. Davies, H.: Manufacturing of full-fat soybeans. Symposium: Processing of full fat soya. Irene, South Africa, 12 March 1998, Proceedings p. 21.
12. Palic, D., A.A. Grove: Validation of Methods for Determining the Degree of Soya Processing: Preliminary study. 2nd Joint Congress of Grassland Society of Southern Africa and South African Society of Animal Science, Gaudini Spa, South Africa, 28 June – 1 July 2004, Book of Abstracts, p. 181.
13. SAS/STAT User's Guide, Version 8, SAS Institute Inc., Cary (1999), NC:SAS Institute. 14. Palic, D.: Quality control of processed full-fat soybeans: Choice of method. XI
In-ternational Feed Technology Symposium, Vrnjačka Banja, 30 March – 3 June 2005, Proceedings p. 96.
15. Araba, M., N.N. Dale: Evaluation of protein solubility as an indicator of over pro-cessing of soybean meal. Poultry Sci. 69 (1990) 76.
Ђ :
. , . , . . Ђ
ђ
,
-ђ . ђ
1150C 1650C. ђ
, a,
ђ pH .
, , ђ
(P>0.05),
ђ 1150C 1250C ђ (P<0.05).
, , ђ
pH ,
ђ .