www.food.actapol.net pISSN 1644-0730 eISSN 1889-9594 DOI: 10.17306/J.AFS.2016.3.33 Received: 28.05.2016 Accepted: 15.07.2016
O R I G I N A L P A P E R
Diff erentiated biological and behavioral mechanisms are involved in appetite regulation (Teixeira et al., 2010). In-depth investigations regarding energy intake
and meal patterns during the day are still needed, es-pecially in the context of the obesity epidemic (Colles et al., 2007). The timing of energy intake is one of the
AN ANALYSIS OF THE MEAL PATTERN AT THE NUTRIENT LEVEL
IN POLISH WOMEN
Marta Stelmach-Mardas
1,2, Marcin Mardas
3, Wojciech Warchoł
4, Paweł Bogdański
51Department of Epidemiology, German Institute of Human Nutrition Potsdam-Rehbrücke
Arthur-Scheunert-Allee 114-116, 14558 Nuthetal, Germany
2Department of Paediatric Gastroenterology and Metabolic Diseases, Poznan University of Medical Sciences
Szpitalna 27/33, 60-572 Poznań, Poland
3Department of Human Nutrition and Hygiene, Poznań University of Life Sciences
Wojska Polskiego 28, 60-637 Poznań, Poland
4Department of Biophysics, Poznan University of Medical Sciences
Fredry 10, 61-701 Poznań, Poland
5Department of Education and Obesity Treatment and Metabolic Disorders, Poznan University of Medical Sciences
Szamarzewskiego 82, 60-569 Poznań, Poland
ABSTRACT
Background. Before the 1990’s, access to a variety of foods in Eastern Europe was limited, which could have infl uenced the currently analyzed dietary behaviors pertaining to overweight and obesity development. The aim of this study was to describe the daily profi le of meal patterns in Polish women aged 50–70 at the nutrient level.
Material and methods. The anthropometrical parameters of four-hundred and fi fty Polish women aged 50–70 were assessed. Three 24-hour dietary recalls and validated questionnaires regarding socio-demo-graphic-economic status and meal frequency were applied. Timing in food intake was considered as follow: 6:00–8:59 CET – breakfast, 9:00–11:59 CET – morning snacks, 12:00–14:59 CET – lunch, 15:00–17:59 CET – afternoon snacks, 18:00–21:00 CET – dinner. Statistical analyses were conducted using Tukey’s multiple comparison tests and discriminant analysis.
Results. No statistically signifi cant diff erences were found in socio-demographic-economic and anthropo-metrical characteristics between women categorized to diff erentiated meal frequency intakes. However, the subjects from the 5-meal-per-day group were characterized by higher anthropometrical parameters, the sta-tistically lowest percentage of regularity in meal consumption and skipping meals related to shortest breaks between meals. At the nutrient level, potassium, niacin, vitamin E and vitamin D were selected in the discri-minant analysis as the nutrients most strongly related to diff erent dietary behaviors.
Conclusi on. Our fi ndings did not provide suffi cient evidence that diverse nutrient intake could lead to the development of a specifi c nutritional profi le in Polish women.
Key words: meal patterns, obesity, food intake
most important factors of energy regulation and the risk of obesity (http://www.who). Therefore, the im-portance of meal frequency intake, considered in the timeframe over the day has to be emphasised. It has previously been shown that skipping breakfast may be related to the intake of less energy early in the day, leading to weight gain resulting from overcompensa-tion (Keim et al., 1997). Furthermore, consumpovercompensa-tion of more than 3 meals per day can contribute to being overweight or obese, with the exception of single eat-ing occasion (Howarth et al., 2006). Thus, higher total calorie intake might be the consequence of consuming more often meals and snacks.
The self-assessment of food intake, including the timing of meals, may be reported with insuffi cient detail. Occasionally, the classifi cation of products be-ing recognized as a snack (ie. fruits, cake) is also not clearly described, due to the bias in the energy density assessment (Poppitt and Prentice, 1996). The single behaviors in populations analyzed may be considered at diff erent levels and may underreport the energy in-take between subjects characterized by Body Mass Index (BMI) as normal weight, overweight or obese (Miller and Perez, 2014; Stelmach-Mardas et al., 2014a). Dietary behaviors are highly variable across Europe. However, many of the determinants of diet that could explain their backgrounds seem to be very similar. Nevertheless, it is worth analyzing the meal patterns of Polish adults, in which the process of matu-ration was connected with limited food accessibility as a consequence of the political transformation in East-ern Europe, and therefore be able to show currently diverse meal patterns and potentially form the basis of overweight development in this age-specifi c group. Therefore, the aim of the study was to describe the daily profi le of meal patterns in Polish women aged 50–70 at the nutrient level.
MATERIAL AND METHODS
The recruitment of women for the study took place in public health institutions in the Greater Poland region. Women that responded positively to the invitation were screened according to inclusion and exclusion criteria. The following women were eligible for the study: Cau-casian, aged 50–70, weight stable in the past 6 months, shift-work, willingness to maintain habitual diet for the
duration of the experiment. Exclusion criteria were: his-tory of bariatric surgery, anorexia nervosa and bulimia, history of depression, diagnosed type 1 or type 2 dia-betes, hepatic or renal disorder, myocardial infarction or cardiovascular diseases, alcohol abuse and participa-tion in weight-management study or use of medicaparticipa-tions known to alter food intake or body weight.
The anthropometrical parameters including body weight and height (RADWAG digital scale with an approximation of 0.1 kg and 0.5 cm respectively) (Radom, Poland), waist and hip circumference were assessed. Participants were measured without shoes while wearing minimal clothing. Body Mass Index and Waist to Hip Ratio (WHR) were calculated. Four-skinfolds were measured to calculate the percentage of body fat mass (% FM) according to Durnin and Womer-sley formula (Durnin and WomerWomer-sley, 1974). Females completed three 24-h dietary recalls and a previously validated questionnaire that included questions re-garding socio-demographic-economic status and meal patterns (Stelmach-Mardas et al., 2014b). Energy, macro- and micronutrient intake was determined using the Dietetyk software (National Institute of Food and Nutrition, Warsaw, Poland). Snacks were described as a food of high energy density (>2 kcal/g). All data that were recognized as over- and underreported (<1000 kcal and >3000 kcal) were excluded from the analysis. The timing of food intake was considered as follow: 6:00–8:59 CET – breakfast, 9:00–11:59 CET – morn-ing snacks, 11:00–14:59 CET – lunch, 15:00–17:59 CET – evening snacks, 18:00–21:00 CET – dinner. The meal patterns were reported as meal type and the time for each intake episode through a day.
All subjects gave their written consent for partici-pation. The study was performed in accordance with the Helsinki Declaration. The protocol was approved by the Bioethical Committee at Poznan University of Medical Sciences in Poland.
Statistical approach
per day. We have built a model that used fourteen vari-ables that have been selected by Wilk’s Lambda meth-od through the use of a discriminant analysis. Wilk’s Lambda assumed values in the range of 0 (perfect dis-crimination) to 1 (no disdis-crimination) in the model. The signifi cance of the variables analyzed through the dis-crimination process was assessed by the F-value. Par-tial Lambda was used to show the unique contribution of the variable being analyzed to the discriminatory power of the model. F to remove showed the F-value related to the respective Partial Lambda. The tolerance
value of a variable was analyzed as 1-Tolerance (R2)
of the variable with all other variables in the model. The analysis was performed using the STATISTICA Software (StatSoft Inc., Tulsa, US).
RESULTS
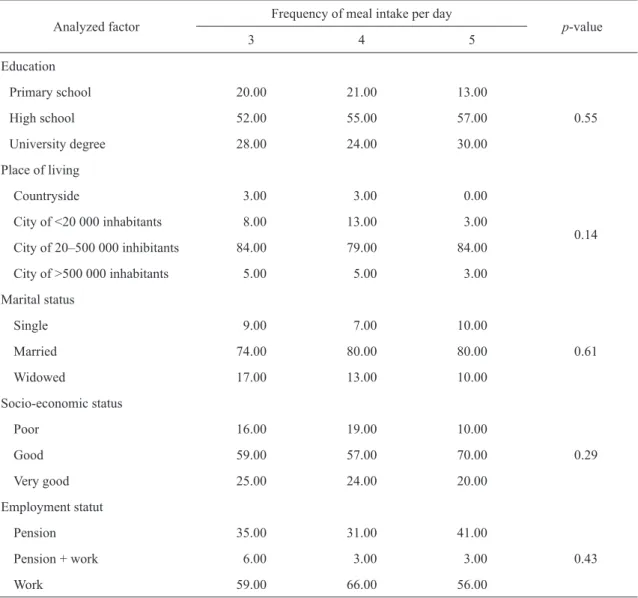
Taking into account the meal frequency intake dur-ing the day, there were no statistically signifi cant dif-ferences in socio-demographic-economic character-istics of the women studied (Table 1). The majority
Table 1. Characteristics of the women studied (n = 450), %
Analyzed factor Frequency of meal intake per day p-value
3 4 5
Education
Primary school 20.00 21.00 13.00
0.55
High school 52.00 55.00 57.00
University degree 28.00 24.00 30.00
Place of living
Countryside 3.00 3.00 0.00
0.14
City of <20 000 inhabitants 8.00 13.00 3.00
City of 20–500 000 inhibitants 84.00 79.00 84.00
City of >500 000 inhabitants 5.00 5.00 3.00
Marital status
Single 9.00 7.00 10.00
0.61
Married 74.00 80.00 80.00
Widowed 17.00 13.00 10.00
Socio-economic status
Poor 16.00 19.00 10.00
0.29
Good 59.00 57.00 70.00
Very good 25.00 24.00 20.00
Employment statut
Pension 35.00 31.00 41.00
0.43
Pension + work 6.00 3.00 3.00
Work 59.00 66.00 56.00
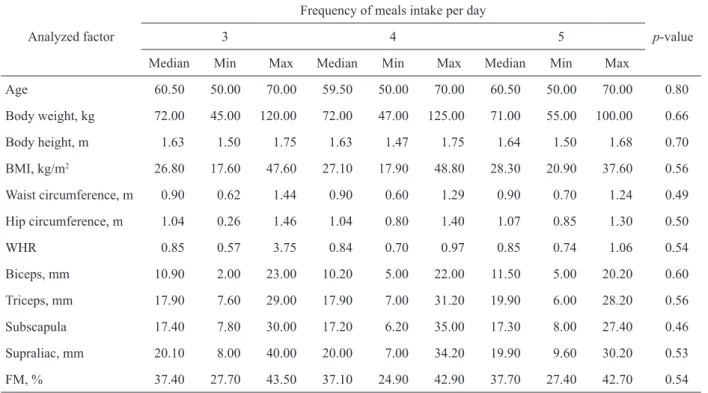
of the women lived in cities of 20,000–50,000 in-habitants, were married and work either full-time or were already retired. No statistically signifi cant as-sociation was found between the anthropometrical parameters and the frequency of meal consumption
(Table 2 and Table 3). Nevertheless, subjects from the 5-meal group had a higher median value of WHR, % FM and BMI. The greatest percent of subjects with
a BMI > 30 kg/m2 were also present in the 5-meal
group (Table 3). Women from the 5-meal group had
Table 2. Anthropometrical characteristic of the women studied (n = 450)
Analyzed factor
Frequency of meals intake per day
p-value
3 4 5
Median Min Max Median Min Max Median Min Max
Age 60.50 50.00 70.00 59.50 50.00 70.00 60.50 50.00 70.00 0.80
Body weight, kg 72.00 45.00 120.00 72.00 47.00 125.00 71.00 55.00 100.00 0.66
Body height, m 1.63 1.50 1.75 1.63 1.47 1.75 1.64 1.50 1.68 0.70
BMI, kg/m2 26.80 17.60 47.60 27.10 17.90 48.80 28.30 20.90 37.60 0.56
Waist circumference, m 0.90 0.62 1.44 0.90 0.60 1.29 0.90 0.70 1.24 0.49
Hip circumference, m 1.04 0.26 1.46 1.04 0.80 1.40 1.07 0.85 1.30 0.50
WHR 0.85 0.57 3.75 0.84 0.70 0.97 0.85 0.74 1.06 0.54
Biceps, mm 10.90 2.00 23.00 10.20 5.00 22.00 11.50 5.00 20.20 0.60
Triceps, mm 17.90 7.60 29.00 17.90 7.00 31.20 19.90 6.00 28.20 0.56
Subscapula 17.40 7.80 30.00 17.20 6.20 35.00 17.30 8.00 27.40 0.46
Supraliac, mm 20.10 8.00 40.00 20.00 7.00 34.20 19.90 9.60 30.20 0.53
FM, % 37.40 27.70 43.50 37.10 24.90 42.90 37.70 27.40 42.70 0.54
Group median, minimum (Min), maximum (Max) for all variables used in this study. BMI – body mass index, WHR – waist to hip ratio, FM – fat mass.
p < 0.05 for all values is considered as statistically signifi cant.
Table 3. Body Mass Index in relation to frequency of meal intake (n = 450), %
Analyzed factor Frequency of meal intake per day p-value
3 4 5
BMI, kg/m2 0.38
<18.5 1.00 1.00 0.00
18.5–25 34.00 38.00 37.00
25–30 37.00 34.00 26.00
>30 28.00 27.00 37.00
the lowest percentage of regularity, while the highest regularity was observed in the 3-meal group. Statisti-cally signifi cant diff erences between analyzed groups were related to the lowest skipping of 2nd breakfast, snacks, dinner and warm meals in the 5-meal group (Table 4). This is consistent with the signifi cantly shortest breaks between meals within this group. En-ergy intake was estimated at lower levels than recom-mended (1750 kcal) and the percentage of fat intake exceeded 30%, although diff erences were not signifi -cant (Table 5).
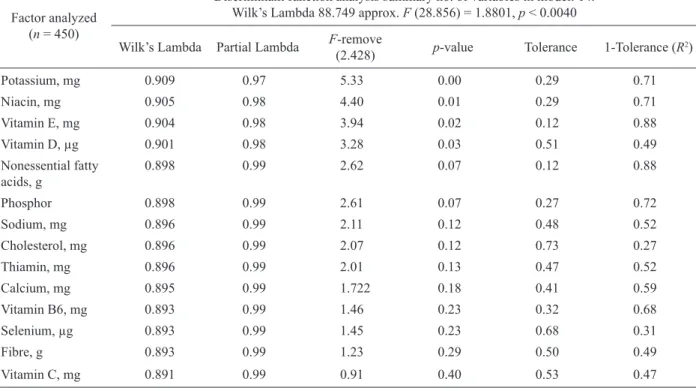
Discriminant analyses selected the following 14 nutrients as the most strongly related to diff erent di-etary behaviors: potassium, niacin, vitamin E, vitamin D, nonessential fatty acids, phosphor, cholesterol, so-dium, thiamin, calcium, vitamin B6, vitamin C, sele-nium, and dietary fi ber. Within this group, potassium, niacin, vitamin E and vitamin D were characterized as having the greatest discriminating power according to the frequency of meals consumed during the day (Table 6) and were found to be statistically signifi cant (p < 0.05) with nonessential fatty acids and phosphor
showing a trend towards signifi cance (p = 0.07 and p = 0.07, respectively). The classifi cation matrix is shown in Table 7.
DISCUSSION
Here we describe the daily meal pattern of Polish women at nutrient level. Our results failed to show statistically signifi cant diff erences in the anthropo-metrical parameters and socio-demographic-econom-ic characteristsocio-demographic-econom-ics in comparison to the diff erentiated frequency of meal consumption. However, the women from the 5-meal group were characterized by a higher median value of anthropometrical parameters, the sta-tistically lowest percentage of regularity in their meal consumption and also by skipping meals related to the shortest breaks between meals. At the nutrient levels observed, potassium, niacin, vitamin E and vitamin D were selected in discriminant analysis as the nutrients most strongly related to diff erent dietary behaviors.
It should be taken under consideration that food is the source of energy for adipose tissue, and as such, Table 4. Self-estimated frequency of meal intake (n = 450)
Analyzed factors Frequency of meal intake per day p-value
3 4 5
Regular consumption, % 83.00 72.00 63.00 0.01
I breakfast 99.00 99.00 100.00 0.60
II breakfast 7.00 82.00 100.00 0.00
Lunch 99.00 99.00 100.00 0.60
Snacks 5.00 24.00 100.00 0.00
Dinner 93.00 95.00 100.00 0.03
Warm meal 90.00 94.00 100.00 0.01
Beverages, %
No 25.00 36.00 37.00 0.20
1 time 30.00 33.00 30.00
2–3 times 42.00 31.00 30.00
More than 3 times 3.00 0.00 3.00
Breaks between meals, h 4.10 3.90 2.90 0.00
Table 5. Energy and percentage of energy derivative from selected nutrients in relation to frequency of meals intake
Factor analyzed
Frequency of meal intake per day
p-value
3 4 5
Median Min Max Median Min Max Median Min Max
Energy, kcal 1 569.00 1 011.00 2 962.00 1 530.00 1 001.00 2 939.00 1 623.00 1 039.00 2 774.00 0.56
from protein, % 14.08 7.06 30.51 14.12 6.93 27.29 13.23 8.38 21.38 0.77
from fat, % 35.38 10.06 55.81 34.45 9.52 53.83 31.33 15.39 48.35 0.65
from
carbohy-drates, % 51.19 22.06 80.56 52.83 28.07 81.91 54.70 37.93 69.87 0.58
from SFA, % 13.80 2.48 25.92 14.16 3.60 28.44 12.54 4.81 21.70 0.70
from MFA, % 12.55 3.05 26.20 12.24 2.74 25.39 11.27 4.85 20.02 0.65
from PFA, % 3.95 0.89 23.12 3.632 1.23 18.21 3.381 1.46 21.08 0.75
Cholesterol, mg 268.20 35.60 1284.00 250.20 33.31 1 412.00 205.70 58.02 1 226.00 0.77
Group median, minimum (Min), maximum (Max) for all variables used in this study.
SFA – saturated fatty acids, MFA – momounsaturated fatty acids, PFA – polyunsaturated fatty acids. p < 0.05 for all values is considered as statistically signifi cant.
Table 6. Discriminant function analysis summary of nutrient intake under diff erent frequency of meal consumption (3 meals, 4 meals, 5 meals per day)
Factor analyzed (n = 450)
Discriminant function analysis summary no. of variables in model: 14. Wilk’s Lambda 88.749 approx. F (28.856) = 1.8801, p < 0.0040
Wilk’s Lambda Partial Lambda F-remove (2.428) p-value Tolerance 1-Tolerance (R2)
Potassium, mg 0.909 0.97 5.33 0.00 0.29 0.71
Niacin, mg 0.905 0.98 4.40 0.01 0.29 0.71
Vitamin E, mg 0.904 0.98 3.94 0.02 0.12 0.88
Vitamin D, μg 0.901 0.98 3.28 0.03 0.51 0.49
Nonessential fatty
acids, g 0.898 0.99 2.62 0.07 0.12 0.88
Phosphor 0.898 0.99 2.61 0.07 0.27 0.72
Sodium, mg 0.896 0.99 2.11 0.12 0.48 0.52
Cholesterol, mg 0.896 0.99 2.07 0.12 0.73 0.27
Thiamin, mg 0.896 0.99 2.01 0.13 0.47 0.52
Calcium, mg 0.895 0.99 1.722 0.18 0.41 0.59
Vitamin B6, mg 0.893 0.99 1.46 0.23 0.32 0.68
Selenium, μg 0.893 0.99 1.45 0.23 0.68 0.31
Fibre, g 0.893 0.99 1.23 0.29 0.50 0.49
Vitamin C, mg 0.891 0.99 0.91 0.40 0.53 0.47
the time of eating, particularly of high energy content meals, may be decisive and changes in this timing could have metabolic consequences for the develop-ment of obesity (Garaulet et al., 2013). Our fi ndings suggest that all consumers have elevated BMI, WHR and % FM, which could describe one of the possi-ble links between weight gain and changes in energy intake (Ma et al., 2003). Forslund et al. (2002) also found that obese women had a higher meal frequency compared with the normal-weight population. Fur-thermore, if we analyze which meals are more often skipped or the time period during the day showing the highest frequency of meal intake, we can produce an additional description of the characteristics of the study population. Previously, it was shown by Garau-let et al. (2013) that late eaters had a signifi cantly low-er plow-ercentage of their total daily enlow-ergy intake during breakfast, and skipped breakfast more frequently than early eaters. Moreover, Wang et al. (2014) concluded that increased intake of the day’s total energy at mid-day is associated with a lower risk of being overweight or obese, whereas consuming more in the evening is associated with a higher risk. However, in our study, the most frequently skipped meals were ‘2nd break-fast’ and snacks, which suggest that the main meals were eaten regularly. It was surprising to note that the women in the study did not indicate “night eating”, which was anticipated, especially in those character-ized by higher values of BMI. It was also surprising that we did not fi nd either fat or carbohydrates to be the main discriminant factors between the groups ana-lyzed. Nevertheless, low energy intake could be relat-ed to the underreporting of self-estimatrelat-ed food intake,
which is very commonly observed in populations suf-fering from being overweight or obesity (Poppitt et al., 1998).
Currently, the wider variety of food available on the market may change the dietary habits across the day; however, the eating habits that were developed in childhood and during the process of maturation can strongly infl uence food selection processes observed in adulthood. Therefore, taking into account limited Polish women’s food intake before the 1990’s, it was suspected that this investigation of meal patterns in specifi c age groups still cannot be diversifi ed (Kow-rygo et al., 1999). At the nutrient level reported, we were able to select vitamin E and vitamin D intake as fat-soluble vitamins discriminating the diff erent food group’s consumers. This observation might suggest indirectly the importance of verifi ed fat content in the diet and products rich in fat (Jarosz and Buhak--Jachymczyk, 2008). This is consistent with the assess-ment of a high percentage of fat intake in the women studied. The increased discriminatory power of niacin could be attributed to the amount of meat consumption (i.e. pork, chicken), rich in niacin, in the Polish popu-lation (Verbeke et al., 2013). Furthermore, the greater discriminatory power of potassium was probably re-lated to the diff erent frequency of potatoes consumed across the groups analyzed (Kowrygo et al., 1999). Although statistical signifi cances between those nutri-ents were observed, the Partial Lambdas did not fall below 0.9. Thus, the visible discrimination power of the factors analyzed cannot be recognized as strong.
The strength of this study was its large sample size and homogenous population. Although self-reported Table 7. Classifi cation matrix after the discriminant analysis of nutrients intake after diff erent
fre-quency of meals consumption per day (3 meals, 4 meals, 5 meals)
Group
Classifi cation matrix rows: observed classifi cations, columns: predicted classifi cations
percent correct p = 0.583 meals 4 mealsp =0.35 p = 0.065 meals
3 meals 91.10 235.00 18.00 5.00
4 meals 32.20 136.00 19.00 1.00
5 meals 33.30 23.00 3.00 4.00
Total 68.10 394.00 40.00 10.00
data was used, all data points recognized as over- and underreported were excluded from the analysis. Un-fortunately, we did not assess the metabolic biomark-ers that could be included in the discriminant analysis and contribute to higher statistical discriminant power. The observational character of the study supports the necessity of more complex interventional studies.
Our fi ndings did not provide suffi cient evidence that diverse nutrient intake could lead to the develop-ment of a specifi c nutritional profi le in Polish women aged 50–70. Nevertheless, the 5-meal consumers can be recognized as a group of special interest in the context of being overweight and developing obesity. Future broadened investigations are needed to better discriminate food groups and nutrients that might be associated with healthy and unhealthy meal patterns in Polish women being applied in the strategy of obesity prevention in this age-specifi c group of women.
REFERENCES
Colles, S. L., Dixon, J. B., O’Brien, P. E. (2007). Night eat-ing syndrome and nocturnal snackeat-ing: association with obesity, binge eating and psychological distress. Int. J. Obes. (Lond.), 31, 1722–1730.
Durnin, J. V. G. A., Womersley, J. (1974). Body fat assessed from total body density and its estimation from skinfold thickness: measurements on 481 men and women aged from 15 to 72 years. Brit. J. Nutr., 32, 77–97.
Forslund, H. B., Lindroos, A. K., Sjöström, L., Lissner, L. (2002). Meal patterns and obesity in Swedish women – a simple instrument describing usual meal types, fre-quency and temporal distribution. Eur. J. Clin. Nutr., 56, 8, 740–747.
Garaulet, M., Gómez-Abellán, P., Alburquerque-Béjar, J. J., Lee, Y. C., Ordovás, J. M., Scheer, F. A. (2013). Timing of food intake predicts weight loss eff ectiveness. Int. J. Obes., 37, 4, 604–611.
Howarth, N., Huang, T. T. K., Roberts, S., Lin, B. McCro-ry, M. (2006). Eating patterns and dietary composition in relation to BMI in younger and older adults. Int. J. Obes., 31, 675–684.
Jarosz, M., Buhak-Jachymczyk, B. (2008). Human nutrition recommendations. Warszawa: PZWL.
Keim, N. L., Van Loan, M. D., Horn, W. F., Barbieri, T. F., Mayclin, P. L. (1997). Weight loss is greater with consumption of large morning meals and fat-free mass is preserved with large evening meals in women on
a controlled weight reduction regimen. J. Nutr., 127, 75–79.
Kowrygo, B., Górska-Warsewicz, H., Berger, S. (1999). Evaluation of eating patterns with diff erent methods: the Polish experience. Appetite, 32, 1, 86–92.
Ma, Y., Bertone, E. R., Stanek, E. J., Reed, G. W., Hebert, J. R., Cohen, N. L., Merriam, P. A., Ockene, I. S. (2003). Association between eating patterns and obesity in a free-living US adult population. Am. J. Epidemiol., 158, 1, 85–92.
Miller, P. E., Perez, V. (2014). Low-calorie sweeteners and body weight and composition: a meta-analysis of rand-omized controlled trials and prospective cohort studies. Am. J. Clin. Nutr., 100, 3, 765–777.
Poppitt, S. D., Prentice, A. M. (1996). Energy density and its role in the control of food intake: Evidence from meta-bolic and community studies. Appetite, 26, 153–174. Poppitt, S. D., Swann, D., Black, A. E. Prentice, A. (1998).
Assessment of selective under-reporting of food intake by both obese and nonobese women in a metabolic fa-cility. Int. J. Obes. Relat. Metab. Disord., 22, 303–311. Stelmach-Mardas, M., Mardas, M., Walkowiak, J., Boeing,
H. (2014a). Long-term weight status in regainers after weight loss by lifestyle intervention: status and chal-lenges. Proc. Nutr. Soc., 73, 4, 509–518.
Stelmach-Mardas, M., Mardas, M., Warchoł, W., Jamka, M., Walkowiak, J. (2014b). Successful maintenance of body weight reduction after individualized dietary counseling in obese subjects. Sci Rep., 14, 4, 6620. DOI: 10.1038/ srep06620
Teixeira, P. J., Silva, M. N., Coutinho, S. R., Palmeira, A. L., Mata, J., Vieira, P. N., Carraça, E. V., Santos, T. C., Sardinha, L. B. (2010). Mediators of weight loss and weight loss maintenance in middle-aged women. Obe-sity (Silver Spring), 18, 725–735.
Verbeke, W., Perez-Cueto, F. J., de Barcellos, M. D., Grunert, K. G. (2013). Pork in good company? Explora-tory analysis of side dishes, beverages, foodscapes and individual characteristics. Meat Sci., 95, 3, 694–698. Wang, J. B., Patterson, R. E., Ang, A., Emond, J. A., Shetty,
N., Arab, L. (2014). Timing of energy intake during the day is associated with the risk of obesity in adults. J. Hum. Nutr. Diet., 27, 2, 255–262.