TEMAS LIVRES FREE THEMES
1 Centro de Estudos, Laboratório de Aptidão Física de São Caetano do Sul. R. Heloísa Pamplona 269, Fundação. 09520-320 São Caetano do Sul SP Brasil. gersonferrari08@ yahoo.com.br
2 Centro de Atendimento e Apoio ao Adolescente, Departamento de Pediatria da Universidade Federal de São Paulo. São Paulo SP Brasil.
3 Pennington Biomedical Research Center. Baton Rouge LA EUA. 4 Syracuse University. New York NY EUA.
Accelerometer-determined peak cadence and weight status
in children from São Caetano do Sul, Brazil
Determinação do pico de cadência via acelerometria e estado
de peso corporal em crianças de São Caetano do Sul, Brasil
Resumo O objetivo do estudo foi determinar a relação entre indicadores de pico de cadência com índice de massa corporal (IMC) e percentual de gordura corporal (% GC) definidos pelo estado de peso corporal de crianças. Participaram 485 crianças brasileiras. Minutos de acelerometria foram ranqueados para identificar os valores de picos de cadência de 1, 30 e 60 minutos. O estado de peso corporal foi apresentado pelo IMC e %GC, avaliados pela bioimpedância elétrica. No IMC, crianças eutróficas apresentaram maior pico de cadência de 1 minuto (115,5 versus 110,6 e 106,6 passos/min), 30 minutos (81,0 versus 77,5 e 74,0 passos/min) e 60 minutos (67,1 versus 63,4 e 60,7 passos/min) do que aqueles com excesso de peso e obesidade (p < 0,001). Na %GC, crianças eutrófi-cas apresentaram maior pico de cadência de 1 mi-nuto (114,5 versus 106,1 passos/min), 30 mimi-nutos (80,4 versus 73,1 passos/min) e 60 minutos (66,5 versus 59,9 passos/min) do que as obesas. Relações semelhantes foram observadas nos meninos; no entanto, apenas o pico de cadência de 1 minuto foi significativamente diferente nas categorias do estado de peso corporal definido pelo IMC e %GC nas meninas. Indicadores de pico de cadência fo-ram negativamente associados com IMC e %GC e maior nos eutróficos do que naqueles com excesso de peso e obesidade.
Palavras-chave Atividade física, Adiposidade, Obesidade, Composição Corporal
Abstract The purpose of this study was to deter-mine the relationship between peak cadence indi-cators and body mass index (BMI) and body fat percentage (BF%)-defined weight status in dren. The sample comprised 485 Brazilian chil-dren. Minute-by-minute step data from accelerom-etry were rank ordered for each day to identify the peak 1-minute, 30-minute and 60-minute cadence values. Data were described by BMI–defined and bioelectrical impedance-determined BF% weight status. BMI-defined normal weight children had higher peak 1-minute (115.5 versus 110.6 and 106.6 steps/min), 30-minute (81.0 versus 77.5 and 74.0 steps/min) and 60-minute cadence (67.1 ver-sus 63.4 and 60.7 steps/min) than overweight and obese children (p<.0001), respectively. Defined us-ing %BF, normal weight children had higher peak 1-minute (114.5 versus 106.1 steps/min), 30-min-ute (80.4 versus 73.1 steps/min) and 60-min30-min-ute cadence (66.5 versus 59.9 steps/min) than obese children (p<.0001). Similar relationships were observed in boys; however, only peak 1- min-ute cadence differed significantly across BMI and %BF-defined weight status categories in girls. Peak cadence indicators were negatively associated with BMI and BF% in these schoolchildren and signifi-cantly higher among normal weight compared to overweight or obese children.
Key words Physical activity, Adiposity, Obesity, Body composition
Gerson Luis de Moraes Ferrari 1,2
Timóteo Araújo 1
Luis Carlos Oliveira 1
Victor Keihan Rodrigues Matsudo 1
Emily Mire 3
Tiago Barreira 3,4
Catrine Tudor-Locke 3
F
er
rar
i GLM
Introduction
Childhood obesity is an important public health problem that has recently increased dramatically in prevalence in both developed and developing countries1. A recent systematic review
conclud-ed that higher levels of regular physical activity assessed objectively by accelerometers likely pro-tects against obesity in children and adolescents2.
The use of accelerometers to measure physical activity generally results in stronger associations with overweight and obesity than the use of questionnaires in children3. For example,
Ferra-ri et al.4 reported a negative association between
objectively measured moderate-to-vigorous physical activity (MVPA) with body composition variables (body mass index (BMI) and body fat percentage (BF%)) in Brazilian children.
Researchers have used step counts to describe children’s and adolescents’ daily ambulatory physical activity levels5,6. However, steps/day has
been criticized because it only provides a total volume of physical activity without information about the intensity. This limitation can be over-come with the use of accelerometers that have the capability of storing minute-by-minute step accumulations, which can be used to quantify stepping cadence (steps/min) as it is naturally ex-pressed in free-living, indicative of a full range of step accumulation patterns and stepping rates7,8.
Originally investigated by Hoshikawa et al.9,
cadence is associated with ambulatory speed10
and is a proxy indicator of intensity of ambula-tory activity11-13. A recent review has introduced
the concept of using cadence as a way to study free-living ambulatory behavior14. Some
stud-ies have used accelerometer step counts to not only describe the total amount of daily ambu-lation but also different aspects of children’s cadence15-17. In addition to analyzing cadence to
describe movement it is also possible to measure and analyze patterns of peak cadence for differ-ent time incremdiffer-ents. Peak cadence indicators for children include peak 1-minute (defined as the steps/min recorded for highest single minute in a day), peak 30-minute (average value for top 30 ranked minutes) and peak 60-minute (average value for top 60 ranked minutes) cadence values and can be considered indices of “best natural daily effort”18,19.
The relationship between peak cadence and health related variables has been examined in children from developed countries16-18. Using
data from the 2005-2006 U.S. National Health and Nutrition Examination Survey (NHANES),
Barreira et al.18 reported negative associations
between cardiovascular disease (CVD) risk fac-tors (in particular, HDL-C, blood pressure, and BMI) and each of the peak cadence indicators in children. Peak 60-minute cadence was lower across groups of children with higher numbers of CVD risk factors (76 steps/min in those without any risk factors versus 67 steps/min in those with
≥ 2 risk factors)18. In addition, Gardner et al.16
reported that children, adolescents, and young adults with metabolic syndrome walked at lower daily average cadence than those without met-abolic syndrome (27 versus30 steps/min), and they had lower cadences for continuous dura-tions of 60 min (31 versus 38 steps/min), 30 min (42 versus 50 steps/min), and 1 min (102 versus 110 steps/min). Although popular in use, there are relatively few studies that have used acceler-ometry to study children in developing coun-tries like Brazil4,20,21. The relationship between
peak cadence indicators and obesityhas not been studied in Brazilian children. Therefore, the pur-pose of this study was to determine the relation-ship between peak cadence indicators and weight status (defined by BMI and by BF%) in children from São Caetano do Sul, Brazil.
Methods
Data collection was conducted as part of the In-ternational Study of Childhood Obesity, Lifestyle and the Environment (ISCOLE). The primary aim of ISCOLE was to investigate the influence of behavioral settings and the physical, social, and policy environments on observed relationships between lifestyle characteristics and weight status in approximately 500 children from each of the included 12 countries (Australia, Brazil, Canada, China, Colombia, Finland, India, Kenya, Portu-gal, South Africa, United Kingdom, and United States) representing all major world regions. De-tails of the ISCOLE protocol are provided else-where22.
The analysis herein focuses only on the data collected in the city of SãoCaetano do Sul, locat-ed in the state of São Paulo, Brazil, with a land area of 15.3 km2 and a subtropical climate. The
population of the municipality in 2013 consisted of 149,263 inhabitants, including 1,557 children (812 boys and 745 girls) 10 years of age23. The
city is characterized as a service economy23 and
aúd
e C
ole
tiv
a,
22(11):3689-3698,
2017
A random cluster sample of 564 5th grade
Brazilian children (277 boys and 287 girls), aged 9-11 years old, was assessed. After accounting for exclusionary criteria (non-valid accelerometer data as defined below, missing BMI or BF%, the final sample comprised 485 children (238 boys and 247 girls)).
Data were collected during the school year from March 2012 to April 2013. All assessments were done during a full week per school. All data collection and management activities were per-formed and monitored under rigorous quality control procedures, implemented by the ISCOLE Coordinating Center, as described in detail pre-viously22. Prior to participating, children and at
least one of their parents/legal guardians were asked to sign the Instrument of Consent accord-ing to Resolution 196/96 of Brazil’s National Health Council. Ethical approval was obtained from the Pennington Biomedical Research Cen-ter Institutional Review Board and Federal Uni-versity of São Paulo, Brazil.
Random lists of public and private elemen-tary schools in the region were generated, and schools were selected from each list at a ratio of 4 (public) to 1 (private). This 80% public to 20% private schools ratio was purposely implemented to maximize socioeconomic status distribution. If a school refused to participate in the study, it was replaced by the next school on the list, main-taining the same public to private school ratio. A random sample of 25-30 children was selected to participate per school with a stipulation that each sex comprised 50% of the selected sample.
The ActiGraph GT3X+ accelerometer (Acti-Graph LLC, Pensacola, United States) was used to assess step-defined physical activity. The accel-erometer was worn at the waist on an elasticized belt, on the right mid-axillary line. The partici-pants were encouraged to wear the accelerometer 24 hours/day for at least 7 days (plus an initial familiarization day and the morning of the final day), including 2 weekend days. To be included in this analysis, children had to have valid accel-erometer data (defined as ≥4 days, including at least one weekend day, with ≥10 hours of wake wear time per day)25,26. Overall, 84.7% of the
el-igible sample met these criteria. The number of valid days ranged from 4-7, averaging 6.7 days per participant.
Following the final day of data collection, staff went into the school and retrieved the ac-celerometers. The research team verified the data for completeness using the most recent version of the ActiLife software (version 5.6 or higher;
ActiGraph, Pensacola, United States) available at the time. Nine participants who did not provide adequate data during initial monitoring wore the accelerometer for a second week to ensure that the minimal data requirements were met. The step data were processed with the default filter so as not to over-estimate step counts using the low frequency extension27,28.
Due to the 24-hour wear protocol, the noc-turnal total sleep episode time was identified and excluded from any analysis of steps/day and physical activity using a published algorithm29.
Daily minutes of wake wear time were then ranked in descending order of steps/min17. The
value for the highest ranked 1 minute of steps/ min represented the peak 1-minute cadence. Peak 30-minute (highest 30 minutes) and peak 60-minute (highest 60 minutes) cadence repre-sented an average steps/min accumulated during the highest, but not necessarily consecutive, min/ day. Each of these peak cadence indicators was averaged across all valid days6,30.
Height, weight and BF% measures were ob-tained according to standardized ISCOLE pro-cedures22. Height was measured using a Seca 213
portable stadiometer (Hamburg, Germany)31.
Weight and BF% were measured using a porta-ble Tanita SC-240 body composition analyzer (TANITA Corporation, Japan)32. Each child was
measured twice and, when necessary, a third measurement was taken if the difference between the previous two was outside the permissible range for each measure and its replica (0.5 cm for height, 0.5 kg for weight, and 2% for BF%). The two closest measurements were averaged, and the mean value of each measured variable was used for analysis.
BMI was calculated using the standard for-mula [weight(kg)/height(m)2] and thereafter,
BMI z-scores (calculated based on sex- and age-specific growth reference data from the World Health Organization (WHO) for children and youth) were further categorized as normal: ≤ 1 SD; overweight: >+1 SD to 2; and obese: >+2 SD33.
We also categorized BF% according to sex- and age-specific cut-points. Specifically, children were categorized as normal weight (< 85th
per-centile of sex-specific reference data from chil-dren in the United Kingdom)34, overweight (≥
85th to <95th percentiles) and obese (≥ 95th
per-centile).
F
er
rar
i GLM
regression models were used to examine the as-sociations between peak cadence indicators and BMI and BF%. Peak cadence indicators across different levels of weight status defined by BMI and BF% (normal weight, overweight and obese) were analyzed in a model that includ-ed sex and the sex-by-weight status interaction. Least-squared means were compared across lev-els of BMI and BF% for the entire sample as well as separately by sex. Multi-level linear regression models were also used to examine the associa-tions between peak cadence indicators and con-tinuous measures of BMI and BF%; models were adjusted for sex and accounted for school (to al-low for clustering at the school level). Statistical Analysis System (SAS, version 9.3) was used for data analyses and p < 0.05 was adopted as the sig-nificance level35.
Results
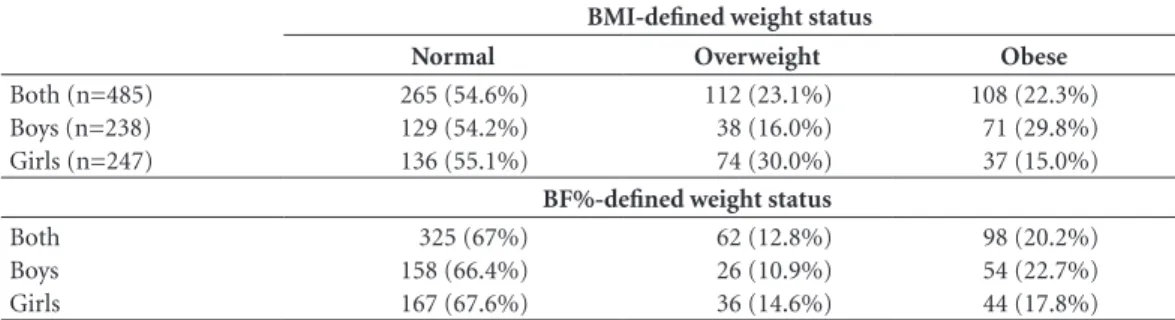
The frequency of excess BMI and BF% status is presented in Table 1. Based on BMI, most chil-dren were classified as normal weight (54.6%) followed by overweight (23.1%) and obese (22.3%). When analyzed separately by sex, 45.8% of boys and 45% of girls were overweight or obese according to their BMI-defined weight status. Most children (67%) were classified as normal weight by BF%, followed by overweight (12.8%) and obese (20.2%). By sex, 33.6% of boys and 32.4% of girls were classified as over-weight or obese by BF%.
Compared to girls, boys consistently achieved significantly higher values for each of the peak cadence indicators (Figure 1).
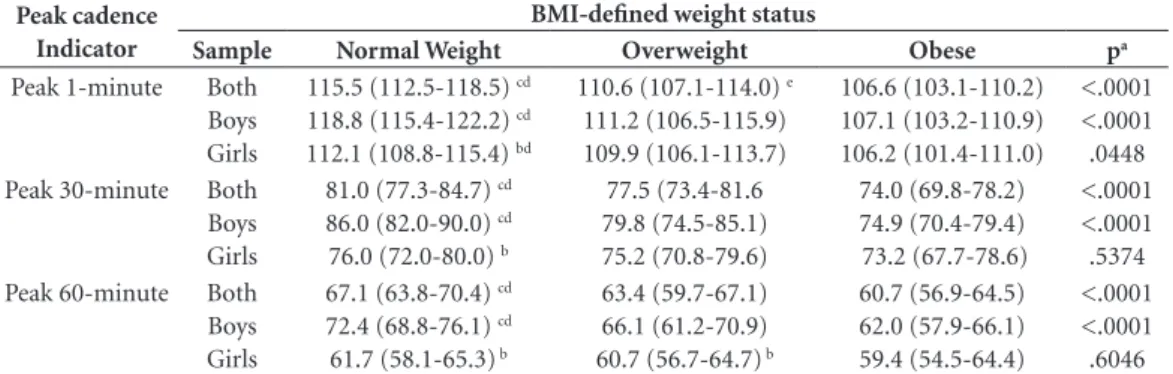
Table 2 presents peak cadence indicators across categories of BMI. For the total sample, there were significant differences in each of the
peak cadence indicators between BMI-defined weight status categories. Normal weight children achieved significantly higher mean values for each of the peak cadence indicators compared with overweight and obese children (Table 2).
The same relationships were observed when the analysis was focused only on boys: there were significant differences in all peak cadence indica-tors across BMI-defined weight status categories and normal weight boys had higher mean values obese boys. In contrast, only the peak 1- minute cadence differed significantly across BMI-de-fined weight status categories in girls.
In the normal weight category, boys achieved significantly higher mean values than girls in all peak cadence indicators, and overweight boys had significantly higher mean values than over-weight girls in the peak 60-minute cadence indi-cator category (Table 2). There were no signifi-cant sex differences in the obese category.
Table 3 presents the peak cadence indicators across categories of BF%-defined weight status. All peak cadence indicators had mean values that differed significantly across BF% weight sta-tus categories. Normal weight children achieved significantly higher mean values than obese chil-dren in all peak cadence indicators and over-weight children had significantly higher values than obese children for the peak-1 minute indi-cator (Table 3).
In boys, there were significant differences among the BF% weight status categories for all peak cadence indicators; normal weight boys had significantly higher mean values than obese boys in all peak cadence indicator categories and significantly more than overweight boys in the peak-60 minute cadence indicator category. Normal weight girls achieved significantly higher mean values than obese girls for the peak 1-min-ute indicator only (Table 3).
Table 1. Frequency (%) of BMI and BF%-defined weight status by sex in Brazilian children.
BMI-defined weight status
Normal Overweight Obese
Both (n=485) Boys (n=238) Girls (n=247)
265 (54.6%) 129 (54.2%) 136 (55.1%)
112 (23.1%) 38 (16.0%) 74 (30.0%)
108 (22.3%) 71 (29.8%) 37 (15.0%)
BF%-defined weight status
Both Boys Girls
325 (67%) 158 (66.4%) 167 (67.6%)
62 (12.8%) 26 (10.9%) 36 (14.6%)
aúd
e C
ole
tiv
a,
22(11):3689-3698,
2017
In the normal weight category, boys accumu-lated significantly higher mean values than girls in all peak cadence indicators; no sex differences were observed in the obese or overweight catego-ries (Table 3).
Table 4 presents the results of the multi-lev-el regression analyses describing the association between each of the peak cadence indicators and BMI and BF% separately. There were negative significant associations between BMI and all peak cadence indicators as well as between BF%
and all peak cadence indicators when adjusted for sex and school, indicating that this associa-tion is independent of sex and school.
Discussion
The aim of this study was to determine the re-lationship between peak cadence indicators and weight status in children from São Caetano do Sul, Brazil, averaging 10 years of age. We
demon-Figure 1. Peak cadence indicators by sex in Brazilian children.
*Significant difference between boys and girls. 0
20 40 60 80 100 120 140
Peak 1-minute Peak 30-minute Peak 60-minute
Peak cadence indicators
S
te
ps/min
113.1 115.1 111.2
*
79.4 82.9
*
76.1
65.5 69.3 61.8
*
Both Boys Girls
Table 2. Descriptive (mean and 95% CI) analysis of peak cadence indicators according to BMI-defined weight
status and sex in Brazilian children.
Peak cadence Indicator
BMI-defined weight status
Sample Normal Weight Overweight Obese pa
Peak 1-minute Both Boys Girls
115.5 (112.5-118.5) cd
118.8 (115.4-122.2) cd
112.1 (108.8-115.4) bd
110.6 (107.1-114.0) e
111.2 (106.5-115.9) 109.9 (106.1-113.7)
106.6 (103.1-110.2) 107.1 (103.2-110.9) 106.2 (101.4-111.0)
<.0001 <.0001 .0448 Peak 30-minute Both
Boys Girls
81.0 (77.3-84.7) cd
86.0 (82.0-90.0) cd
76.0 (72.0-80.0) b
77.5 (73.4-81.6 79.8 (74.5-85.1) 75.2 (70.8-79.6)
74.0 (69.8-78.2) 74.9 (70.4-79.4) 73.2 (67.7-78.6)
<.0001 <.0001 .5374 Peak 60-minute Both
Boys Girls
67.1 (63.8-70.4) cd
72.4 (68.8-76.1) cd
61.7 (58.1-65.3) b
63.4 (59.7-67.1) 66.1 (61.2-70.9) 60.7 (56.7-64.7) b
60.7 (56.9-64.5) 62.0 (57.9-66.1) 59.4 (54.5-64.4)
<.0001 <.0001 .6046
F
er
rar
i GLM
strated significant differences between each of the peak cadence indicators and BMI or BF%-de-fined weight status in the total sample and in boys when analyzed separately. Only the peak 1-minute cadence differed significantly across BMI and BF% weight status categories in girls. Boys consistently achieved significantly higher mean values for each of the peak cadence indi-cators compared to girls. We found significant negative associations between each of the peak cadence indicators and BMI or BF% continuous variables when controlling for sex and school.
This study supports previous research that has shown negative relationships between peak cadence indicators and weight status17,36. For
ex-ample, Jago et al.36 divided American boys aged
11–15 years into groups of normal weight (BMI < 85th percentile) and at risk of being overweight
(BMI ≥ 85th percentile) and reported that
nor-mal weight children achieved significantly higher mean steps/min values during continuous slow walk (121.0 versus 110.1 steps/min), fast walk (129.4 versus 122.5 steps/min), and running (168.6 versus 153.2 steps/min) compared with
children at risk of being overweight. Our results demonstrated that normal weight boys (defined by BMI as ≤ 1 SD) had higher peak 1-minute (118.8 versus 107.1 steps/min), 30-minute (86.0 versus 74.9 steps/min) and 60-minute (72.4 versus 62.0 steps/min) free-living cadence than overweight children (p < .0001).
Barreira et al.17 analyzed the 2005-2006
NHANES data and showed that normal weight (defined as < 85th percentile BMI) boys and girls
(combined) had higher peak cadence (peak 1-minute, 30-minute and 60-minute) than those defined as obese (≥ 95th percentile BMI). For
example, for peak 60-minute cadence, children with normal weight BMI had a mean of 73 steps/ min and obese children had a mean of 67 steps/ min; however, in the peak 30-minute and peak 60-minute cadences there were no mean differ-ences between overweight and obese. Our study reported that children classified as overweight/ obese had lower values for all peak cadence in-dicators than normal weight children by BMI status and we found similar differences in peak 60-minute cadence between BMI-defined
nor-Table 3. Descriptive (mean and 95% CI) analysis of peak cadence indicators of according BF% status and sex in
Brazilian children.
Peak cadence Indicator
BF% status
Sample Normal Weight Overweight Obese pa
Peak 1-minute
Both Boys Girls
114.5 (111.6-117.4) d
117.4 (114.2-120.6) d
111.6 (108.5-114.8) bd
111.1 (107.0-115.1) e
112.3 (106.8-117.8) e
109.8 (105.0-114.6)
106.1 (102.5-109.7) 105.2 (101.0-109.4) 107.0 (102.5-111.5)
<.0001 <.0001 .1075
Peak 30-minute
Both Boys Girls
80.4 (76.8-84.1) d
84.8 (81.0-88.7) d
76.0 (72.2-79.9) b
77.5 (72.9-82.2) 80.3 (74.2-86.4) e
74.7 (69.3-80.1)
73.1 (68.9-77.3) 73.1 (68.3-77.9) 73.2 (68.0-78.4)
<.0001 <.0001 .4642
Peak 60-minute
Both Boys Girls
66.5 (63.3-69.7) d
71.3 (67.8-74.8) cd
61.7 (58.2-65.1) b
63.3 (59.0-67.5) 66.0 (60.4-71.6) 60.5 (55.6-65.5)
59.9 (56.1-63.7) 60.4 (56.0-64.8) 59.3 (54.6-64.0)
<.0001 <.0001 .5347
BF%: body fat percentage. a Trend in least-squared means across BMI-defined weight status categories; b significant difference between boys and girls (p < .05); c significant difference between normal weight and overweight (p < .05); d significant difference between normal weight and obese (p < .05); e significant difference between overweight and obese (p < .05).
Table 4. Adjusted analyses between peak cadence indicators, BMI and BF% in Brazilian children.
Peak cadence indicators BMI (kg/m
2) BF%
β coefficient 95% CI p-value β coefficient 95% CI p-value
Peak 1-minute -.102 -.129, -.074 <.0001 -.203 -.259, -.146 <.0001 Peak 30- minute -.073 -.099, -.046 <.0001 -.151 -.205, -.097 <.0001 Peak 60- minute -.078 -.107, -.049 <.0001 -.166 -.224, -.107 <.0001
aúd
e C
ole
tiv
a,
22(11):3689-3698,
2017
mal weight (67.1 steps/min) and obese children (60.7 steps/min).
We found significant negative associations between weight status and each of the peak dence indicators. Our decision to link peak ca-dence indicators to sex-specific weight status cut points (BMI and BF%)33,34 discriminating normal
weight and overweight/obesity is justified based on the overwhelming evidence of an increasing world-wide obesity epidemic1 and further
sup-ported by the statistical differences in peak ca-dence indicators identified herein between sex and BMI and BF%-defined weight status cate-gories. There were significant differences in peak cadence indicators across weight status (BMI: normal weight versus overweight and obesity; BF%: normal weight versus obesity) categories for boys, but in girls only the peak 1-minute ca-dence indicator differed between normal weight and obesity (BMI and BF%). Girls appeared to be homogeneously lower in their “best natural effort” regardless of weight status category, es-pecially for the peak 30-minute and 60-minute cadence indicators, which are shaped not only by intensity of effort but also by relative “per-sistence” of this behavior, whereas peak 1-minute is not similarly shaped by such persistence.
In the present study, boys had significantly higher mean values for each of the peak cadence indicators than girls. Our findings agree with recent studies that boys accumulate more steps/ day than girls17,37,38. Barreira et al.17
demonstrat-ed differences between the sexes only for peak 60-minute cadence (73 steps/min for boys versus 70 steps/min for girls). The authors found no significant differences in peak 1-minute or peak 30-minute cadence indicators by sex. Recent-ly, Barreira et al.38 reported sex-and-age specific
normative values of peak 60-minute for children and adolescents from United States using data from the 2005-2006 NHANES and found that boys take 74.5 steps/min and girls take 72 steps/ min. In a review article attempting to answer how many steps/day are enough for children and adolescents, Tudor-Locke et al.37 indicated that,
on average, boys and girls take 12 000-16 000 and 10 000-13 000 total steps/day, respectively.
Findings presented here suggest a strong rela-tionship between peak cadence and weight status independent of sex and school. We reported neg-ative associations between each of the peak ca-dence indicators studied and both BMI and BF%. Similarly Gardner et al.16 reported sex-adjusted
differences in daily average cadence related to presence or absence of metabolic syndrome (14.9
versus 13.6 steps/min) in children, adolescents, and young adults. The lower values for peak ca-dence indicators in obese children should also be related to lower daily energy expenditure of physical activity39, setting the stage for long-term
positive energy balance and exacerbating further increases in body weight and fatness. Collectively, our results support the notion that intensity of physical activity expressed as peak cadence in-dicators is an important factor in distinguishing between normal weight, overweight and obese children. This is further supported by studies showing that time spent in MVPA is protective against developing weight status in children2,40,41.
Weight status is an important correlate of daily ambulation patterns in children. BMI and BF% were both significantly and negatively as-sociated with each peak cadence indicator. These results indicate that participants with high levels of body fat ambulate at lower peak cadences than those with less body fat16. Our findings agree with
others that have reported a strong association between obesity and accelerometer-determined physical activity2,40.
The strengths of this study include the objec-tive measurement of peak cadence indicators and the measurement of body fat using bioelectrical impedance in Brazilian children. These tech-niques and approaches are rare in Brazil where most previous research has relied upon indirect measures of physical activity collected by ques-tionnaires42-44.This is the first study that has used
F
er
rar
i GLM
relationship with other health parameters using cross-sectional, longitudinal, and intervention study designs.
Conclusion
This analysis of the ISCOLE accelerometry data represents the first examination of the relation-ship between peak cadence indicators and BMI and BF%-defined weight status in children from São Caetano do Sul, Brazil.
The present study provided evidence of sig-nificant negative associations between BMI as well as BF% and peak cadence indicators (peak 1-minute, 30-minute and 60-minute) among
10-year old Brazilian children, independent of sex and school. We reported significant differences in each of the peak cadence indicators across BMI or BF%-defined weight categories in the total sample and in boys. Only the peak 1-minute ca-dence differed significantly across BMI and BF% weight status categories in girls. Boys had higher values for all peak cadence indicators than girls in the normal weight category.
Further research is needed to continue to de-velop means of gathering more comprehensive data in order to better elucidate the full nature of the correlates of obesity. These reference data are novel and important and can be used for surveil-lance, tracking, comparison, screening, interven-tion, and evaluation purposes.
Collaborations
GLM Ferrari conceived, designed, and imple-mented the study, collected and helped to write and revise the manuscript; T Araújo, LC Olivei-ra and VKR Matsudo helped to implement the study and to write the manuscript; E Mire per-formed statistical analyses and interpreted the data; T Barreira was responsible for the data col-lection, helped implement the study, and helped to write the manuscript; C Tudor-Locke inter-preted the data, and helped to write and revise the manuscript; PT Katzmarzyk was responsible for coordinating the study and contributed to the intellectual content. All authors contributed to the study design, critically reviewed the manu-script and approved the final version.
Acknowledgments
The authors thank the participants, their parents and guardians, the teachers and coordinators of Municipal Secretary Education of São Caetano do Sul and the Municipal Government of São Caetano do Sul.
aúd
e C
ole
tiv
a,
22(11):3689-3698,
2017
References
1. Marie Ng, Fleming T, Margaret Robinson, Thomson B, Graetz N, Margono C, Mullany EC, Biryukov S,Ab-bafati C, Abera SF, Abraham JP, Abu-Rmeileh NME, Achoki T, AlBuhairan FS, Alemu ZA, Alfonso R, Ali MK, Ali R, Guzman NA, Ammar W, Anwari P, Ba-nerjee A, Barquera S, Basu S, Bennett DA, Bhutta Z, Blore J, Cabral N, Nonato IC,Chang JC, Chowdhury R, Courville KJ, Criqui MH, Cundiff DK, Dabhadkar KC, Dandona L, Davis A, Dayama A, Dharmaratne SD, Ding EL, Durrani AM, Esteghamati A, Farzadfar F, Fay DFJ, Feigin VL, A Flaxman A, Forouzanfar MH, Goto A, Green MA, Gupta R, Hafezi-Nejad N, Hankey GJ, Harewood HC, Rasmus, Hay S, Hernandez L, Husseini A, Idrisov BT, Ikeda N, Islami F, Jahangir E, Jassal SK, Jee SH, Jeffreys M, Jonas JB, Kabagambe EK, Khalifa AEAH, Kengne AP, Khader YS, Khang YH, Kim D, Kimokoti RW, Kinge JM, Kokubo Y, Kosen S, Kwan G, Lai T, Leinsalu M, Li Y, Liang X,Liu S, Logroscino G, Lotufo PA, Lu Y, Ma J, Mainoo NK, Mensah GA, Merriman TR, Mokdad AH, Moschandreas J, Naghavi M, Naheed A, Nand D, Narayan V, Nelson EL, Neu-houser ML, Nisar MI, Ohkubo T, Oti SO, Pedroza A, Prabhakaran D, Roy N, Sampson U, SeoH, Sepanlou SG, Shibuya K, Shiri R, Shiue I, Singh GM, Singh JA, Skirbekk V, Stapelberg NJC, Sturua L, Sykes BL, Tobi-as M, Tran BX, TrTobi-asande L, Toyoshima H, van de Vi-jver S, Vasankari TJ, Veerman JL, Velasquez-Melendez G, Prof Vasiliy VV, Vollset SE, Vos T, Wang C, Wang X, Weiderpass E, Werdecker A, Wright JL, Yang YC, Yatsuya H, Yoon J, Yoon SJ, Zhao Y, Zhoun M, Zhurof S, Lopez AD, Murray CJL, Gakidou E. Global, region-al, and national prevalence of overweight and obesity in children and adults during 1980-2013: a systematic analysis for the Global Burden of Disease Study 2013 Lancet 2014; 384(9945):766-781.
2. Jimenez-Pavon D, Kelly J, Reilly JJ. Associations be-tween objectively measured habitual physical activity and adiposity in children and adolescents: Systematic review. Int J Pediatr Obes 2010; 5(1):3-18.
3. Colley RC, Wong SL, Garriguet D, Janssen I, Connor Gorber S, Tremblay MS. Physical activity, sedentary be-haviour and sleep in Canadian children: parent-report versus direct measures and relative associations with health risk. Health Rep 2012; 23(2):45-52.
4. Ferrari GL, Oliveira LC, Araujo TL, Matsudo V, Barrei-ra TV, Tudor-Locke C, Katzmarzyk P. ModeBarrei-rate-to-vig- Moderate-to-vig-orous physical activity and sedentary behavior: inde-pendent associations with body composition variables in Brazilian children. Pediatr Exerc Sci 2015; 27(3):380-389.
5. Craig CL, Cameron C, Tudor-Locke C. CANPLAY pe-dometer normative reference data for 21,271 children and 12,956 adolescents. Med Sci Sports Exerc 2013; 45(1):123-129.
6. Tudor-Locke C, Johnson WD, Katzmarzyk PT. Accel-erometer-determined steps per day in US children and youth. Med Sci Sports Exerc 2010; 42(12):2244-2250. 7. Schuna Junior JM, Brouillette RM, Foil HC, Fontenot
SL, Keller JN, Tudor-Locke C. Steps per day, peak ca-dence, body mass index, and age in community-dwell-ing older adults. Med Sci Sports Exerc 2013; 45(5):914-919.
8. Tudor-Locke C, Camhi SM, Leonardi C, Johnson WD, Katzmarzyk PT, Earnest CP, Church TS. Patterns of adult stepping cadence in the 2005-2006 NHANES. Prev Med 2011; 53(3):178-181.
9. Hoshikawa T, Toyoshima S, Ikegami Y, Mori SYS. Prac-tical application of an actogram to physical fitness re-search: recording of physical activity pattern during daily life. Jpn J Phys Fit Sport 1992; 41(2):174-182. 10. Rowlands AV, Stone MR, Eston RG. Influence of speed
and step frequency during walking and running on motion sensor output. Med Sci Sports Exerc 2007; 39(4):716-727.
11. Abel M, Hannon J, Mullineaux D, Beighle A. Determi-nation of step rate thresholds corresponding to physi-cal activity intensity classifications in adults. J Phys Act Health 2011; 8(1):45-51.
12. Rowe DA, Welk GJ, Heil DP, Mahar MT, Kemble CD, Calabro MA, Camenisch K. Stride rate recommenda-tions for moderate-intensity walking. Med Sci Sports Exerc 2011; 43(2):312-318.
13. Harrington DM, Dowd KP, Tudor-Locke C, Donnelly AE. A steps/minute value for moderate intensity phys-ical activity in adolescent females. Med Sci Sports Exerc 2012; 24(3):399-408.
14. Tudor-Locke C, Bassett Junior DR. How many steps/ day are enough? Preliminary pedometer indices for public health. Sports Med 2004; 34(1):1-8.
15. Bjornson KF, Song K, Zhou C, Coleman K, Myaing M, Robinson SL. Walking stride rate patterns in children and youth. Pediatr Phys Ther 2011; 23(4):354-363. 16. Gardner AW, Parker DE, Krishnan S, Chalmers LJ.
Met-abolic syndrome and daily ambulation in children, ad-olescents, and young adults. Med Sci Sports Exerc 2013; 45(1):163-169.
17. Barreira TV, Katzmarzyk PT, Johnson WD, Tu-dor-Locke C. Cadence patterns and peak cadence in US children and adolescents: NHANES, 2005-2006. Med Sci Sports Exerc 2012; 44(9):1721-1727.
18. Barreira TV, Katzmarzyk PT, Johnson WD, Tu-dor-Locke C. Walking cadence and cardiovascular risk in children and adolescents: NHANES, 2005-2006. Am J Prev Med 2013; 45(6):e27-e34.
19. Tudor-Locke C, Rowe DA. Using cadence to study free-living ambulatory behaviour. Sports Med 2012; 42(5):381-398.
20. Ferrari GLM, Araújo TL, Oliveira LC, Matsudo V. Fis-berg M. Association between electronic equipment in the bedroom and sedentary lifestyle, physical activity, and body mass index of children. J Pediatr (Rio J) 2015; 91(6):574-582.
21. Ferrari GLM, Araújo TL, Oliveira LC, Matsudo VKR, Mire E, Barreira TV, Tudor-Locke C, Katzmarzyk PT. Association between television viewing and physical activity in 10-year old brazilian children. J Phys Act Health 2015; 12(10):1401-1408.
F
er
rar
i GLM
23. Instituto Brasileiro de Geografia e Estatística (IBGE). Indicadores sociais municipais: uma análise dos resulta-dos do universe do censo demográfico.[internet]. 2010 [acessado 2012 Jun 05]. Disponível em: http://www. ibge.gov.br/home/estatistica/populacao/censo2010/ indicadores_ sociais_municipais/default_indicadores_ sociais_municipais.shtm
24. Programa das Nacoes Unidas para o Desenvolvimen-to (PNUD), Fundacao Joao Pinheiro (FJP). O Índice de desenvolvimento humano municipal brasileiro. Série Atlas do Desenvolvimento Humano no Brasil. Rio de Ja-neiro: PNUD, FJP, IPEA; 2013.
25. Trost SG, Loprinzi PD, Moore R, Pfeiffer KA. Com-parison of accelerometer cut points for predicting activity intensity in youth. Med Sci Sports Exerc 2011; 43(7):1360-1368.
26. Colley R, Connor Gorber S, Tremblay MS. Quality control and data reduction procedures for accelerom-etry-derived measures of physical activity. Health Rep 2010; 21(1):63-69.
27. Masse LC, Fuemmeler BF, Anderson CB, Matthews CE, Trost SG, Catellier DJ, Treuth M. Accelerometer data reduction: a comparison of four reduction algorithms on select outcome variables. Med Sci Sports Exerc 2005; 37(11 Supl.):S544-554.
28. Choi L, Liu Z, Matthews CE, Buchowski MS. Validation of accelerometer wear and nonwear time classification algorithm. Med Sci Sports Exerc 2011; 43(2):357-364. 29. Barreira TV, Schuna JM, Jr., Mire EF, Katzmarzyk PT,
Chaput JP, Leduc G, Tudor-Locke C. Identifying chil-dren’s nocturnal sleep using 24-h waist accelerometry. Med Sci Sports Exerc 2015; 47(5):937-943.
30. Le Masurier GC, Tudor-Locke C. Comparison of pe-dometer and accelerometer accuracy under controlled conditions. Med Sci Sports Exerc 2003; 35(5):867-871. 31. Lohman T, Roche AF, Martorell RE. Anthropometric
Standardization Reference Manual. Champaign: Hu-man Kinetics; 1988.
32. Barreira TV, Staiano AE, Katzmarzyk PT. Validity as-sessment of a portable bioimpedance scale to estimate body fat percentage in white and African-Ameri-can children and adolescents. Pediatric Obes 2013; 8(2):e29-32.
33. de Onis M, Onyango AW, Borghi E, Siyam A, Nishida C, Siekmann J. Development of a WHO growth reference for school-aged children and adolescents. Bull World Health Organ 2007; 85(9):660-667.
34. McCarthy HD, Cole TJ, Fry T, Jebb SA, Prentice AM. Body fat reference curves for children. Int J Obesity 2006; 30(4):598-602.
35. Statistical. Statistical Analysis System (SAS) for Win-dows. Release 6.12. Cary: SAS Institute Inc;1996.
36. Jago R, Watson K, Baranowski T, Zakeri I, Yoo S, Ba-ranowski J, Conry K. Pedometer reliability, validity and daily activity targets among 10- to 15-year-old boys. J Sports Sci 2006; 24(3):241-251.
37. Tudor-Locke C, Craig CL, Beets MW, Belton S, Cardon GM, Duncan S, Hatano Y, Lubans DR, Olds TS, Raus-torp A, Rowe DA, Spence JC, Tanaka S, Blair SN. How many steps/day are enough? for children and adoles-cents. Int J Behav Nutr Phys Act 2011; 28(8):78. 38. Barreira TV, Schuna Junior JM, Mire EF, Broyles ST,
Katzmarzyk PT, Johnson WD, Tudor-Locke C. Norma-tive steps/day and peak cadence values for united states children and adolescents: National Health and Nutri-tion ExaminaNutri-tion Survey 2005-2006. J Pediatr 2015; 166(1):139-143.
39. Jago R, Ness AR, Emmett P, Mattocks C, Jones L, Rid-doch CJ. Obesogenic diet and physical activity: inde-pendent or associated behaviours in adolescents? Pub-lic Health Nutr 2010; 13(5):673-681.
40. Lee S, Kuk JL, Hannon TS, Arslanian SA. Race and gender differences in the relationships between anthro-pometrics and abdominal fat in youth. Obesity 2008; 16(5):1066-1071.
41. Basterfield L, Pearce MS, Adamson AJ, Frary JK, Par-kinson KN, Wright CM, Reilly JJ; Gateshead Millen-nium Study Core Team. Physical activity, sedentary behavior, and adiposity in English children. Am J Prev Med 2012; 42(5):445-451.
42. Rezende LF, Azeredo CM, Canella DS, Claro RM, de Castro IR, Levy RB, Luiz Odo C. Sociodemographic and behavioral factors associated with physical activ-ity in Brazilian adolescents. BMC Public Health 2014; 14:485.
43. Bracco MM, Colugnati FA, Pratt M, Taddei JA. Mul-tivariate hierarchical model for physical inactivity among public school children. J Pediatr (Rio J) 2006; 82(4):302-307.
44. Ceschini FL, Andrade DR, Oliveira LC, Araujo Junior JF, Matsudo VK. Prevalence of physical inactivity and associated factors among high school students from state’s public schools. J Pediatr (Rio J) 2009; 85(4):301-306.
Artigo apresentado em 04/11/2015 Aprovado em 29/03/2016