CHAPTER
4
*Changes in Thoracic Gas Volume with Air Displacement
Plethysmography after a Weight Loss Program in Overweight and Obese
Women
Cláudia S. Minderico1, Analiza M. Silva1, David A Fields2, Teresa L. Branco1, Sandra S.
Martins1, António L. Palmeira1, José T, Barata1, Elvis A. Carnero1, Paulo M. Rocha1, Pedro J.
Teixeira1 and Luis B. Sardinha1*
1
Exercise and Health Laboratory, Faculty of Human Movement-Technical University of
Lisbon, Portugal and
2
Department of Pediatrics, Children’s Medical Research Institute’s Metabolic Research
Center, University of Oklahoma Health Science Center, OK, USA
Running Title: Changes in VTG with ADP after weight loss.
*Correspondence author:
Luis Bettencourt Sardinha Exercise and Health Laboratory Faculty of Human Movement Technical University of Lisbon Estrada da Costa
1499-688 Cruz-Quebrada Portugal
Tel: (351) 21 414 91 60 Fax: (351) 21 414 91 93 [email protected]
*Minderico, C.S., Silva, A.M., Fields, D.A., Branco, T.L., Martins, S.S., Palmeira, A.L., Barata, J.T., Carnero, E.A., Rocha, P.M., Teixeira, P. J. & Sardinha, L.B. (2006). Changes in Thoracic Gas Volume with Air Displacement Plethysmography After a Weight Loss Program
A
BSTRACTObjective: This study was designed to study the impact of a 16-month weight loss
program on measured and predicted thoracic gas volume (VTG) measurements employed
by air displacement plethysmography (ADP).
Design: Intervention study.
Setting: Outpatient University Laboratory, Lisbon, Portugal.
Subjects: Subjects were 85 overweight and obese women (39.0±5.7 y; 76.6±10.1
kg; 159.8±5.6 cm; 30.0±3.5 kg/m2).
Methods: Subjects participated in a 16-month university-based weight-loss program.
Body weight, body volume (Vb), body density (Bd), fat mass (FM), percent fat mass
(%FM), fat-free mass (FFM) were assessed by ADP at baseline and at post-intervention
(16 months). ADP requires the assessment of the VTG, thus VTG was measured directly
and predicted utilizing ADP software. To obtain a measure of central adiposity, waist
circumference was measured (WC). Additionally, dual-energy x-ray absorptiometry
(Hologic QDR 1500) was also used for body composition assessement.
Results: Significant differences between the baseline and post-weight loss intervention
were observed for body weight and composition (Vb, Db, %FM, FM, FFM) and
measures of VTG (measured: ∆= 0.2 L, p<0.001; predicted: ∆= 0.01 L, p<0.010)
variables. Measured VTG change was negatively associated with the change in the WC
(p=0.008). Linear regression analysis results indicated that %FM using the measured
and predicted VTG explained 72% and 76% of the variance in %FM changes using
DXA.
Conclusion: In conclusion, after weight loss, measured VTG increased significantly
changes is the WC, which is an indicator central adiposity. Consequently, measured
and predicted VTG should not be used interchangeably in body composition changes
assessment.
Key words: Waist circumference; Weight loss; Body composition; Air Displacement
Plethysmography; Thoracic Gas Volume.
I
NTRODUCTIONWeight loss intervention programs typically emphasize a loss in body weight as
the primary outcome, just as important though, is a loss in fat mass. Therefore, the need
for accurate techniques in the assessment of body composition in weight loss clinical
programs is important.
There are several body composition instruments that can be applied in a clinical
setting (1). Recently, air-displacement plethysmography (ADP) has been used for
measuring human body composition (i.e. BOD POD; Life Measurement Incorporated,
Concord, CA), in part because of its wide applicability to many diverse populations and
its relative ease both on the subject and tester as compared to more traditional
techniques. This equipment has been widely validated against reference methods in
healthy children, adolescents, adults, and elderly (2-11). Furthermore, test-retest
reliability, between-day variability, within-subject variability, and between instrument
variability appear to be good to excellent (12-14). Other studies have also assessed the
importance of selected methodological issues associated with ADP such as the effects
of clothing, hair, and skin surface area to measure Vb with adequate accuracy (13, 15).
Air-displacement plethysmography utilizes the inverse relationship between
pressure and volume (Boyle’s law) to measure body volume (Vb) as described by
underestimated by 40% of the thoracic gas volume (VTG) partly because the air in the
lungs is isothermic is 40% more compressible than adiabatic air. Thus, failure to
correct for this phenomenon will result in an overestimation of total body density (Db)
and, consequently, an underestimation of percent fat mass (%FM), therefore
measurement of VTG by the BOD POD is incorporated into the testing procedure (17).
Alternatively, the BOD POD provides the use of a predicted VTG (VTGPredicted) (18). The
validity of using the VTGPredicted in place of the measured VTG (VTGMeasured) to determine
%FM was studied in a few cross-sectional studies with mixed results (19, 20).
Accordingly, no differences were found between measured vs. predicted VTG in
different age groups.
Changes in body weight and composition (commonly seen in a weight loss
program) may result in functional alterations in the VTG. Refsum et al (21) has reported
a change in lung function (i.e. increased filling of the lungs, improved dynamic
function, reduced ventilation disturbances) following weight loss. Moreover,
Wannamethee et al. (21-23) concluded that total body fat and central adiposity
measured by waist circumference is inversely associated with lung function in
non-obese and non-obese elderly men after adjusting for confounders such as age and height.
Hence, functional changes in the measured VTG may be an important methodological
issue that needs to be addressed within the scope of the BOD POD in general and
weight loss programs specifically. Therefore, the purpose of this study was two-fold: to
compare changes between the measured and predicted VTG following a 16-month
weight loss intervention program and to understand the effect of confounders (e.g. waist
M
ETHODSSubjects
Subjects were recruited from the Lisbon community for a sixteen month weight
management program through newspaper ads, the internet, and flyers. Eligibility into
the study required subjects: 1) > 24 years, 2) pre-menopausal, 3) currently not pregnant
nor trying to become pregnant, 4) body mass index (BMI) between >25 kg/m2 and <40
kg/m2, and 5) free of major diseases. After several orientation sessions, 152 women
enrolled into the program. During the run-in phase, four women decided not to
participate (reporting time and scheduling conflicts), four did not comply with testing
requirements and were excluded, three women were pregnant or were trying to become
pregnant, and one subject was found ineligible due to medical reasons (untreated
hyperthyroidism), leaving a total of 140 women who started the intervention. An initial
visit with the study physician ensured that subjects met all the medical inclusion
criteria. All participants agreed to refrain from participating in any other weight loss
program and gave written informed consent prior to participation in the study. The
research design of the 16-month weight loss program is described in detail elsewhere
(24). Briefly, the program included educational content and practical application classroom exercises in the areas of physical activity and exercise, diet and eating
behaviour, and behaviour modification. Sixteen months after the intervention, 93
women were evaluated but only 85 women performed all the body composition
methods and had successful thoracic gas volume measured. The Institutional Review
Surface morphology
Subjects were weighed wearing a swimming suit without shoes on using an
electronic scale connected to the plethysmograph computer (BOD POD, Life
Measurement Instruments, Concord, CA, USA) to the nearest 0.01 kg. Height was
measured to the nearest 0.1 cm with a stadiometer (Seca, Hamburg, Germany).
A trained researcher measured waist circumference (WC) above the iliac crest
according to the procedures of Lohman (25). For data analysis, the averages of the three
measurements were considered. The technical error of measurement (TEM) and the
intraclass coefficient of correlation (ICC) for WC in ten subjects in our laboratory is
0.41 and 1.00, respectively.
ADP testing
The subjects Vb was assessed via air-displacement plethysmography using the
BOD POD software version 1.68 (Life Measurement Incorporated, Concord, CA,
USA) according to manufacturer testing recommendations and guidelines. Details
regarding the physical concepts and operational principles of the ADP are reported
elsewhere (16, 26) . Briefly, each subject wore a swimsuit and cap provided by the
laboratory while body mass was measured to the nearest 100 g by an electronic scale
connected to the BOD POD computer. Next, the measured VTG was calculated where:
VTG = functional residual capacity + 0.5 tidal volume
Alternatively, the BOD POD offers the ability to predict the VTG in cases where a
VTG = functional residual capacity + 0.5 tidal volume
The predicted VTG equation is calculated from Crapo et al.(18) equation and is
based upon a functional residual capacity that is derived by the following equation
developed for women:
Functional residual capacity (L) = 0.0472 x H + 0.009 x age – 5.290
where H is height in centimeters and the ADP software calculates the tidal volume by
using a constant of 0.7 L for women. The Crapo et al. (18) prediction VTG equations
were developed from healthy adult male and female subjects between the ages of 17-91
years, by using single breath helium dilution techniques .
After the VTG was measured the corrected Vb was calculated and the subsequent
total body density (Db), with %FM calculated utilizing the Siri equation (27). The
TEM and the coefficient of variation (CV) for body volume in our laboratory in ten
subjects is 0.20 L and 0.5 %, respectively.
Dual Energy X-ray Absorptiometry
To estimate total fat mass (FM) and fat-free mass (FFM), dual energy X-ray
absorptiometry (DXA) was used (QDR-1500, Hologic, Waltham, USA, pencil beam
mode, software version 5.67 enhanced whole-body analyses). Following the protocol
for DXA described by the manufacturer, a step phantom with six fields of acrylic and
aluminium of varying thickness and known absorptive properties was scanned alongside
each subject to serve as an external standard for the analysis of different tissue
composition. The same lab technician positioned the subjects, performed the scans and
executed the analysis according to the operator’s manual using the standard analysis
protocol. The CV for FM in our laboratory in ten subjects is 2.9%.
Balke’s (28) modified cardiopulmonary exercise testing protocol was used to asses
cardiovascular fitness using a Quinton 645 treadmill. VO2 max was measured using a
breath-by-breath system with a zircon O2 gas analyser coupled to measurement
pulmonary flow (MedGraphics® MN, USA), with an accuracy ±3% and ±0.1%,
respectively.
Statistical analyses
All data are reported as the mean ± standard deviation (SD). Differences between
predicted and measured mean variables were evaluated by a paired sample t-test.
Multiple regression analysis was applied to investigate changes in the measured VTG
with recognized influencing factors, such as waist circumference, VO2 max, and age.
Statistical significance was set at p≤0.05 and data were analyzed using SPSS (version 14.0; SPSS Inc. Chicago, IL).
R
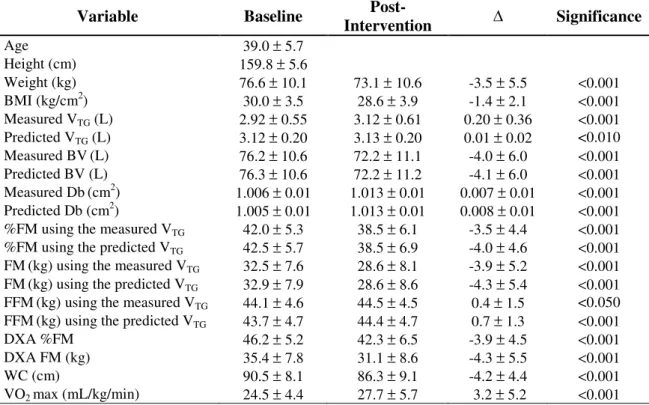
ESULTSSubject descriptive characteristics at baseline and post-weight loss intervention are
reported in Table 1. Significant differences between the baseline and post-weight loss
intervention were observed for body weight and composition (Vb, Db, %FM, FM,
Table 1. Subjects characteristic and body composition variables (Mean ± SD) in all completers (N=85).
Variable Baseline
Post-Intervention Significance
Age 39.0 ± 5.7
Height (cm) 159.8 ± 5.6
Weight (kg) 76.6 ± 10.1 73.1 ± 10.6 -3.5 ± 5.5 <0.001 BMI (kg/cm2) 30.0 ± 3.5 28.6 ± 3.9 -1.4 ± 2.1 <0.001 Measured VTG (L) 2.92 ± 0.55 3.12 ± 0.61 0.20 ± 0.36 <0.001 Predicted VTG (L) 3.12 ± 0.20 3.13 ± 0.20 0.01 ± 0.02 <0.010 Measured BV(L) 76.2 ± 10.6 72.2 ± 11.1 -4.0 ± 6.0 <0.001 Predicted BV (L) 76.3 ± 10.6 72.2 ± 11.2 -4.1 ± 6.0 <0.001 Measured Db(cm2) 1.006 ± 0.01 1.013 ± 0.01 0.007 ± 0.01 <0.001 Predicted Db (cm2) 1.005 ± 0.01 1.013 ± 0.01 0.008 ± 0.01 <0.001 %FM using the measured VTG 42.0 ± 5.3 38.5 ± 6.1 -3.5 ± 4.4 <0.001 %FM using the predicted VTG 42.5 ± 5.7 38.5 ± 6.9 -4.0 ± 4.6 <0.001 FM(kg) using the measured VTG 32.5 ± 7.6 28.6 ± 8.1 -3.9 ± 5.2 <0.001 FM(kg) using the predicted VTG 32.9 ± 7.9 28.6 ± 8.6 -4.3 ± 5.4 <0.001 FFM(kg) using the measured VTG 44.1 ± 4.6 44.5 ± 4.5 0.4 ± 1.5 <0.050 FFM(kg) using the predicted VTG 43.7 ± 4.7 44.4 ± 4.7 0.7 ± 1.3 <0.001 DXA %FM 46.2 ± 5.2 42.3 ± 6.5 -3.9 ± 4.5 <0.001 DXA FM (kg) 35.4 ± 7.8 31.1 ± 8.6 -4.3 ± 5.5 <0.001 WC (cm) 90.5 ± 8.1 86.3 ± 9.1 -4.2 ± 4.4 <0.001 VO2 max (mL/kg/min) 24.5 ± 4.4 27.7 ± 5.7 3.2 ± 5.2 <0.001 SD, Standard Deviation; BMI, Body Mass Index; VTG, Gas Thoracic Volume; BV, Body Volume; Db, Body Density; %, Percentage; FM, Fat Mass, FFM, Fat Free Mass, DXA, Dual Energy X-ray
absorptiometry; WC, Waist Circumference; VO2max, maximal oxygen uptake; is the change between baseline and post-weight loss intervention program.
Linear regression analysis was performed to compare %FM changes using the
measured and predicted VTG and %FM changes from DXA with the results presented in
Table 2. Similar regression parameters were found between %FM changes obtained
from both the measured and predicted VTG with %FM changes from DXA. The results
indicate that %FM using the measured and predicted VTG explained 72% and 76% of
the variance in %FM changes using DXA with similar standard error of estimations of
2.2% and 2.4%, respectively. In addition, no significant mean bias was observed
between %FM changes using the measured and predicted VTG with %FM changes from
Table 2. Regression between %FM changes from measured and predicted VTG and %FM from DXA.
%FM changes (measured VTG)
%FM changes (predicted VTG) Independent Variable
R2 SEE Bias R2 SEE Bias
%FM from DXA 0.72 2.41 0.877 0.76 2.23 0.105 %, Percentage; FM, Fat Mass; VTG, Gas Thoracic Volume; R2, Coefficient of Determination; SEE, Standard Error of Estimation.
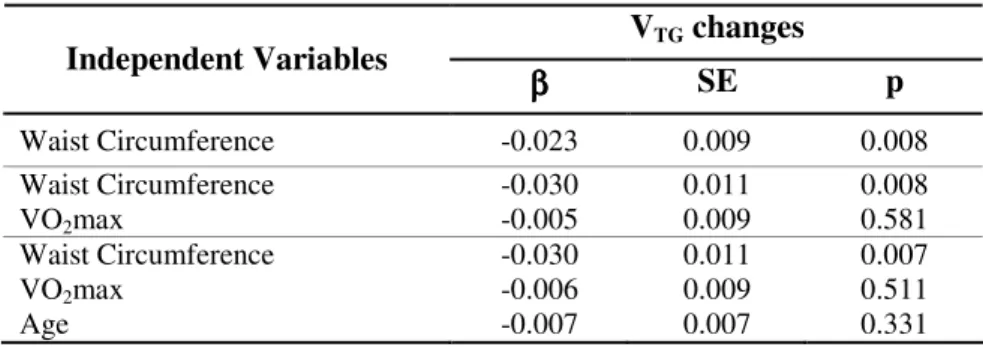
Multiple regression analysis was performed to explain the significant difference in
the measured VTG between the baseline and 16 month post-weight loss program. The
change in the measured VTG observed were significantly and negatively
associated/influenced by waist circumference and this significant influence was
observed even after controlling for VO2 max and age (Table 3).
Table 3. β Coefficients from multiple regression analysis examining the effect of potential variables on VTG changes.
VTG changes
Independent Variables
β β β
β SE p
Waist Circumference -0.023 0.009 0.008 Waist Circumference
VO2max
-0.030 -0.005 0.011 0.009 0.008 0.581 Waist Circumference
VO2max Age -0.030 -0.006 -0.007 0.011 0.009 0.007 0.007 0.511 0.331
β, Beta coefficient ; SE, Standard Error; p, Pearson significance.
D
ISCUSSIONTo our knowledge, this is the first study that has investigated the impact of a
weight loss intervention program on VTG and the subsequent impact on body
significantly overestimated by ~0.2 L when utilizing the predicted VTG equations vs.
measuring the VTG.
In order to appreciate the impact that the VTG plays on the estimation of %FM and
absolute FM it is important to consider how VTG is used to calculate total BV and
subsequently Db and %FM. The ADP software calculates body volume with the
following equation:
BV = BVraw + 0.40 VTG – SAA
Where BV is the body volume, VTG is the thoracic gas volume, SAA is the surface area
artifact, and the BVraw is the body volume prior to correcting for the VTG and SAA.
For example, if the BVraw and SAA remain unchanged (78.7 L and -0.9,
respectively) with an observed VTG change of 1.2 L the final effect on a 90 kg women
would have resulted in a final BV change of 0.5 L, thus impacting the estimation in
body composition by 2.6% FM units ( i.e. 2.3 kg of absolute FM). Considering that the
mean % FM change in this sample was ~3.5% and the change in the measured VTG was
~0.2 L it would be plausible to suggest that some of the loss in FM observed could be
directly contributed to the change in the VTG.
To better understand the effect of using a measured or predicted VTG on estimates
of %FM, an independent method of body composition (i.e. DXA) was used to further
explore and refine these relationships. The findings suggest a strong relationship
between the effects of both VTG methods on %FM changes with %FM changes using
DXA, which explained 72 to 76% of the total variance in %FM changes from DXA.
Therefore, it seems that for group comparisons the observed differences in %FM
estimation using either the measured or predicted VTG, though significantly different,
should not use interchangeable the measured and predicted VTG, particularly to assess
body composition changes in a weight loss program.
In order to explain the discrepant results between the measured VTG before and
after the intervention we hypothesized that body composition changes observed after the
intervention, namely central body fat distribution would significantly impact VTG. Our
findings presented a 4.2 cm reduction in the waist circumference (∆WC, p<0.001) which indicated a significant decrease in central body fat distribution. Lung function
was not obtained in the present study, however, VO2 max was obtained and a significant
increase was seen (p<0.001). In addition, a significant and inverse correlation (p<0.001) was found between waist circumference changes and the change in VO2 max (r =-0.423)
(data not shown).
The relationship between WC and the changes in the measured VTG was
performed to explain the change between the measured VTG between baseline and post
weight loss intervention. The change in the measured VTG was significantly and
negatively associated with the change in the WC (p=0.008), even after controlling for
VO2 max and age. These results indicate that a reduction in the WC and consequently
central adiposity contributes significantly to the higher measured VTG values,
independently of VO2 max and age. These findings extend the results of previous
studies which reported inverse associations between lung function and measurements of
central adiposity such as the WC (29-33). Lazarus et al. indicated a negatively
association between FVC and WC in 1,235 adults of both genders. Additionally, Canoy
et al (29) using a large sample of 9,674 men and 11,876 women aged 45-79 years
concluded that abdominal fat deposition may play a role in the impairment of
This association between WC changes and measured VTG changes might be
explained by a variety of mechanisms. Abdominal fat deposition may directly impede
the descent of the diaphragm into the abdominal cavity, whereas fat deposition in the
chest wall may diminish rib cage movement and thoracic compliance, both of which
lead to restrictive respiration impairment (34). Other mechanisms have been suggested,
including the possibility that abdominal fat deposition leads to a redistribution of blood
to the thoracic compartment that reduces vital capacity (32). In addition, high amounts
of FM may be related to a greater degree of airway narrowing than would be expected
on the basis of reduced lung volume alone, although the mechanisms remain uncertain
(35). However, obesity is a complex disorder and the effects of excess adipose tissue on
pulmonary function may be influenced by the location of excess fat deposits as well as
by their extent.
C
ONCLUSIONAir-displacement plethysmography was used to assess changes in body
composition following a 16-month weight loss program. Taking into account the fact
that the subject’s “raw” BV is corrected according to the VTG, the present study
underscores the impact of using the predicted vs. measured VTG. This is to say the
%FM change using the measured VTG resulted in a decrease of 3.5 %FM vs. using the
predicted VTG which resulted in a decrease of 4.0 %FM over the course of the 16 month
program. Therefore, this study indicates that the measured and predicted VTG should not
be used interchangeably. An important predictor of the change in the measured VTG
could be attributed to changes in the WC, which is an indicator of central adiposity.
However, the underlying mechanisms of the role of central adiposity is unclear
R
EFERENCES1. Heymsfield, S., Allison, D., Wang, Z., Baumgartner, R. & Ross, R. (1998)
Evaluation of total and regional body composition, in: James, W. (Ed.) Handbook of obesity, pp. 41-77 (New York, Marcell Dekker).
2. Bosy-Westphal, A., Mast, M., Eichhorn, C. et al. (2003) Validation of
air-displacement plethysmography for estimation of body fat mass in healthy elderly subjects, Eur J Nutr, 42, 207-16.
3. Collins, M. A., Millard-Stafford, M. L., Sparling, P. B. et al. (1999) Evaluation
of the BOD POD for assessing body fat in collegiate football players, Med Sci Sports Exerc, 31, 1350-6.
4. Fields, D. A., Wilson, G. D., Gladden, L. B. et al. (2001) Comparison of the
BOD POD with the four-compartment model in adult females, Med Sci Sports Exerc, 33, 1605-10.
5. Levenhagen, D. K., Borel, M. J., Welch, D. C. et al. (1999) A comparison of air
displacement plethysmography with three other techniques to determine body fat in healthy adults, JPEN J Parenter Enteral Nutr, 23, 293-9.
6. Millard-Stafford, M. L., Collins, M. A., Evans, E. M. et al. (2001) Use of air
displacement plethysmography for estimating body fat in a four-component model, Med Sci Sports Exerc, 33, 1311-7.
7. Miyatake, N., Nonaka, K. & Fujii, M. (1999) A new air displacement
plethysmograph for the determination of Japanese body composition, Diabetes Obes Metab, 1, 347-51.
8. Nunez, C., Kovera, A. J., Pietrobelli, A. et al. (1999) Body composition in
children and adults by air displacement plethysmography, Eur J Clin Nutr, 53, 382-7.
9. Sardinha, L. B., Lohman, T. G., Teixeira, P. J., Guedes, D. P. & Going, S. B. (1998) Comparison of air displacement plethysmography with dual-energy X-ray absorptiometry and 3 field methods for estimating body composition in middle-aged men, Am J Clin Nutr, 68, 786-93.
10. Silva, A. M., Minderico, C. S., Teixeira, P. J., Pietrobelli, A. & Sardinha, L. B. (2006) Body fat measurement in adolescent athletes: multicompartment
molecular model comparison, Eur J Clin Nutr.
11. Wagner, D. R., Heyward, V. H. & Gibson, A. L. (2000) Validation of air
displacement plethysmography for assessing body composition, Med Sci Sports Exerc, 32, 1339-44.
12. Going, S. B. (2005) Hydrodebsitometry and Air Displacement
Plethysmography, in: Heymsfield, S. B., Lohman, T. G., Wang, Z. M. & Going, S. B. (Eds.) Human body composition, pp. 17-33 (Champaign, IL, Human Kinetics Publishers).
13. Fields, D. A., Goran, M. I. & McCrory, M. A. (2002) Body-composition
assessment via air-displacement plethysmography in adults and children: a review, Am J Clin Nutr, 75, 453-67.
14. Ball, S. D. (2005) Interdevice variability in percent fat estimates using the BOD
POD, Eur J Clin Nutr, 59, 996-1001.
15. Fields, D. A., Hunter, G. R. & Goran, M. I. (2000) Validation of the BOD POD
16. Dempster, P. & Aitkens, S. (1995) A new air displacement method for the determination of human body composition, Medicine and Science in Sports and Exercise, 27, 1692-1697.
17. Dubois, A. B., Botelho, S. Y., Bedell, G. N., Marshall, R. & Comroe, J. H., Jr. (1956) A rapid plethysmographic method for measuring thoracic gas volume: a comparison with a nitrogen washout method for measuring functional residual capacity in normal subjects, J Clin Invest, 35, 322-6.
18. Crapo, R. O., Morris, A. H., Clayton, P. D. & Nixon, C. R. (1982) Lung
volumes in healthy nonsmoking adults, Bull Eur Physiopathol Respir, 18, 419-25.
19. Demerath, E. W., Guo, S. S., Chumlea, W. C. et al. (2002) Comparison of
percent body fat estimates using air displacement plethysmography and hydrodensitometry in adults and children, Int J Obes Relat Metab Disord, 26, 389-97.
20. McCrory, M. A., Mole, P. A., Gomez, T. D., Dewey, K. G. & Bernauer, E. M.
(1998) Body composition by air-displacement plethysmography by using predicted and measured thoracic gas volumes, J Appl Physiol, 84, 1475-9. 21. Refsum, H. E., Holter, P. H., Lovig, T., Haffner, J. F. & Stadaas, J. O. (1990)
Pulmonary function and energy expenditure after marked weight loss in obese women: observations before and one year after gastric banding, Int J Obes, 14, 175-83.
22. Teixeira, P. J., Palmeira, A. L., Branco, T. L. et al. (2004) Who will lose weight?
A reexamination of predictors of weight loss in women, Int J Behav Nutr Phys Act, 1, 12.
23. Wannamethee, S. G., Shaper, A. G. & Whincup, P. H. (2005) Body fat
distribution, body composition, and respiratory function in elderly men, Am J Clin Nutr, 82, 996-1003.
24. Teixeira, P. J., Going, S. B., Houtkooper, L. B. et al. (2004) Pretreatment
predictors of attrition and successful weight management in women, Int J Obes Relat Metab Disord, 28, 1124-33.
25. Lohman, T. G., Roche, A. F. & Martorell, R. (1988) Anthropometric
standardization reference manual (Champaign, IL, Human Kinetics Publishers).
26. McCrory, M. A., Gomez, T. D., Bernauer, E. M. & Molé, P. A. (1995)
Evaluation of a new air displacement plethysmograph for measuring human body composition, Medicine and Science in Sports and Exercise, 27, 1686-1691.
27. Siri, W. E. (1961) Body composition from fluid spaces and density: Analysis of
method, in: Henschel, A. (Ed.) Techniques for measuring body composition, pp. 223-244 (Washington, DC, National Academy of Sciences).
28. Balke, B. & Ware, R. W. (1959) An experimental study of physical fitness of
Air Force personnel, U S Armed Forces Med J, 10, 875-88.
29. Canoy, D., Luben, R., Welch, A. et al. (2004) Abdominal obesity and respiratory
function in men and women in the EPIC-Norfolk Study, United Kingdom, Am J Epidemiol, 159, 1140-9.
30. Cotes, J. E., Chinn, D. J. & Reed, J. W. (2001) Body mass, fat percentage, and fat free mass as reference variables for lung function: effects on terms for age and sex, Thorax, 56, 839-44.
32. Harik-Khan, R. I., Wise, R. A. & Fleg, J. L. (2001) The effect of gender on the relationship between body fat distribution and lung function, J Clin Epidemiol, 54, 399-406.
33. Lazarus, R., Gore, C. J., Booth, M. & Owen, N. (1998) Effects of body
composition and fat distribution on ventilatory function in adults, Am J Clin Nutr, 68, 35-41.
34. Maiolo, C., Mohamed, E. I. & Carbonelli, M. G. (2003) Body composition and
respiratory function, Acta Diabetol, 40 Suppl 1, S32-8.
35. King, G. G., Brown, N. J., Diba, C. et al. (2005) The effects of body weight on