Vol. 33, No. 04, pp. 851 - 861, October - December, 2016 dx.doi.org/10.1590/0104-6632.20160334s20150126
EVALUATION OF THE TREATABILITY OF
MUNICIPAL WASTE LANDFILL LEACHATE IN A
SBR AND BY COAGULATION-FLOCCULATION
ON A BENCH SCALE
E. Fleck
2*, A. G. Gewehr
1, L. F. A. Cybis
1, G. R. Gehling
1and V. B. Juliano
11Instituto de Pesquisas Hidráulicas, Universidade Federal do Rio Grande do Sul,
9500, Bento Gonçalves Av. Zip Code 91501-970, Porto Alegre - RS, Brazil.
2Instituto de Pesquisas Hidráulicas, Universidade Federal do RioGrande do Sul,
Av. Azenha 631, S. 42, CEP: 90160-001, Porto Alegre - RS, Brazil. Phone: +55 (51) 3289.69.85, Fax: +55 (51) 3219.41.35
E-mail: [email protected]
(Submitted: November 30, 2014 ; Revised: July 29, 2015 ; Accepted: July 30, 2015)
Abstract - This article describes bench scale sequential, biological and coagulation-flocculation treatment of mature leachate for the removal of nitrogen and biodegradable and recalcitrant carbonaceous material. The biological stage was conducted on two SBRs, one of which inoculated with nitrifying sludge, another without an inoculum, for 152 and 133 days, respectively. The coagulation-flocculation stage used four coagulants at different doses and pH adjustments. The treatment conducted on the inoculated SBR when a pH control was used produced mean removals of BOD5, COD and TKN of 69.6%, 38.5% and 51.6%, respectively, and
practically complete denitrification. Coagulation-flocculation applied to the effluent of the inoculated biological reactor showed a superior effectiveness of the ferric coagulants, when the pH was adjusted to close to 6.0, producing removals of turbidity, COD and true color close to 95%, 78% and 92%, respectively.
Keywords:Leachate; Sequential batch reactor; Nitrification; Coagulation; Flocculation.
INTRODUCTION
Despite more than forty years of research efforts, the treatment of leachates is still a complex require-ment for municipal solid waste landfill operators. During this period, several research studies were performed to experiment with different technological arrangements for effluent treatment to condition it to the standards for emission into surface water bodies. However, few publications have reported successful apparatus for this task and, when successful, gener-ally come up against the issue of high costs asso-ciated with the treatments. It is now considered that the effective treatment of leachates is a combination of biological processes allocated to the simultaneous
removal of biodegradable carbonaceous material and nitrogen, and physicochemical processes used to
remove recalcitrant COD (Li et al., 2009).
Sequential batch reactors (SBR) are a variation of the activated sludge process in which various stages of treatment, such as aerobic process, anoxic metabo-lism and settling occur sequentially in a single versa-tile tank. The technology which originated in
re-search done at the beginning of the 20th Century has
852 E. Fleck, A. G. Gewehr, L. F. A. Cybis, G. R. Gehling and V. B. Juliano
five phases (USEPA, 1993): (a) filling, with or with-out mixing and aeration; (b) reaction, usually with mixing and aeration; (c) sedimentation, with a sludge and supernatant separation phase in which the SBR operated as a secondary settler; (d) emptying; (e) resting, with or without mixing and aeration.
The treatment of leachates using SBRs is based on the generation of an initial aerobic phase in which, after heterotrophic organisms consume part of the biodegradable COD, the autotrophic fraction will have the opportunity of oxidizing ammoniacal nitrogen, converting it into nitrites and nitrates. Then an anoxic phase is established in which heterotrophic organisms will use the oxidized forms of nitrogen as electron acceptors in the oxidation of the remaining biodegradable carbonaceous material, converting them into molecular nitrogen gas. According to Aziz
et al. (2013) SBRs have the flexibility needed for these successive stages to take place satisfactorily. The successive nitrogen transformation processes are called, respectively, nitrification and denitrification. Nitrification stoichiometry is presented by Metcalf and Eddy (2003):
1st Phase: Conversion of ammonia to nitrite (ni-tritation)
4 2 3
5 7 2 2 2 2 3
55NH 76O 109HCO
C H O N 54NO 57H O 104H CO
+ −
−
+ + →
+ + + (1)
2nd Phase: Conversion of nitrite to nitrate (ni-tratation)
2 4 2 3 3
2 5 7 2 2 3
400NO NH 4H CO HCO
195O C H O N 3H O 400NO
− + −
−
+ + +
+ → + + (2)
Frick and Richard (1985) exemplify the stoichi-ometry to reduce nitrate to molecular nitrogen (deni-trification), using acetic acid as a carbonaceous source:
3 3
2 2 2
5CH COOH 8NO
4N 10CO 6H O 8OH
−
−
+ →
+ + +
(3)
Several articles describe experiments aimed at re-moving nitrogen contained in leachate. Table 1 shows some of these results. The coagulation-flocculation process can be considered to be the destabilization and agglomeration of suspended and colloidal parti-cles present in the liquid by adding a chemical agent (coagulant). The flocs formed must be separated from the supernatant by physical processes. The great majority of colloidal particles dispersed in wa-ter present a negative charge, thus these particles repel each other mutually before they can collide (Alley, 2007). The signal and magnitude of the pri-mary charge of colloids are often affected by the pH and by the ionic content of the aqueous phase (We-ber, 1972). Because of their masses and electrical charges, their natural sedimentation times are ex-tremely high, and no particle aggregation occurs. When an electrolyte with an opposite charge to that of the colloids is employed, a process with distinct phases occurs: (a) hydrolysis of the coagulants and destabilization of the particles present in the suspen-sion; (b) precipitation and formation of chemical compounds that polymerize, becoming large three-dimensional chains with active extremities; (c) ad-sorption of the polymer chains on the colloid surface by linkage to their empty sites, leaving the extremi-ties extended into water; (d) mutual adsorption be-tween colloids: the extremities mentioned may ad-here to other colloids that have empty sites, forming
Table 1: Results reported in aerobic treatment aiming at removing leachate TKN.
Author Conditions Results
Tengrui et al. (2007)
Old leachate with 1100 mgNH4-N.L-1,
applied at 0.51 kgN.m-3.d-1 in an aerated biofilter maintained at 30-33 ºC, with pH maintained at 7.4-8.6, HRT: 9h.
TKN removal of 99%
Spagni and Libelli (2009)
Old leachate, with 1319-1530 mgTKN.L-1
and 2623-2055 mgCOD.L-1 applied in a laboratory-scale SBR
Nitrification and nitrogen removal were usually higher than 98% and 95%, respectively, whereas COD removal was approximately 20–30%;
0.117-0.3 mgN.mgMLVSS-1.d-1
He et al. (2007) Leachate with 2900 mgNH4-N.L
-1
and 220
mgCOD. L-1 applied in a 150 L SBR 0.0690-0.2843 gTKN.gMLVSS -1
.d-1
Liang and Liu (2006)
Leachate with 1800-1300 mgTKN.L-1 and 1500-16,000 mgCOD.L-1 applied at a rate of 0.2-1.0 kgN.m-3.d-1 in a aerobic biological reactor
spongy masses of suspended particles linked by poly-mer chains; (e) sweeping action: when they sedi-ment, the clots entrain in their path new particles that are incorporated into the microflocs that are forming. According to Letterman (1999) humic substances have a negative electrical charge, present as com-pounds with low to medium molecular weight. It is therefore predictable that the fractions with higher molecular weight, which present colloidal behavior, be removed by coagulation-flocculation.
Historical attempts of leachate treatment using coagulants commonly employed for sewage and water, such as aluminum sulfate, have not produced
satisfactory results. However, experiments using polyvalent cationic coagulants have given good re-sults, as reported in Table 2.
METHODS
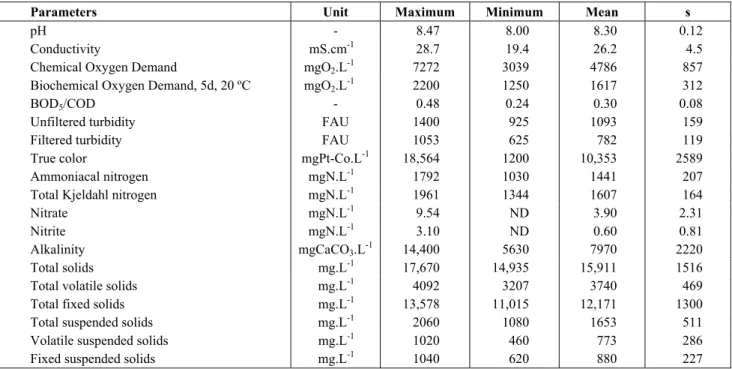
The leachate used in the experiment was from the Central de Resíduos do Recreio (The Recreio Waste Plant), in Minas do Leão, Brazil, a landfill that has operated for over ten years and produces mature leachate. The characteristics determined for the leach-ate used in the experiment are shown in Table 3.
Table 2: Reported experiences of leachate treatment using coagulation-flocculation.
Author Leachate tested Coagulant / Dosage pH
adjustment
COD removal Wang et al. (2002) raw FeCl3; 0.34 gFe+3.L-1 7.6 24%
Lin and Chang (2000) old 0.2 gPACL-1 5.0 70% Guo et al. (2010) pre-treated FeCl3; 0.28 gFe+3.L-1 5.0 36%
Castrillón et al. (2010) raw 4.0 gPAC.L-1 6.5 34% Castrillón et al. (2010) raw FeCl3; 0.59 gFe+3.L-1 5.0 73%
Rui et al. (2012) old FeCl3; 1.03 gFe+3.L-1 7.0 37%
Samadi et al. (2010) raw Fe2(SO4)3; 0.42 gFe +3
.L-1 12.0 71% Pi et al. (2009) air stripping effluent FeCl3; 0.21 gFe+3.L-1 9.0 37%
Tatsi et al. (2003) partially stabilized by recirculation
FeCl3; 0.69 gFe+3.L-1 10.0 80%
Table 3: Characteristics of the raw leachate used in the experiments.
Parameters Unit Maximum Minimum Mean s
pH - 8.47 8.00 8.30 0.12
Conductivity mS.cm-1 28.7 19.4 26.2 4.5
Chemical Oxygen Demand mgO2.L -1
7272 3039 4786 857 Biochemical Oxygen Demand, 5d, 20 ºC mgO2.L-1 2200 1250 1617 312
BOD5/COD - 0.48 0.24 0.30 0.08
Unfiltered turbidity FAU 1400 925 1093 159 Filtered turbidity FAU 1053 625 782 119 True color mgPt-Co.L-1 18,564 1200 10,353 2589
Ammoniacal nitrogen mgN.L-1 1792 1030 1441 207 Total Kjeldahl nitrogen mgN.L-1 1961 1344 1607 164
Nitrate mgN.L-1 9.54 ND 3.90 2.31
Nitrite mgN.L-1 3.10 ND 0.60 0.81
Alkalinity mgCaCO3.L-1 14,400 5630 7970 2220
Total solids mg.L-1 17,670 14,935 15,911 1516 Total volatile solids mg.L-1 4092 3207 3740 469 Total fixed solids mg.L-1 13,578 11,015 12,171 1300 Total suspended solids mg.L-1 2060 1080 1653 511
Volatile suspended solids mg.L-1 1020 460 773 286 Fixed suspended solids mg.L-1 1040 620 880 227
854 E. Fleck, A. G. Gewehr, L. F. A. Cybis, G. R. Gehling and V. B. Juliano
Two identical cylindrical 6 L SBRs made of acrylic were used, with an inner diameter of 30 cm and inner height of 15.5 cm. The reactor called SBR1 operated with sludge generated and enriched by the aeration of the leachate itself, while reactor SBR2 was inoculated with sludge with a nitrifying characteristic from a sewage treatment plant, slowly acclimated to the leachate. In order to ensure that the effluent was mixed with the biomass, the SBRs were equipped with rotary systems comprising axes with propellers coupled to motors. The air supply for each reactor came from a porous stone diffuser, of the type used in domestic aquariums, fixed at the bottom of the reactors and connected to pumps with a man-ual adjustment of air flow. Raw leachate feed and effluent removal were performed through peristaltic pumps connected to the reactors by hoses. Agitation, aeration, influent feeding and effluent removal were performed manually through taps installed in the reactors. Reactors SBR1 and SBR2 were operated, respectively, for 152 and 133 days.
For acclimation to leachate and sludge enrich-ment, both reactors operated in 24-hour cycles, di-vided into 22.25 h of agitation and aeration, 1.5 h of sedimentation and 0.25 h of effluent removal. In fact, the SBRs operated as a semi-batch system, with in-termittent leachate feedings occurred throughout each cycle every 2.5 to 3.0 hours.
When the mixed liquors reached 3000
mgMLVSS.L-1, the anoxic phase was added to the
cycles, switching off the aeration and mixture mainte-nance. Thus, the reactors operated on a new total cycle comprising 12.25 h of aeration with mixing, 10.25 h of mixing without aeration, 1.25 h of sedi-mentation and 0.25 h of effluent removal. The sys-tem was fed in eight equal aliquots throughout the reaction period, so that the hydraulic retention time was kept at 2 d, therefore within the 1.0-3.2 d range
recommended by Kurniawan et al. (2010). At the
beginning of the anoxic phase, acetate was added as an external source of carbon, observing the stoichi-ometry of 6.071 milligrams of sodium acetate trihy-drate per milligram of nitrogen to be denitrified. The relative lack of phosphorus was supplied by adding potassium monohydrogen phosphate, so as to keep,
at the beginning of each cycle, the BOD5:N:P ratio
close to 100:5:1. The cellular retention time was kept at 25 d by daily removal of a 4% fraction of the mixed liquor.
The SBR temperature was kept at 21-25 ºC throughout the experiment. Since during the opera-tion period an increase in the pH was observed up to the level of 9.0-9.2 in the aerobic phase, an unex-pected phenomenon, in an established number of
operational cycles concentrated sulphuric acid was added manually to adjust the pH to close to 7.2, as a strategy to avoid inhibiting the nitrifying organisms. There was no effective control of dissolved oxygen concentrations in the reactors, but they were regu-larly monitored, and in the aerobic phases the concentrations were observed to be between 2.0-4.5
mgO2.L-1.
The parameters monitored during the biological phase were temperature, pH, dissolved oxygen, con-ductivity, color, turbidity, BOD5, COD, nitrogen series (organic, ammoniacal, nitrate and nitrite), alkalinity and solids series. All determinations used methodologies standardized by APHA/AWWA/WEF (1999).
The coagulation-flocculation tests were carried out on jar-test equipment with adjustable angular velocity mixers, with the simultaneous use to six cups with a capacity of 2 L. Different coagulants were tested, as follows:
Aluminum polychloride (PAC); concentration
of active material: 16.5-17.5% of Al2O3 (in mass);
Ferric chloride; concentration of active matter:
38% FeCl3 (in mass, minimum);
Ferric sulphate (oxidized ferrous sulphate);
con-centration of active material: 17% of Fe+3 (in mass);
Tannin: commercial name: Tanfloc SG.
The coagulation-flocculation tests occurred in suc-cessive stages; in each of them an attempt was made to check the removal efficiencies as dosages were modified and pH adjusted. In this sense, for each coagulant the operation was performed in four stages: (1) determination of the optimum dosage, (2) deter-mination of the optimum adjustment of pH, (3) de-termination, by fine adjustment, of the optimum dosage, (4) determination, by fine adjustment, of the optimum pH. A last stage (5), operated with repeti-tions, and complementary determinations were per-formed.
The ranges of dosages and pH adjustments ini-tially tested, as well as the times and gradients of mixtures adopted, were fixed based on coagulation-flocculation experiments previously carried out by the authors, using raw leachates. Table 4 summarizes the values of the test variables used.
Table 4: Values of the test variables used in the coagulation-flocculation tests.
Variable / Coagulant PAC Ferric Chloride Ferric Sulphate Tannin
Effluent Initial Characteristics
Turbidity: 675-683 FAU;
COD: 2672-2987 mgO2.L
-1
;
Color: 9400-11,575 mgPt-Co.L-1
Turbidity: 725-1044 FAU;
COD: 2761-3168 mgO2.L
-1
;
Color: 11,100-12,100 mgPt-Co. L-1
Turbidity: 667-800 FAU;
COD: 2870-3244 mgO2.L
-1
;
Color: 9400-11,575 mgPt-Co.L-1
Turbidity: 675-750 FAU;
COD: 2844-3168 mgO2.L
-1
;
Color: 9400-11,475 mgPt-Co. L-1
Fast mixing time (min)*
0.5, 1, 2, 3 , 4, 6
Fast mixing gradient (s-1)*
180, 350, 425, 600, 950, 1200
Slow mixing time (min)*
5, 10, 15, 20, 30, 45
Slow mixing gradient
(s-1)* 10, 20, 40, 60, 80, 100
Initial pH (first tests)**
5.0, 5.5, 6.0, 6.5, 7.0, 7.5, 8.0, 8.1, 8.5, 9.0, 9.5, 10.0
5.0, 5.5, 6.0, 6.6, 7.0, 7.5, 8.0, 8.5, 8.9, 9.0, 9.5, 10.0
5.0, 5.5, 6.0, 6.6, 7.0, 7.5, 8.0, 8.5, 8.6, 9.0, 9.5, 10.0
5.0, 5.5, 6.0, 7.0, 7.2, 7.5, 8.0, 8.5, 8.9, 9.0, 9.5, 10.0
Dosages (first tests)**
0.50, 1.00, 1.50, 2.00, 3.00, 4.00 g Al2O3.L-1
0.17, 0.34, 0.69, 1.03, 1.38, 1.72 g Fe+3.L-1
0.20, 0.50, 0.80, 1.00, 1.50, 2.00 g Fe+3.L-1
1.00, 2.00, 3.00, 4.00, 6.00, 8.00 g.L-1
Initial pH (final tests)**
6.4, 6.7, 7.0, 7.3, 7.5, 7.8
5.7, 5.9, 6.1, 6.3, 6.5, 6.7
5.4, 5.6, 5.8, 6.0, 6.2, 6.4
5.3, 5.5, 5.7, 5.9, 6.1, 6.3
Dosages (final tests)**
0.90, 1.10, 1.30, 1.50, 1.70, 1.90 g Al2O3.L-1
0.55, 0.62, 0.69, 0.76,
0.83, 0.90 g Fe+3.L-1 0.80, 0.90, 1.00, 1.10, 1.20, 1.30 g Fe+3.L-1 6.00, 7.00, 8.00, 9.00, 10.00, 12.00 g.L-1
*preliminary tests
**definitive tests using quick mixing for 2 minutes at 250 s-1, slow mixing for 20 minutes at 60 s-1 and 2-hour sedimentation time
leachate and adopt a very efficient process down-stream from coagulation-flocculation for solid-liquid separation.
RESULTS
During the periods of operation, the MLVSS con-centrations in mixed liquors were monitored three times a week. The SBR1 and SBR2 reactors were operated, respectively, after a 30-day phase of accli-mation and enrichment with volatile suspended solids concentrations of 1220-3667 and 2319-4882
MLVSS.L-1.
The SBR1 reactor showed inconsistent nitrification, despite practically total denitrification, producing an average of nitrogen removals over the cycles of approximately 17%, with a minimum of 1.5% and maximum of 30.9% (when operating with a pH con-trol). On the other hand, the SBR2 reactor operated with much more consistent nitrification, especially
856 E. Fleck, A. G. Gewehr, L. F. A. Cybis, G. R. Gehling and V. B. Juliano
0 500 1000 1500 2000 2500
1 7 20 27 33 40 47 54 61 68 77 84 91 98 105 112 119 126 133 140 147
Cycle
mg
TK
N/L
-100% -90% -80% -70% -60% -50% -40% -30% -20% -10% 0% 10% 20% 30% 40% TKN
Rem
o
va
l Ef
ic
ie
n
cy
Affluent TKN Effluent TKN N Removal
Figure 1: Nitrification efficiency in SBR1 during the monitored cycles.
0 500 1000 1500 2000 2500
12 16 22 27 31 38 45 52 59 66 73 80 87 94 101 108 115 122 129
Cycle
mg
TK
N/
L
-180% -170% -160% -150% -140% -130% -120% -110% -100% -90% -80% -70% -60% -50% -40% -30% -20% -10% 0% 10% 20% 30% 40% 50% 60% 70%
T
K
N
Rem
o
va
l E
fic
ienc
y
Affluent TKN Effluent TKN N Removal
Figure 2: Nitrification efficiency in SBR2 during the monitored cycles.
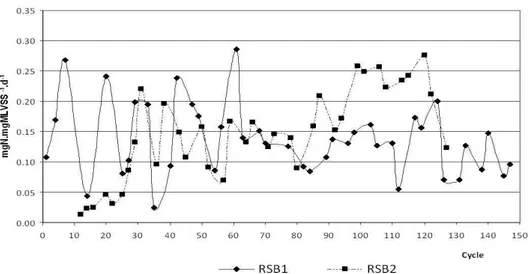
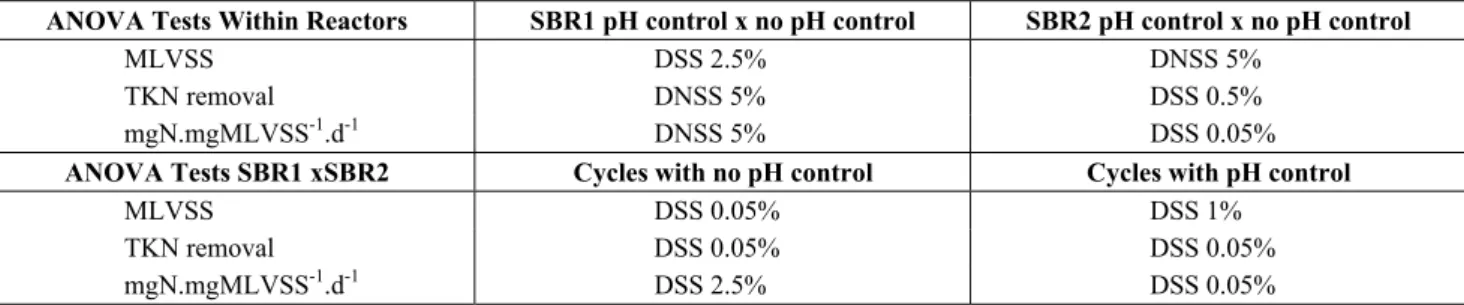
Results obtained from the monitoring of MLVSS, KTN removal efficiencies and removal rates
(mgN.mgMLVSS-1.d-1) for the reactors were
com-pared using analysis of variance (1) for the periods with and without pH control within the same reactor and (2) for equivalent periods with and without pH control of the reactors. The results of the ANOVA are shown in Table 5.
The pH control raised the medium concentra-tions of MLVSS in both reactors, but more promi-nently in SBR1, although the SBR2 reactor, inocu-lated with sludge, always presented higher concen-trations of biomass present. The effect of pH con-trol on TKN removal efficiency and removal rate
(mgN.mgMLVSS-1.d-1) in SBR2 was more intense
than in SBR1, although the removals and rates over the cycles without pH control were always superior in SBR2.
Although the removal rate presented relatively close means if the full periods of reactor operation were considered, in the cycles with pH control the SBR2 reactor presented a mean of 0.244 mgN.
mgMLVSS-1.d-1, double the mean of 0.122 mgN.
mgMLVSS-1.d-1 found for SBR1. During the
respec-tive periods of pH control, mean concentrations of volatile suspended solids seen in the mixed liquors were slightly different in SBR1 and SBR2 (3010 and
3466 mgMLVSS.L-1, respectively). The differences
between the mean observed nitrification efficiencies, respectively 22.3% and 52% during the period, are ascribed mainly to the differences between the bio-logical oxidation rates of nitrogen found in the reac-tors. Effluent alkalinity was monitored over the opera-tion times, recording for the effluents of both reac-tors, as expected, consumptions during aeration peri-ods and elevations in the anoxic phase. Logically, in the cycles in which acid was added to the reactors, there was an elevation of the alkalinity consumption.
Both reactors produced significant carbonaceous material removals during the operation periods with
sludge age control. The SBR1 reactor, between
cy-cles 20 and 146, presented a mean removal of BOD5
and COD of 42.5% and 31.1%, respectively, while for reactor SBR2 these means were 61.8% and 27.7%. During the pH control phase, which coincided with
high stability, the SBR2 reactor produced mean BOD5
and COD removals of 69.6% and 38.5%, respec-tively. These results, together with ammoniacal nitro-gen removals on the order of 50%, show the good potential for treating leachates with sequential batch reactors.
Reactor SBR2, which had a more stable operation,
produced effluents with means of 3212 mgCOD.L-1
and 560 mgBDO5.L-1. During the stable phase, with
pH control, the mean concentration of effluent total
nitrogen (all forms) was 781 mgN.L-1. The mean
lowering of the BOD5/COD ratio of the reactor efflu-ents was 0.07.
The average removal rate for the SBR2 reactor during the pH control phase was verified to be 0.24
mgN.mgMLVSS-1.d-1, having reached a maximum of
0.28. These results come very close to those obtained
by Spagni and Libelli (2009) and He et al. (2007),
indicating that high removals of approximately 90% or more could probably be derived from the eleva-tion of the HRT.
The tests using coagulation-flocculation employed effluent leachate from the SBR2 reactor, with a COD
ranging between 2601 and 3244 mgO2.L-1. In a first
stage, different dosages of the four coagulants used were tested. The pH of the leachates was initially adjusted to 6.0 for assays with inorganic coagulants, and the original pH of the effluent (7.2) was main-tained for the tests with tannin. The cycles used a
quick mixing for 2 minutes at 150 rpm (g ≈ 250 s-1);
slow mixing for 20 minutes at 60 rpm (g ≈ 60 s-1)
and a 2-hour sedimentation time: those were the best values found in preliminary tests. Table 6 summarizes the dosages used and the best results obtained in that stage.
Table 5: ANOVA results for MLVSS concentration, KTN removal efficiencies and removal rates (mgN.mgMLVSS-1.d-1).
ANOVA Tests Within Reactors SBR1 pH control x no pH control SBR2 pH control x no pH control
MLVSS DSS 2.5% DNSS 5%
TKN removal DNSS 5% DSS 0.5%
mgN.mgMLVSS-1.d-1 DNSS 5% DSS 0.05% ANOVA Tests SBR1 xSBR2 Cycles with no pH control Cycles with pH control
MLVSS DSS 0.05% DSS 1%
TKN removal DSS 0.05% DSS 0.05%
mgN.mgMLVSS-1.d-1 DSS 2.5% DSS 0.05%
858 E. Fleck, A. G. Gewehr, L. F. A. Cybis, G. R. Gehling and V. B. Juliano
Table 6: Results obtained during the phase of optimal dosage determination.
Coagulant PAC Ferric Chloride Ferric Sulphate Tannin
Dosages used 0.50, 1.00, 1.50, 2.00, 3.00, 4.00 g Al2O3.L
-1
0.17, 0.34, 0.69, 1.03, 1.38, 1.72 g Fe+3.L-1
0.20, 0.50, 0.80, 1.00, 1.50, 2.00 g Fe+3.L-1
1.00, 2.00, 3.00, 4.00, 6.00, 8.00 g.L-1
Optimal dosage found 1.50gAl2O3. L-1 0.69gFe+3.L-1 1.00gFe+3.L-1 8.00g.L-1
Color removal (%) 92.33 90.54 96.99 81.83
Turbidity removal (%) 96.15 94.62 97.78 90.07
COD removal (%) 74.66 82.20 84.95 16.95
Final pH 3.8 3.41 4.45 6.17
Final Color (mgPt-Co.L-1) 721 1050 283 2017
Final turbidity (FAU) 26 39 15 72
Final COD (mgO2.L -1
) 678 564 432 2631
* results refer to the supernatant obtained from the best coagulant dosage used; ** turbidity was determined after filtration.
In the second stage, the coagulants were applied at the previously determined optimal dosage to sam-ples of leachate with prior adjustments of pH be-tween 5.0 and 10.0, in 0.5 unit increments, and to samples without pH adjustment, with a total of 12 different pH values tested for each coagulant used. Optimizations of the removal were observed at pH values of 7.0, 6.5, 6.0 and 6.0, respectively for PAC, ferric chloride, ferric sulphate and tannin. Table 7 summarizes the results obtained in this stage.
During the third stage, six dosages around those determined as optimal in the first stage were used for each coagulant, and the leachates underwent pH adjustments according to the best results of the previ-ously described stage. Optimizations were observed in the removal (color, COD and turbidity) for the
dosages of 1.30 gAl2O3.L-1 (PAC), 0.83 gFe+3.L-1
(ferric chloride) and 0.90 mgFe+3.L-1 (ferric sulphate).
In the specific case of tannin, as in the initial stage, the highest dosage gave the best results; in the
pre-sent stage the dosages were extended to 12.00 g.L-1,
and a superior performance was obtained with this higher dosage.
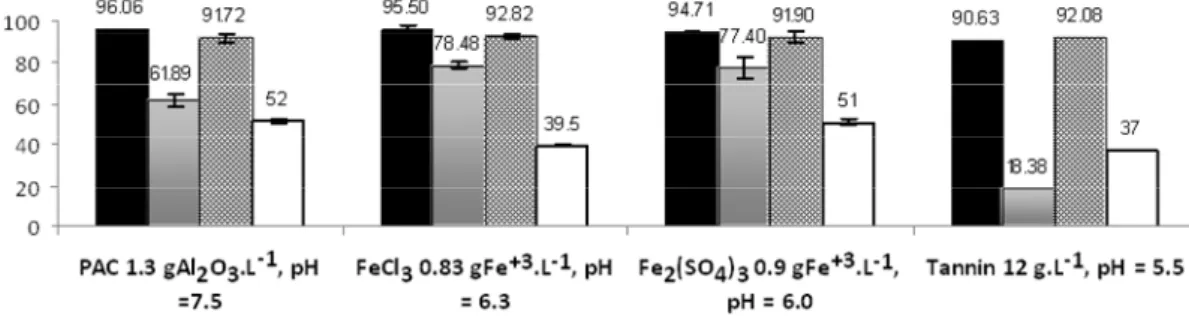
During the fourth stage, the best dosages deter-mined in the previous stage were adopted; and, for each coagulant, six pH adjustments close to those considered to be optimal in the second stage were tested. The adjustments that presented the best
re-moval, and thus were considered ideal, were 7.5 for PAC, 6.3 for ferric chloride, 6.0 for ferric sulphate, and 5.5 for tannin. Some discrepancies between the efficiencies found between the third and fourth stages are due to impossibility of using factorial de-sign in this series of experiments. The assays were repeated. Once this stage was over, the Brazilian market prices of the coagulants were evaluated and their performances were compared, as illustrated in Figure 4.
The results presented in Figure 4 should be inter-preted with caution, since they come from experi-ments conducted on a bench scale, and may not be reproduced in a full scale system.
It was observed that the four coagulants used had a very similar performance as regards color and tur-bidity removal. However, for tannin, there was poorer COD removal, whereas ferric sulphate and ferric chloride had COD removals close to 80%, and were found to be the coagulants with the best overall performance.
The optimized tests using ferric chloride and fer-ric sulphate produced effluents with a COD between
432 and 564 mgO2.L-1, true color between 283 and
1050 and turbidity between 15 and 39 FAU. BOD5
determinations for leachates treated with the ideal doses of PAC and ferric chloride produced the
fol-lowing results: 80 and 100 mgO2.L-1, respectively.
Table 7: Results obtained during the phase of optimal pH determination.
Coagulant PAC Ferric Chloride Ferric sulphate Tannin
Dosages used 1.50g Al2O3. L-1 0.69gFe+3.L-1 1.00gFe+3.L-1 8.00g.L-1
Optimal pH found 7.0 6.5 6.0 6.0
Color removal (%) 88.97 95.25 97.36 88.30
Turbidity removal (%) 94.88 97.89 93.25 93.19
COD removal (%) 52.75 78.56 84.90 19.62
Final pH 4.49 5.19 3.51 6.25
Final color (mgPt-Co.L-1) 1053 575 267 1100
Final turbidity (FAU) 35 22 45 46
Final COD (mgO2.L -1
) 1359 592 461 2286
Final pH
Figure 4: Summary of the results for coagulation – flocculation, using optimal pH dosages and adjustments for each coagulant, with repetition (except for tannin).
DISCUSSION
The elevation of the pH of the medium during the aerobic phase was the most important phenomenon observed during the SBR operation cycles. The nitri-fication requires alkalinity consumption, and, thus, conversely a drop in pH would be expected. Two causes can be suggested for this:
Dissolved carbon dioxide desorption in the
liquid medium, due to turbulence, which caused an imbalance of the CO2/H2CO3 system that is some-times responsible for the neutralization of part of the high alkalinity present in the leachate;
Hydrolysis of the organic nitrogen, which
con-sumes hydronium ions (H+).
The use of wastewater sludge with a nitrifying characteristic slowly acclimated to the leachate proved to be effective, because SBR2 reactor inoculum pro-duced a sludge with greater yield during the nitrifica-tion phase, whereas the SBR1 reactor, in which bac-terial cells originally present in the raw leachate were the inoculum, presented much less consistent nitrifi-cation, which shows a quicker and more effective start-up when a well-selected inoculum is used.
As expected, the coagulation-flocculation of leachates which have been previously treated bio-logically consumed smaller doses of coagulants com-pared to the coagulation of raw leachates, which
were the subject of preliminary studies that are not presented here. Although considered to be environ-mentally friendly, especially for producing biode-gradable sludges, tannin required high consumption for slightly lower COD removals than those obtained using inorganic coagulants.
Despite the results cited by Samadi (2010) and Tatsi (2003), in this experiment the removal of tur-bidity, color and COD decreased when using pH adjustments above neutral. COD removals obtained with the use of ferric coagulants were similar to those obtained by the last mentioned author, who used a dose about 20% lower than those that pro-vided the best results in our experiments.
860 E. Fleck, A. G. Gewehr, L. F. A. Cybis, G. R. Gehling and V. B. Juliano
best coagulants, the iron contents present in the final effluent may require a process for their removal downstream from coagulation-flocculation.
CONCLUSION
The biological reactors presented partial removal of the biodegradable carbonaceous material and ni-trogen present in the inflow. The reactor inoculated with nitrifying sludge, which operated more robustly and effectively during the nitrifying phase, produced removals of approximately half the concentration of all nitrogen present, which would require one more unit dedicated to nitrogen removal, such as an am-monia stripping tank, for instance, to meet the stand-ard level reached for emission in terms of nitrogen concentration.
In the coagulation-flocculation tests carried out, the coagulants presented similar color and turbidity removals. Using ferric chloride, removals of approxi-mately 92.8% and 95.5%, respectively, were ob-tained for true color and turbidity. The iron-based inorganic coagulants removed about 80% of the COD. The mean percentages of the sludge phase generated by these coagulants were 39.5-51%. The pH values of the leachate after coagulation-floccula-tion with ferric sulphate and ferric chloride were 3.6 and 3.1, respectively. This final pH range coincides with the range recommended to apply the Fenton Advanced Oxidation Process, which has been re-ported by researchers to be successful in removing refractory carbonaceous material from the leachates.
The removal of carbonaceous material obtained in the biological and physicochemical sequence can be considered to be very significant, especially if the removals obtained in the stable operation phase of the biological reactors and the performances of the ferric coagulants are considered jointly. The effluent from the combined biological treatment in SBR with coagulation-flocculation using ferric coagulants in the optimized dosages with pH adjustment showed
416-897 mgCOD.L-1, 873-1250 mgPt-Co.L-1 and
41-60 FAU.
NOMENCLATURE
APHA American Public Health Association
AWWA American Water Works Association
BOD5 Biochemical Oxygen Demand
in 5 days
COD Chemical Oxygen Demand
FAU Formazin Attenuation Unit
g: gradient
HRT Hydraulic Retention Time
MLVSS Mixed Liquor Volatile Suspended
Solids
MLVSS.L-1 mixed liquor volatile suspended solids
milligram per liter
PAC polyaluminum chloride
SBR Sequencial Batch Reactor
TSS Total Suspended Solids
TKN Total Kjeldahl Nitrogen
WEF Water Environment Federation
REFERENCES
Alley, E. R., Water Quality Control Handbook. McGraw-Hill, p. 848 (2007).
APHA, AWWA, WEF, American Public Health As-sociation, American Water Works AsAs-sociation, Water Environment Federation. Standard Methods for the Examination of Water and Wastewater. 21th Ed., Washington (1999).
Aziz, S. Q., Aziz, H. A., Mojiri, A., Bashir, M. J. K., Amr, S. S. A., Landfill leachate treatment using sequencing batch reactor (SBR) process: Limita-tion of operaLimita-tional parameters and performance. International Journal of Scientific Research in Knowledge, (IJSRK), 1(3), 34-43 (2013).
Castrillón, L., Nava, Y. F., Ulmanu, M., Anger, I., Marañón, E., Physico chemical and biological treatment of MSW landfill leachate. Waste Man-agement, 30, 228-235 (2010).
Frick, B. R., Richard, Y., Ergebnisse und erfahrungen mit der biologischen denitrifikation in einem was-serwerk. Vom Wasser, 64, 145-154 (1985). (In German).
Guo, J.-S., Abbas, A. A., Chen, Y. P., Liu, Z. P., Fang, F., Chen, P., Treatment of landfill leachate using a combined stripping, fenton, SBR, and co-agulation process. Journal of Hazardous Materials, 178, 699-705 (2010).
He, Y., Zhou, G., Zhao, Y., Nitrification with high nitrite accumulation for the treatmentof “old” landfill leachates. Environmental Engineering Sci-ence, 24(8), 1084-1094 (2007).
Kurniawan, T. A., Waihung, Lo., Chan, G., Sillanpaa, M. E. T., Biological processes for treatment of landfill leachate. Journal of Environmental Moni-toring, 12, 2032-2047 (2010).
Letterman, R. D., Water Quality and Treatment. McGraw-Hill, p. 1231 (1999).
of Hazardous Materials, 172, 408-415 (2009). Liang, Z., Liu, J.-X., Control factors of partial
ni-tritation for landfill leachate treatment. Journal of Environmental Sciences, 19, 523-529 (2007). Lin, C. Y., Chang, F. Y., Chang, C. H., Co-digestion
of leachate with septage using a UASB reactor. Bioresource Technology, 73, 175-178 (2000). Pi, K. W., Li, Z., Wan, D. J., Gao, L. X., Pretreatment
of municipal landfill leachate by a combined process. Process Safety and Environmental Pro-tection, 87, 191-196 (2009).
Rui, L. M., Daud, Z., Latif, A. A. A., Coagulation-flocculation in leachate treatment by using ferric chloride and alum as coagulant. International Jour-nal of Engineering Research and Applications, 2(4), 1929-1934 (2012).
Samadi, M. T., Saghi, M. H., Rahmani, A., Ha-sanvand, J., Rahimi, S., Shirzad Syboney, M., Hamadan landfill leachate treatment by coagula-tion-flocculation process. Iran. J. Environ. Health Sci. Eng., 7(3), 253-258 (2010).
Spagni, A., Marsili-Libelli, S., Nitrogen removal via nitrite in a sequencing batch reactor treating sani-tary landfill leachate. Bioresource Technology,
100, 609-614 (2009).
Tatsi, A. A., Zouboulis, A. I., Matis, K. A., Samaras, P., Coagulation-flocculation pretreatment of sani-tary landfill leachates. Chemosphere, 53, p. 737-744. (2003)
Tchobanoglous, G., Burton, L. F., Wastewater Engi-neering. Treatment, disposal, reuse. Metcalf & Eddy, Inc., 3rd Edition, Singapore, McGraw-Hill, p. 1334 (1991).
Tengrui, L., Al-Harbawi, A. F., Bo, L. M., Jun, Z., Long, X. Y., Characteristics of nitrogen removal from old landfill leachate by sequencing batch biofilm reactor. American Journal of Applied Sci-ences, 4(4), 211-214 (2007).
USEPA, United States Environmental Protection Agency, Cincinatti Manual. Nitrogen Control. Technology Transfer, p. 311 (1993).
Wang, Z.-P., Zhang, Z., Lin, Y.-J., Deng, N.-S., Tao, T., Zhuo, K., Landfill leachate treatment by a co-agulation–photooxidation process. Journal of Hazardous Materials, B95, p. 153-159 (2002). Weber, W. J. Jr., Physicochemical Processes for