Cost-Benefit
Analysis of a Regional System
for Vaccination
against Pneumonia,
Meningitis
Type B, and Typhoid Fever
PHILIP MUSGROVE~
In early 1989 PAHO began examining a proposal for a regional program fkaf would develop and disseminate vaccines of particular interest to ifs Member Countries. As part of that examination, a cost-benefit analysis was performed. That general analysis, presented here, sought to point up key facfors that would strongly influence whether or not the program’s
benefifs ou fweigked its costs.
The program’s two fundamental components, vaccine development and vaccine admin- istration, were evaluated separately. Using a discount rate (r) of lo%, lo-year vaccine developmenf costs were estimated at US$80.3 million in consfanf dollars. If was felt that enough people (at leasf 19.5 million a year) would be vaccinated so that the program would benefit from economies of scale. The total discounted number of vaccinations administered over a 20-year period was expected to be in the range of 400 to 506 million.
Using these figures, estimates were made of the maximum that could be spent on vaccine administrafion without exceeding anficipafed benefits. Considering only treatment costs saved through vaccination, assuming all sick people were treated, the ceiling cost for vac- cinafing one person against one target disease would be in the range of US$O.52-0.58.
Even if not all the sick were treated, however, the Regional Vaccine System (SIREVA) would still appear justified if the benefits per disease case prevented were found to average befween US$l,OOO and US$Z,OOO. Even so, if should be noted that these esfimafes are subject to a good deal of additional variation because of uncertainties regarding the worth of many elements evaluated-including fke costs of losf work time, disability, and mortal+--and because some of fke elements involved-suck as pain, sufjcering, and death-fall outside the purely economic realm.
A
lthough mass vaccination of vulner-able populations has been quite suc-
cessful at reducing communicable dis-
ease morbidity and mortality, we still
confront serious public health problems arising from diseases for which no ade- quate vaccines exist (2, 2). Either a vac-
cine has not been developed, there hav-
ing been only partial progress to date; or the existing vaccines are of limited effec- tiveness; or they are restricted to certain
‘Division of Human Resources, Technical Depart- ment for Latin America and the Caribbean, World Bank, Washington, D.C., U.S.A. (former Regional Advisor in Health Economics, Pan American Health Organization).
pathogenic serotypes and therefore would
not protect the populations exposed to
other serotypes; or they are too costly for mass application. In view of this situa- tion, the governments participating in the
World Children’s Conference held in
September 1990 proposed various mea-
sures including development of an “in-
fant vaccine” for safe early protection against a variety of diseases (3).
Independently, in early 1989 the Pan
American Health Organization began ex-
amining the prospects for undertaking a
Member Countries because of the high
morbidity and mortality they caused or
because of large expenditures needed to
treat their victims. This initiative, named the Regional Vaccine System (Sistema
Regional de Vacunas-SIREVA), was seen
as including the phases of epidemiologic research in the participating countries, basic research to develop the new vac- cines, clinical and field trials, and con- struction and operation of a pilot pro-
duction plant to support these other
phases.
Once a vaccine had been found effec- tive, safe, and affordable, production on a commercial scale would begin, possibly under arrangements with state or private
laboratories; and mass vaccination of
children would commence, perhaps
through an extension of the Expanded
Program on Immunization (EPI). The three
diseases of bacterial origin considered
targets of the effort are pneumococcal
pneumonia, meningococcal meningitis
caused by Group B Neisseria meningitidis, and typhoid fever.
SIREVA’s original design included three
options designated “A,” “B,” and “C.”
Option A dealt only with meningitis and
typhoid fever, while options B and C in-
cluded development of vaccines against
all three target diseases. However, op-
tion B included only 10 participating countries with 10 collaborating national
laboratories, while option C included 17
countries-thus envisioning vaccination
of a larger population and implying greater
development costs for SIREVA directed
at identifying serotypes and testing vac- cines in all 17 countries. All three options
called for two principal laboratories or
vaccine centers to be involved in the proj- ect, one associated with the National In- stitute of Public Health of Mexico and the other with the Oswald0 Cruz Foundation in Brazil, these being the centers with the greatest experience and technical sophis- tication in the Region.
On analyzing the costs and benefits of the three options, it was concluded that
the pneumonia vaccine should definitely
be included in the system and that all
three vaccines could be applied in the 17
countries of the Region where the se-
lected diseases are now of major impor- tance. However, it was also decided that
the system would be developed in 10
countries, since a network of 10 national
laboratories would be sufficient for the
epidemiologic work and the clinical and
field trials. This option became the final version of the proposal (4).
The only variation still being consid- ered deals with the number of people who would be vaccinated against men- ingitis, the cost-benefit calculations being repeated for two possible scales of op- eration that differ by a factor of two. It should be noted that the limit placed on the number of countries initially involved
would not limit later administration of
the vaccines in other countries of the
Americas, or even in other regions, where the cost of vaccination might be justified by the benefits.
The purpose of the present analysis is to estimate and compare SIREVA’s costs and benefits, and to establish under what circumstances the benefits would justify the costs, and thus justify establishment of the system.
With respect to costs, it is necessary to
distinguish between two elements: ex-
penditures for vaccine development (in-
cluding field trials and adaptation to dif-
ferent epidemiologic conditions) and
expenditures for vaccine administration
(that is, for vaccinating the population). Beyond that, however, it is not the pur- pose of this presentation to distinguish between different kinds of costs. There- fore, the account that follows makes no attempt to discuss the composition of the costs attributable to SIREVA (that is, their distribution among basic research, clini- cal trials, field trials, pilot production, etc.);
only their distribution over time will be
considered. Similarly, we will not con-
sider the biologic, chemical, and epide- miologic aspects of the target diseases and
prospective vaccines. Rather, the infor-
mation used in this analysis deals only with the numbers of people that would be vaccinated and the numbers that would
become sick or die if unvaccinated; the
costs of implementing SIREVA, vaccinat-
ing the population, and treating patients; and possible additional benefits attribut- able to vaccination. The last part of the analysis estimates the sensitivity of the re- sults to changes in the parameters utilized, this type of estimate being especially cru- cial when neither the costs nor the benefits are known but must be estimated with varying degrees of precision.
The costs attributable to SIREVA as such
(the vaccine development costs cited
above) have been estimated for a period
of 10 years under the assumption that,
although the system could continue to
function for many more years, the ex-
penditures in the eleventh and following
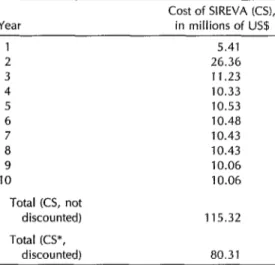
Table 1. Cost of SIREVA, by year, in constant us!L=
Year
Cost of SIREVA (CS), in millions of US.0
4 5 6 7 8 9 10
Total (CS, not discounted) Total KS*,
discounted)
5.41 26.36 11.23 10.33 10.53 10.48 10.43 10.43 10.06 10.06
115.32
80.31
“The analysis only attributes the costs of the fust 10 years of
SIREVA to the development of vaccines against meningttis,
typhoid fever, and pneumonia because it is expected that mi- tiation of vaccinatmn with all three vaccmes WIII occur in the first decade.
years would be dedicated to the devel-
opment of new vaccines not contem-
plated in the initial plans. Therefore, it would not be correct to attribute or charge expenses of those future years to the first
three diseases, and vaccination against
them would have to justify only the ex- penses of SIREVA’s first decade. These expenses, presented by year in Table 1, have been estimated at LJS$115.3 million in constant dollars.
Any cost-benefit analysis is based on
what are called present vahes of cost and benefit flows over time, these flows being
discounted according to how far in the
future they occur. This procedure re-
quires the selection of a discount rate (r),
which is conceptually equivalent to an
interest rate. A cost t years in the future is then estimated by dividing the present cost (C) by (1 + r) for each of t - 1 years (5), the discounted cost being
C/(1 + r)(l + r)(l + r) . . . n
= C/(1 + r)@-l) = C X (1 + r)cPt+*).
For example, if an item’s present cost (C) were $1,000 and the discount rate were 10% (O.lO), then its discounted cost five years in the future (t = 5) would be $683, calculated as follows:
Year 5 discounted cost = C X (1 + r)(-t+*)
= $1,000 X (1 + O.lO)(-s+1, = $1,000 x (l.lO)(-4)
= $1,000/1.1(4~ = $683
Of course, the total discounted cost (C*) over t years would be the sum of the costs in each of the years considered (from here on we shall use an asterisk [*I to
designate a discounted sum). And so, if
counted over the decade, can be ex- pressed by the formula
CS* = SUM CS(t) x (1 -l- r)(-t+*)
where CS(t) is the undiscounted cost in
year t, (1 + r)cet+*) is the discount factor, and SUM indicates the sum of the costs
of all the years in question. The same
method can be used to calculate dis-
counted benefits.
Annex 1 lists the multiplicative dis-
count factors in the form (1 + r)cbt+l) for a discount rate of 10% per year (r = 0.10) from Year 1 of SIREVA (when the factor is equal to 1 .O) to Year 30, which is the furthest horizon considered in this anal- ysis and for which the factor decreases to only 0.063. This means that one dollar of cost or benefit that only occurs in Year 30 would have a present value of $0.063; and conversely, $0.063 invested today at a rate of interest of 10% per year would have a value of $1.00 after 30 years. The last line of Table 1 illustrates the effect of
discounting the future costs of SIREVA
at 10% per year over the course of a dec-
ade, which reduces the undiscounted fig-
ure (US$115.3 million) to a discounted
cost of US$80.3 million.
The use of other discount rates would
obviously give other totals. However, it
has been judged that any reasonable rate would fall between 8% and 15% per year, and that changes introduced by using such rates as extreme values would be a good deal smaller than possible changes intro- duced by uncertainties regarding the value of other variables. For example, the cost of vaccinating one individual is not yet known, but it is conceivable that it could vary by a factor of 10, while a discount rate of 8% would not differ from one of 15% by as much as a factor of two. More- over, changes in the discount rate only
affect the relative weights of one year
versus another; they do not affect the relative weights of costs and benefits oc-
curring in the same year. Therefore, the question of whether the benefits justify the costs is not as sensitive to variations in the discount rate as it is to variations in the costs or benefits taken separately.
ANTICIPATED
EFFECTS
OF SIREVA
According to the projections for
SIREVA, it will be possible to begin vac- cination against typhoid fever in Year 7
of the system’s operation. Vaccination
against meningitis would begin in Year
9, and vaccination against pneumonia in
Year 10. In all three cases it is anticipated that vaccination will commence at a high rate, so as to reduce the number of sus- ceptible individuals in the existing pop-
ulation. Later, the number of vaccina-
tions carried out would be reduced to
focus on newborns at relatively higher
risk, though possible fluctuations could
be occasioned by future outbreaks.
In the case of pneumonia, only one
year of high coverage is foreseen. This high coverage phase would extend over five years for the other two diseases, and in the case of typhoid fever there would be a period of intermediate coverage fol- lowed by a second reduction in the cov- erage rate after another four years.
Table 2 shows estimates of the num- bers of people who would be vaccinated against each of the three target diseases in any given year. However, the number
of individuals vaccinated does not cor-
respond to the number immunized, be-
cause development of vaccines that are
100% effective is not anticipated; rather, the estimates of disease cases and deaths prevented (see Table 3) are based on the assumption that the vaccines will be 90% effective. It should also be noted that the Table 2 data refer to individuals rather than to vaccine doses, since a series of two or more doses per person may be
Table 2. The projected numbers of individuals to be vaccinated, by target disease and year.
Year
No. vaccinated (NUM), in millions, against: Typhoid
Meningitis fever Pneumonia Total 7
8 9 10 11 12 13 14 15 16 17
39.0-78 39.0-78 39.0-78 39.0-78 39.0-78 19.5-39 19.5-39 19.5-39 19.5-39
65 65 65 65 65 39 39 39 39 26 26
39.0 19.5 19.5 19.5 19.5 19.5 19.5 19.5
65.0 65.0 104.0-143.0 143.0-182.0 123.5-162.5 97.5-l 36.5 97.5-136.5 78.0-97.5 78.0-97.5 65.0-84.5 65.0-84.5
- - - - -
-
30
-
19.5-39
-
26
-
19.5
-
65.0-84.5 Discounted total no. vaccinated fNUM*J, in millions:
20-year horizon 30-year
horizon
106-212 227 67 400-506 126-251 253 87 466-591
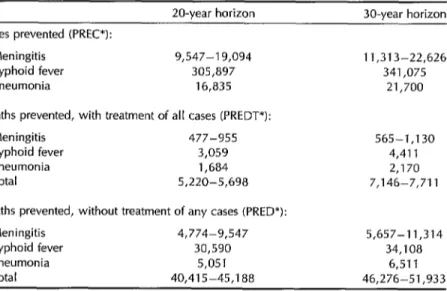
Table 3. Total discounted numbers of disease cases prevented, deaths prevented with treatment of all cases, and deaths prevented without treatment of any cases, over 20-year and 30-year horizons.
20-year horizon 30-year horizon Cases prevented (PREC*):
Meningitis 9,547-l 9,094 11,313-22,626 Typhoid fever 305,897 341,075 Pneumonia 16,835 21,700 Deaths prevented, with treatment of all cases (PREDT*):
Meningitis 477-955 Typhoid fever 3,059 Pneumonia 1,684 Total 5,220-5,698
Deaths prevented, without treatment of any cases (PRED*): Meningitis 4,774-9,547
Typhoid fever 30,590 Pneumonia 5,051 Total 40,415-45,188
565-1,130 4,411 2,170 7,146-7,711
5,657-11,314 34,108
needed to complete the vaccination and achieve 90% immunization.
The cost-benefit analysis also assumes that the cost of vaccinating one individ-
ual will be independent of the number
of people vaccinated. The latter number will always be large enough (at least 19.5 million per year) to benefit from possible economies of scale. Similarly, it is as- sumed that the benefit obtained per in-
dividual vaccinated will be constant and
independent of how many others receive
the vaccine. Among other things, this
implies that the chance of one unvacci-
nated individual becoming ill does not
depend on the number of individuals
immunized; that is, a possible “collec-
tive immunity” effect is not taken into account (6).
As a consequence of these assump-
tions, the total discounted costs and ben- efits can be found by totaling and dis- counting the number of people vaccinated and later applying to that discounted sum the costs and benefits per person. More explicitly, if the cost of vaccinating some- one against disease “i” is designated VAC(i), then by definition the total cost (CST) of vaccinating some number (NUM) of people against disease i in some future year t is as follows:
CST(i,t) = VAC(i) x NUM(i,t),
and discounting and totaling both sides
of the equation yields
CST*(i) = SUMCST(i,t) x (1 + r)cPt+*)
= SUMVAC(i) x NUM(i,t)
X (1 + r)(-t+l)
= VAC(i) x SUMNUM(i,t)
X (1 + r)(-r+*)
= VAC(i) x NUM”(i)
The same type of calculation can be ap- Beyond 20 years, any protection be-
plied to the number of disease cases pre- comes very speculative; in particular, it
vented (applying as a multiplicative factor is not known what might happen to the
the probability that a vaccinated individual risks of acquiring a disease or the benefits would have acquired the disease if he or she had not been vaccinated); to the num- ber of deaths prevented (successively ap- plying the probability that an individual with the disease died of it, whether or not the effects of curative treatment on the probability of survival are considered); and to the total benefit obtained from vacci- nation (using the individual or unit ben- efit as the multiplicative factor).
In relating all these calculations to a discounted sum of individuals, one is not
saying that an individual vaccinated 15
years from now is worth less than one vaccinated before that, but only that the economic value of the cost and the as- sociated benefit are less today because they occur further in the future. This dis-
counting and totaling of individuals in-
stead of monetary sums is nothing more than a valuable mathematical simplifica- tion. Variables employed in making rel- evant calculations and the formulas used to discount and total them are summa- rized in Annex 2, which also contains a glossary of all of the terms utilized in the analysis.
The discounted and totaled numbers
of individuals vaccinated, designated
NUM”, are shown at the bottom of Table 2 by disease for two different horizons- 20 years and 30 years. In contrast to the SIREVA costs for vaccine development (CS), which end in 10 years, the costs of
administering the vaccines (CST) never
end, so long as the disease is controlled
but the pathogens are not eradicated.
Therefore, for the purposes of this anal- ysis, it is necessary to choose a final year. It seems reasonable to think that if SIREVA could be justified, this justification would probably occur within 20 years, a period that would include more than a decade of application of each vaccine.
of being protected. Solely to illustrate a longer horizon, the calculations have been repeated for a 30-year period. As will be seen, this extension of the period does not significantly affect the system’s net estimated worth.
As the Table 2 projection shows, dur- ing the 20 years following SIREVA’s ini- tiation the equivalent, in terms of present
value, of between 106 million and 212
million people would be vaccinated against
meningitis, some 227 million would be
vaccinated against typhoid fever, and
some 67 million would be vaccinated
against pneumonia. Overall, in dis-
counted terms, between 400 million and
506 million people would be vaccinated
during the period, the actual figure de-
pending on the extent of vaccination
against meningitis. This total could refer
to the discounted equivalent of 400-506
million individuals; or it could involve
fewer individuals, some of them being
vaccinated against two or even three of the target diseases.
On extending the horizon to 30 years
these values increase, but much less than
proportionately to the number of addi-
tional years of vaccination because the
discount factors (see Annex 1) give little weight to the years furthest away. In terms of present values, the entire third decade
has the same value as only the last five years of the second decade, which in turn are only worth the same as the first year by itself.
To go from the number of people vac- cinated to the number of disease cases prevented it is necessary to multiply by the effectiveness of the vaccine (which determines whether the person is really
immunized) and then by the chance that
the person would become sick if not im-
munized. The effectiveness of all three
vaccines is estimated at 90%, while the
incidences of the three diseases (per
100,000 population at risk) are estimated at 10 (with a maximum of up to 50) for meningitis, 150 for typhoid fever, and 28
for pneumonia. These figures give the
likelihood of preventing a disease case by
vaccinating one person a probability of
9, 135, and 25 chances per 100,000, re- spectively. (Only the lower estimated in-
cidence is used for meningitis, because
this reduces the benefits without affect- ing the costs; and if SIREVA is justified
under these circumstances, it would be
even more justified if the disease inci- dence were higher.)
The probabilities of preventing a case
are shown in Table 4, which will be dis- cussed later, while Table 3 indicates the estimated numbers of cases that would
Table 4. The estimated cost of treatment (in constant US$), probability of preventing one case, and implied maximum cost of vaccination,a by disease, independent of the number of vaccinations.
Typhoid
Meningitis fever” Pneumonia Probability of preventing one
case, SUF(i) x EFV(i) 9.0 x 10-S 1.35 x 10-S 2.5 x 1O-4
Unit cost of treatment, BTR(i) $3,000 $584 $6,306
Implied maximum cost of one vaccination, SUF(i) x
EFV(i) x BTR(i) $0.27 $0.79 $1.58
“The implied maximum cost of vaccination is the value such that the cost of vaccinating one person compensates exactly for
the probable cost of having to treat that individual for the disease. It is calculated by multiplying the unit cost of treatment by
the probability of preventing one case. For this calculation the fixed cost of developing vaccmes against the target diseases is
be prevented, by disease, for horizons of 20 and 30 years. By far the greatest dis- ease prevention occurs with regard to ty-
phoid fever, because of its high inci-
dence, the discounted number of cases
to be prevented totaling over 300,000. For
meningitis and pneumonia the estimated
figures are lower by an order of magni- tude, ranging from 10,000 to 23,000 for meningitis and from 17,000 to 22,000 for pneumonia.
In some cases a person who acquires the disease will die. The likelihood of this
varies greatly, depending on the disease
and whether the victim does or does not receive adequate and timely treatment. With such treatment almost no one dies of typhoid fever, since the death rate is estimated at no more than 1%; and even without treatment that rate rises to only
10%. Regarding pneumonia, it is esti-
mated that the lethality is 3% with treat-
ment and 10% without treatment, while
for meningitis the corresponding rates are estimated at 5% and 50% (4). Therefore, the numbers of deaths prevented are not proportional to the numbers of cases pre-
vented-the risk of death depending on
the particular disease involved and also
varying by a factor as great as 10, de-
pending on whether one assumes that
each patient does or does not receive ap- propriate treatment.
Table 3 shows the estimated numbers
of deaths that vaccination would pre-
vent, by type of disease, and also shows the total numbers of deaths preventable by SIREVA. Showing these latter totals is appropriate; for although it would be incorrect to total the numbers of cases of diseases that are very different with re- spect to severity and danger, it is legiti-
mate to total the resulting deaths. De-
pending on the horizon selected, the totals range from 40,000 to 52,000 deaths pre- vented if no treatment is assumed, and from 5,000 to 8,000 if it is assumed that
every victim receives appropriate care.
ECONOMIC
BENEFIT:
TREATMENT
COST SAVED
The benefits obtained by preventing one case of a disease include some that are difficult to quantify or evaluate econom- ically, such as reduction of the patient’s
pain and suffering. Other benefits, al-
though possibly less important, are eas-
ier to evaluate in economic terms; among
these is the treatment cost saved as a
result of not having to care for the pa- tient. Clearly, attributing this monetary benefit to vaccination depends on an as-
sumption that the victim would receive
the treatment if he were to contract the disease. This benefit is received by the person or institution that otherwise would have to pay the treatment cost, whether the paying party is the patient or not.
Thus, one way to compare costs with benefits is to relate the cost of vaccinating one person with the expected cost of treating that individual, considering these procedures as alternatives. Obviously, this last assumption is more reasonable when the treatment results in a complete cure, without permanent injury to the patient. When the patient dies despite the treat- ment (which is possible with all diseases and occurs in up to 10% of pneumonia cases) or is left with significant sequelae
(as can easily occur with meningitis),
treatment is a very incomplete substitute for prevention.
Of course, one must compare the cost of vaccination with the expecfed or probable cost of care, because not all vaccinated
individuals would become sick if unvac-
cinated. The comparison depends, there- fore, on the likelihood that the vaccine would prevent a case of the disease. This likelihood, as already noted, is shown on the first line of Table 4; it is calculated by multiplying the effectiveness of the vac- cine (EFV) against disease (i) by the prob- ability of suffering the disease, SUF(i). This is the same logic that has been used
to justify eradication of poliomyelitis,
through the savings in treatment costs
that would result from vaccinating vir-
tually the entire population at risk (7). The second line in Table 4 shows the average cost of providing a patient with correct and timely care, designated BTR(i). This is estimated to range from less than $600 in the case of typhoid fever to more than $6,000 in the case of pneumonia.
Taken together, the likelihood of pre-
venting a case and the cost of treating
that case determine a hypothetical cost
of prevention where the prevention and
treatment costs would equal one another, and so the net saving from vaccination would be zero. This cost can be viewed as the implied maximum cosf of vaccination in the sense that at any lower cost the vaccination would be less costly than the treatment.
As can be seen on the third line of the table, this latter cost, SUF(i) x EFV(i) x
BTR(i), is calculated by multiplying the
probability of preventing one case by the cost of treating one case. And the cost of
preventing one case is the cost of one
vaccination, VAC(i), divided by the prob-
ability of preventing one case with one
vaccination or
VAC(i) / [SUE(i) x EFV(i)].
On relating this expression to the cost of treatment, BTR(i), one sees that where
VAC(i) = SUF(i) X EFV(i) x BTR(i)
there is exact equality between vaccina- tion and treatment costs; and likewise, where
VAC(i) < SUF(i) X EFV(i) x BTR(i)
vaccination offers a net economic benefit. In monetary terms (see Table 4), the cor-
responding values range from $0.27 per
vaccination in the case of meningitis to
$1.58 in the case of pneumonia. Regard- ing typhoid fever, it should be noted that the low cost of treating one case of this disease is partially balanced by its high incidence in the population, so that the
implied maximum cost of vaccination
against typhoid fever is $0.79, or almost three times the implied maximum cost in the case of meningitis.
As has been said, until the vaccines are
developed and administered on a mass
scale, there can be no exact picture of vaccination cost. The interpretation of the calculations in Table 4 is that vaccination
will be justified-through savings in
treatment costs, without considering other benefits-as long as it costs no more than $0.27 per vaccination against meningitis, etc. If, for example, it were feasible to vaccinate at a unit cost of $O.lO-which would cover not only the cost of the vac- cine but also the cost of distributing and administering it to the population, then
clearly vaccination would be highly
worthwhile. In contrast, if the unit cost
were $1.00, only vaccination against
pneumonia would appear to be justified,
assuming no other benefits were con-
sidered.
Even if one compares only vaccination
and treatment, however, the calculation
presented in Table 4 is still incomplete because the vaccines involved do not yet exist and have to be developed. This im- plies that the benefits, in the form of saved medical costs, would have to cover not only the costs of vaccination (costs “out- side SIREVA” or CST), but also the vac-
cine development costs “within” SIREVA
(CS). In addition, SIREVA is attempting
to develop three vaccines, without the
total cost of the program being attributed to one or another of these products.
The first of these conditions implies that
the maximum cost allowed for vaccina-
tion is going to be less than that shown in Table 4, since the benefits must also
costs. The second condition (of copro-
duction or inseparability) implies that
judging the worth of each vaccine indi- vidually makes no sense, because it will be necessary to judge the entire system with respect to the average cost of vacci- nation against the three target diseases.
This matter can be summarized as fol- lows: For there to be a net benefit after considering both types of costs, it is nec- essary that
BENT” > CS” + CST”,
where BENT is the total benefit in saved
treatment costs-the cost of treating one
individual times the number of cases pre- vented. (Table 3 indicates the number of
cases prevented, and Table 4 shows the
unit costs of treatment.) As noted above,
CST* = VAC x NUM”,
where VAC denotes the average cost of
vaccination within the time interval in-
volved. Both BENT* and CST” must be summed for all the target diseases, and both must also be discounted and summed over time. Then, in order for the net ben- efit condition to be met, it is necessary that
BENT* - CS” > VAC x NUM*,
which results in the implied maximum
value of VAC being the total benefit less
the cost of SIREVA (the expression on
the left of the inequality sign) divided by the total number vaccinated, or
VAC < [BENT* - CS”] / NUM*.
Table 5 presents the corresponding cal- culations. Starting with the values of CS” and NUM” from Tables 1 and 2, respec- tively, Table 5 proceeds to list values for
the three ingredients of BENT*, these
being the saved costs of treating each dis- ease, and the BENT* totals for 20-year
and 30-year horizons. The last entries
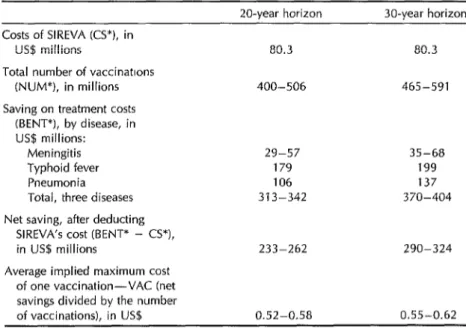
Table
5. The average implied maximum cost of vaccination (in constant US$) derived from the number of individuals vaccinated, treatment costs, and the cost of SIREVA, for 20-year and 30-year horizons.Costs of SIREVA KS”), in lJS$ millions
Total number of vaccinattons (NUM*), in millions Saving on treatment costs
(BENT*), by disease, in US$ millions:
Meningitis Typhoid fever Pneumonia
Total, three diseases Net saving, after deducting
SIREVA’s cost (BENT* - CS*), in US$ millions
Average implied maximum cost of one vaccination-VAC (net savings divided by the number of vaccinations), in US$
Z&year horizon X&year horizon
80.3 80.3
400-506 465-591
29-57 35-68
179 199
106 137
313-342 370-404
233-262 290-324
0.52-0.58 0.55-0.62
show the 20-year and 30-year values of BENT* - CS* and of VAC.
The figures shown indicate that over a period of 20 years some LJS$80.3 million, at present value, would be spent devel- oping the three vaccines, which would be administered to the discounted equiv- alent of 400-506 million individuals. The disease cases prevented would represent an estimated saving of $29~$57 million for meningitis, $179 million for typhoid
fever, and $106 million for pneumonia.
The total benefit would amount to $313- $342 million before subtracting the costs of SIREVA itself, yielding a net benefit of $233-$262 million. After dividing this amount by the total number to be vac- cinated, it can be concluded that SIREVA is justified with respect to the treatment costs saved as long as the population could be vaccinated for no more than $0.52- $0.58 each. If one individual were to re- ceive all three vaccines, the permitted cost would rise to $1.566$1.74. Applying these same calculations to the 30-year horizon yields an average permitted cost that is greater by a few cents because the costs of SIREVA would be distributed over more years of vaccination, and so their relative weight in the total costs would be less.
OVERALL
BENEFITS FROM
SIREVA AND VACCINATION
COSTS
The exercise in the previous section fixes
a value on the benefit derived from
SIREVA, equating it to saved medical
treatment costs, and on this basis esti-
mates the maximum cost of vaccination
that would be compatible with a net pos- itive benefit. This procedure can be re- versed by first fixing a value on the cost of vaccination and then deriving from it an estimate of the minimum benefits pro-
viding justification for SIREVA. In this
case, the benefits could be of any type,
without being limited to the treatment
costs saved. The worth of preventing a
death, the value of economic production saved by preventing death or illness, the reduction of physical and emotional suf- fering, and other benefits could be in- cluded. In this regard, since the disease cases and deaths prevented are the most
quantifiable results of vaccinating the
population, it seems natural to estimate
minimum benefits in terms of these con-
cepts.
The condition that must be satisfied is
BEN* > CS” + CST* = C*,
where C* is the total costs and BEN* is
the discounted sum of al2 the benefits
(including BENT+, the benefit of not hav- ing to treat those who would become ill). If we then designate the benefit or “util- ity” per case prevented as LJTU, and the number of cases prevented as PREP, we see that for case prevention alone to sat- isfy the condition it will be necessary for
UTU x PREP > C”,
or equivalently,
UTU > c* / rREc*.
Similarly, if we designate the benefit per
death prevented as UTUD, we see that
for mortality prevention alone to satisfy the condition it will be necessary for
UTUD > C* / PRED*,
where PRED” is the number of deaths that would occur in the absence of vac- cination and treatment.
The corresponding calculations appear
in Table 6. They are limited to the 20- year horizon, since it was determined (in Table 5) that extension of the horizon to 30 years does not significantly affect the results. Starting with the cost of SIREVA
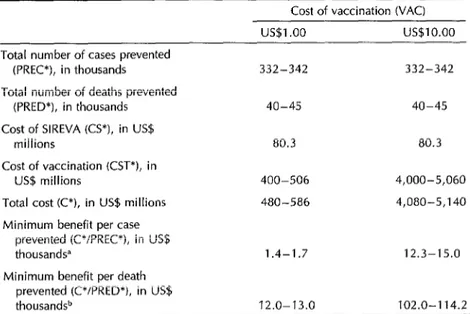
Table 6. Implied minimum benefit per case prevented and per death
prevented as a function of the cost of vaccination, without considering patient treatment @O-year horizon).
Cost of vaccination WAC) US$l .oo us$10.00 Total number of cases prevented
(PREC*), in thousands 332-342 332-342 Total number of deaths prevented
(PRED*), in thousands 40-45 40-45 Cost of SIREVA KS*), in US$
millions 80.3 80.3
Cost of vaccination KST*), in
US$ millions 400-506 4,000-5,060 Total cost CC*), in US$ millions 480-586 4,080-5,140 Minimum benefit per case
prevented (C*/PREC*), in US$
thousandsa 1.4-1.7 12.3-15.0 Minimum benefit per death
prevented (C*/PRED*), in US$
thousand9 12.0-13.0 102.0-l 14.2
aThe values for the minimum benefit do not change significantly on extending the howon to 30 years. bThe mimmum benefit per death prevented does not attribute any benefit to preventmg nonfatal disease cases.
(PREP), and numbers of deaths pre-
vented (PRED”) that appear in Tables 1 and 3, Table 6 derives the other compo- nent of the total cost--the cost of vac-
cination-from the total number vacci-
nated (see Table 2), using a unit cost (VAC) first of $1 and then of $10.
The resulting total cost (C*) is then used
to calculate the benefits per case pre-
vented (UTU). It turns out that the first VAC cost ($1) yields values quite close to
those that would permit justification of
SIREVA solely on the basis of medical treatment costs saved, while the second VAC cost ($10) yields values so high that
the benefits per case prevented would
have to be substantially greater.
The results of attributing the entire benefit to the prevention of death (UTUD) are shown in the last line of the table. Naturally, the benefit involved would have to be much greater. Given that, on the
average, approximately 10% of the un-
treated cases would terminate in death,
the minimum benefit per death pre-
vented would have to be some 10 times
greater than the minimum benefit per
disease case prevented.
For example, at a cost of vaccinating one person for $1.00, SIREVA is justified so long as an average benefit per case prevented of between $1,400 and $1,700 is obtained. This is based on the estimate that a total of $480 to $586 million at pres- ent value will be spent in order to pre- vent a total of some 332,000~342,000 cases of the three diseases.
The minimum necessary benefit per case rises to $12,000 if the cost of vaccination is fixed at $10; it does not rise in the same proportion as the unit cost of vaccination because the actual expenditures of SIREVA are not affected. It should be noted, how- ever, that when the cost per vaccination is $1.00 or greater, these fixed costs of developing the vaccines are of relatively
little importance compared to what would
have to be spent applying them. There-
fore, justifying the vaccination is almost equivalent to justifying SIREVA, if there is no other way to develop the vaccines that is less costly than the system pro- posed.
The final calculations (on the last line of Table 6) are somewhat artificial, since they attribute benefits only to the pre- vention of death. This establishes a kind
of “maximum of the minimum” for the
necessary benefit justifying SIREVA-at
levels on the order of $12,000 in the first instance and $100,000 in the second.
It should be noted, however, that ben-
efits from cases prevented and deaths
prevented can be combined. That is, it is
appropriate to compensate for the costs
of SIREVA through any combination of
benefits per death prevented and bene-
fits per nonmortal case prevented that
satisfies the relationship
[UTU x (PREP - PRED*)J
+ (UTUD x PRED*) > C”,
where UTU, the benefit per case pre-
vented, would be substantially less than
UTUD, the benefit per death prevented. The expression (PREP - PRED*) refers to the number of individuals who would become sick but not die if they were not vaccinated.
Both the calculations in Table 5 and
those in Table 6 implicitly assume that
the benefit associated with vaccination
occurs immediately, simultaneously with
vaccination. This assumption is justified if the target disease would probably at- tack an individual within a short time or never, as is typically true of the diseases
targeted by the Expanded Program on
Immunization, which affect primarily
children (although those diseases can ap- pear several years later than the normal
age of immunization). If, on the other
hand, a large proportion of those affected
will typicaIly become ill many years after
vaccination-and if the vaccine retains
its effectiveness for many years, so that it is not necessary to repeat the vacci-
nation frequently-the calculations that
were just presented can prove optimistic or overly favorable because they do not
consider the interval between the mo-
ment of vaccination and the probable mo- ment of becoming ill.
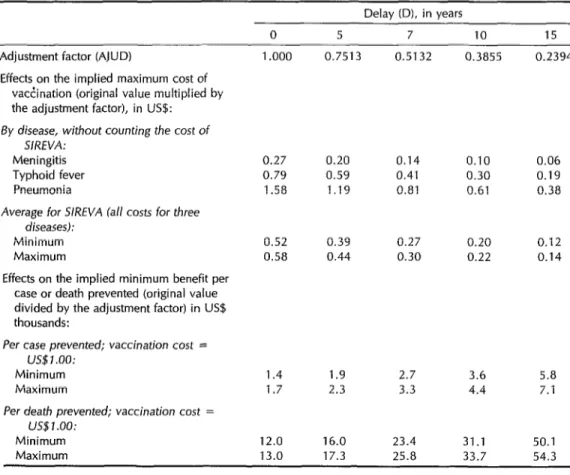
The greater this interval, the longer the benefits are delayed relative to the costs, and the greater they have to be to com- pensate for this delay. The way to adjust for the possible optimistic bias is to es- timate the average interval between vac- cination and illness in years (D) and then to discount the benefits with respect to the costs by the factor (1 + r)-“, utilizing the same discount rate (r) applied else- where.
By way of example, Table 7 shows the sizes of adjustments associated with sev- eral different intervals of delay. Thus, if the benefits were delayed an average of 10 years, they would have only 38.55% of the value they would have if they ap- peared immediately. The rest of the table shows the impact of these adjustments on parameters calculated in Table 5 (the implied maximum cost of vaccination) and Table 6 (the implied minimum benefit per case prevented). As can be seen, a rela- tively short delay such as five years does not greatly affect the results; but longer delays such as 15 years produce much
stronger effects-resulting in multipli-
cation or division of the benefits or costs by a factor of four or more.
CONDITIONS JUSTIFYING
SIREVA AND SENSITIVITY
OF THE RESULTS
It has not been possible to carry out a
closed and precise cost-benefit analysis
Table 7. The effects of adjusting for the delay between vaccination and disease onset upon the implied maximum cost of vaccination and upon the implied minimum benefits of preventing a disease case, in constant US$.
Delay (D), in years
0 5 7 10 15
Adjustment factor (AJUD) 1 .ooo 0.7513 0.5132 0.3855 0.2394 Effects on the implied maximum cost of
vactination (original value multiplied by the adjustment factor), in US$:
By disease, without counting the cost of
SIREVA: Meningitis Typhoid fever Pneumonia
0.27 0.20 0.14 0.10 0.06 0.79 0.59 0.41 0.30 0.19 1.58 1.19 0.81 0.61 0.38
Average for S/RNA fall costs for three
diseases):
Minimum Maximum
0.52 0.39 0.27 0.20 0.12 0.58 0.44 0.30 0.22 0.14 Effects on the implied minimum benefit per
case or death prevented (original value divided by the adjustment factor) in US$ thousands:
Per case prevented; vaccination cost = US$ 1 .oo:
Minimum Maximum
1.4 1.7
12.0 13.0
1.9 2.7 3.6 5.8 2.3 3.3 4.4 7.1
Per death prevented; vaccination cost =
US$l.OO:
Minimum Maximum
16.0 23.4 31.1 50.1 17.3 25.8 33.7 54.3
there is no consensus on how to evaluate its benefits. Therefore, the analysis pre- sented in the above sections is based on
the relationships between these un-
known elements, rather than upon de- finitive values assigned to them. For every level of benefit per disease case pre-
vented, there is a corresponding maxi-
mum value for vaccination cost that still leaves a positive net benefit. And con-
versely, each unit cost of vaccination es- tablishes a minimum for the total benefit
of preventing one case (or one death)
compatible with net benefit from the sys-
tem. The corresponding calculation of
these two ways of presenting the rela-
tionship, shown in Tables 5 and 6, can
be considered the essence of the present analysis.
In general terms, the calculations allow one to conclude that SIREVA would be justified by its benefits if it were possible to develop the vaccines at the costs es- timated for the different options and later
to administer them to the population at
a unit cost of half a dollar or less. At this level of expense, the system could gen- erate sufficient treatment cost savings to compensate for the entire cost of devel-
oping and administering the vaccines.
Even if it were assumed that in the ab- sence of SIREVA not all the disease vic- tims would receive adequate and timely treatment, the system would still be jus-
tified if benefits per disease case pre- vented were found to have a minimum average value between $1,000 and $2,000. Part of these benefits would derive from prevention of deaths; and if it were es- timated that it would be worth spending somewhat more than $10,000 on the av- erage to avoid one death, this benefit alone would justify the proposed expenditures.
How sensitive are these results to vari- ations in the different parameters consid- ered in the analysis? If a small change in one of them causes the system to stop appearing viable, then the proposal would be risky, given the great uncertainty in the estimated values. The analysis has taken into account all of the following factors: the cost of SIREVA itself (devel- opment of the vaccines), the cost of vac-
cinating one individual against one dis-
ease, the cost of treating one case of a
disease, the number of individuals vac-
cinated, the effectiveness of the vaccine, the incidence of the target diseases, their lethality with and without treatment, the discount rate, and the possible delay be-
tween a person’s age at vaccination and
age at disease onset. For some of these factors, where less is known or it is pos- sible to anticipate a large variation, an explicit sensitivity analysis has been made. For other elements the probable variation in the factor and the consequences for the results have been discussed briefly. To terminate this analysis, the sensitivity
of the conclusions to the elements men-
tioned are discussed below. In general, there is no reason for hesitation in ex- ploring the possibilities of changes on the order of 10% or 20%; the concern is
whether one ought to anticipate varia-
tions of an order of magnitude or so in the system’s estimated yield.
Actual costs of SIREVA. The impor-
tance of these costs depends on whether they are large or small relative to the total vaccination cost. If they are small, they can vary considerably without greatly af-
fecting the total cost. For example, at the
maximum cost calculated for which vac-
cination is justified in terms of medical costs saved, the costs of SIREVA itself are one-third or less of the total cost, so that they could be underestimated by 50% and still not have a great effect upon the system’s yield.
Aside from an increase in SIREVA’s cost, the relative importance of this ele- ment would be greater if the unit cost of
vaccination were less than estimated. In
that case, however, the reduced cost of
administering the vaccines would com-
pensate for a large increase in the cost of
developing them. For example, consider
the calculation in Table 5 and assume that the element CS* (the cost of SIREVA) were doubled. Then CS” would be $160.6 mil- lion, but the system would still be justi-
fied for any vaccination cost VAC less
than $0.36.
Vaccination cost. As has been seen,
this element is crucial; and if one calcu- lates benefits only in terms of medical expense saved, this imposes a clear max- imum value upon vaccination cost that is at the level of $0.50. Increasing the unit vaccination cost to $1.00 requires greater total benefits; and if the vaccination cost were as high as $10.00, the saving in treatment cost by itself would be far too small to justify the system. Hence, every- thing depends on whether vaccination is achieved at a reasonable cost, and the proposal assumes that result. To achieve such a result, it may be necessary to in- corporate the new vaccines into the EPI; that way the logistic costs wouId be min- imal, and little more would have to be spent beyond that needed to cover the costs of manufacturing the vaccines.
per case prevented, this treatment cost
variable becomes less important-be-
cause it then constitutes only one com- ponent of the benefits, and perhaps not the greatest of them.
Number of individuals vaccinated. This
factor is crucial for the simple reason that the costs of developing the vaccines must be offset by administering them to a large enough number of people. If it were not for this fixed development cost, the cal- culations in Table 4 could be applied di-
rectly; SIREVA’s justification would be
independent of the scale of operation; and the average cost of vaccination could be
as high as $0.78. Comparing these cal-
culations with the values listed in Table 5 shows how the need to compensate for the system’s fixed costs affects the re-
sults. Both the maximum cost of vacci-
nation and the implied minimum benefit
vary directly with changes in the number
of individuals covered by SIREVA. It is
assumed, however, that the estimates of this latter number would not be in error by more than a small percentage.
Vaccine effectiveness. This factor can- not vary much because a vaccine would not be administered if it were not at least 70% or 80% effective. Therefore, vaccine effectiveness cannot affect the results very much. It would only be important if after expending millions of dollars on SIREVA, the effort failed and effective vaccines were not obtained; the entire proposal is based upon confidence that this will not occur.
Disease incidences. The estimates of
these parameters are very low, the max- imum value used being 150 cases per 100,000 inhabitants for typhoid fever. Any
increase would only make the system
more viable; and so the only considera- tion should be whether the incidences of the target diseases have been overesti- mated. Changes in the probability of get- ting sick affect the benefits the same way that changes in the number of people
vaccinated do, but without affecting the
cost-unless one could, at lower risk,
vaccinate fewer people. The epidemio- logic studies constituting part of the sys-
tem’s development will help to define
these risks better and so to adjust, if nec- essary, the projected extent of mass vac- cination.
Disease lethality. This factor cannot
vary much, even admitting that it is not known exactly. In any case, it is impor- tant only if one desires to attribute a spe- cific benefit to the prevention of death; for there would clearly be great benefit in preventing each of the target diseases even if no one died of them.
Discount rate. As has already been dis- cussed, this element cannot vary by more than a factor of two, and its influence affects the distribution of costs and ben-
efits over time without affecting their
comparison in a given year. Therefore,
the results of the analysis are not consid- ered very sensitive to the rate selected.
Delay between vaccination and pre-
vented illness. As Table 7 shows, this
factor becomes a matter of concern if it is necessary to assume a delay of more than about half a decade. If the disease presents risks over the entire human life- span, part of the benefit is left unper- ceived in terms of present value. Even though the probable impact of such a de- lay would only divide the benefits in half,
this circumstance would require an av-
erage benefit twice as large, or a cost of vaccination half as large, as those pro- jected.
It is clear that the justification, or lack thereof, of a project such as the one being analyzed depends upon how all of these
elements are evaluated, and upon the
values assigned to prevention of disease
and death-values outside the purely
economic realm. The present analysis only attempts to trace a dividing line between
the possible combinations of factors,
known or estimated, that show whether
or not SIREVA would be viable in the sense of producing benefits that more than compensate for its costs of development and application, within a reasonable span of time.
Acknowledgments. I am grateful to my
former colleagues Robert Knouss, Fran-
cisco Lopez Antunano, Gabriel Schmu-
ms, Francisco Pinheiro, Ciro de Quadros, Albert0 Pellegrini Filho, Victor Escutia, and Mario Gonzalez Pacheco, as well as
Drs. Guillermo Soberon, Akira Homma,
and Armando Isibasi, for guidance and
for the estimates upon which this study is based. Any error, however, is the sole responsibility of the author.
REFERENCES
1. Institute of Medicine, National Academy of Sciences. New vaccine development: estab-
lishing priorities (~01s 1 and 2). Washington, DC: National Academy Press; 1986. 2. World Health Organization. Research and
development in the field of vaccines: prog- ress report by the Director General. Exec- utive Board, 87th Session. Geneva: 21 No- vember 1990. (Document EB87/6). 3. World Health Organization, UNICEF, and
UNJJP. Declaration of Nezu York: the children’s vaccine initiative. New York: 10 September 1990.
4. Organization Panamericana de la Salud. SIREVA: estudio de factibilidad, sistema regional de vacunas para 10s pa&es de America Latina y el Caribe. Unpublished document. Washington, DC: 1990. 5. Drummond MF, Stoddart GL, Torrance GW.
Methods for the economic evaluation of health care programs. Oxford: Oxford University Press; 1986.
6. May RM. Ecology and population biology. In: Warren KS, Mahmoud A, eds. Tropical and geographic medicine. 2nd ed. New York: McGraw-Hill; 1990. (Chapter 19).
Annex 1. Discount factors, by year, for a rate (r) of 10% per year.
Year Factor Comments
1 1 .oooo
2 0.9091 3 0.8264 4 0.7513 5 0.6830 6 0.6209 7 0.5645 8 0.5132 9 0.4665 10 0.4241 11 0.3855 12 0.3505 13 0.3186 14 0.2897 15 0.2633 16 0.2394 17 0.2176 18 0.1978 19 0.1798 20 0.1635
Start of vaccination against typhoid fever Initiation of SIREVA
Start of vaccination against meningitis Start of vaccination against pneumonia
From Year 16 on the numbers of vaccinations do not vary.
21 0.1486 22 0.1351 23 0.1228 24 0.1117 25 0.1015 26 0.0923 27 0.0839 28 0.0763 29 0.0693 30 0.0630
Sum for years 16 to 20 = 0.9981 Sum for years 1 to 20 = 9.3647
Sum for years 21 to 30 = 1.0045 Sum for years 1 to 30 = 10.3692
Annex 2. Glossary of symbols, variables, and their relationships-in their approximate order of aDoearance in the text.
Symbol or
variable Definition t= 1,2,3... Years since initiation of SIREVA
i = 1,2,or3 Disease
NUM Number of vaccinations administered; equal to the number of individuals vaccinated if every individual is vaccinated against only one disease. NlJM refers to the number of complete vaccinations, not to the number of doses, if vaccination requires the application of two or more doses.
PREC Number of cases of a disease prevented by the vaccination program BEN Total benefit obtained by prevention of disease cases
C Total cost
cs Cost of SIREVA (for vaccine development)
CST Cost other than for SIREVA (vaccine manufacture, distribution, and administration) Note: The variables C, CST, NUM, PREC, and BEN are classified by disease (i) and year (t). The variable CS is classified solely by year; CS(i) does not exist. By definition, C(t) = CS(t) + CSTtt).
Annex 2. Continued Symbol or
variable Definition SUM
r *
Indicates the summation of a variable over a series of years t (up to 20 or 30 years in the calculations)
Discount rate for future years (0.1 or 10% in the calculations)
Indicates the discounted sum of a variable; for example, C’ = SUM C(t) x (1 + r)l-t+l) and BEN* = SUM BEN(t) x (1 + r)(--l+‘l
Note: The variables C, CS, CST, NUM, PREC, and BEN are all transformed into C*, CS*, _ . , by discounted summation. For all except CS, the sum can be obtained for a single disease (i) or for all three diseases taken together.
VAC(i) VAC EFV(i) SUF(i)
MOR(i) MORT(i) PRED(i,t)
PREDT(i,t)
UTU(i)
BEN(i,t)
Unit cost of vaccinating one individual against one disease (i). Thus CST(i,t) = VAC(i) x
NUM(i,t), and CST*(i) = VAC(i) x NUM*(i)
Summing for all three diseases gives the average implied maximum cost of vaccination. It is calculated as follows: VAC = (BENT* - CS*) / NUM*
Effectiveness of the vaccine (i). (In the calculations it is always assumed that EFV equals 0.9 or 90%.)
The probability of a person not vaccinated against target disease (i) acquiring that disease. Thus PREC(i,t) = SUF(i) x EFV(i) x NUM(i,t), which gives PREC*(i) = SUF(i)
x EFV(i) x NUM*(i)
The probability that an individual with disease (i) will die if not treated. The probability that an individual with disease (i) will die if treated.
The number of deaths prevented by vaccination, assuming those ill would receive no treatment. PRED(i,t) = MOR(i) x PREC(i,t), and thus PRED*(i) = MOR(i) x PREC*(i). The corresponding totals for all of the target diseases taken together are PRED(t) and PRED*.
The number of deaths prevented by vaccination, assuming those ill would receive treatment. PREDT(i,t) = MORT(i) x PREC(i,t), and thus PREDT*(i) = MORT(i) x
PREC*(i). The corresponding totals for all of the target diseases taken together are PREDT(t) and PREDT*.
Unit benefit or utility of prevention-the benefit derived from preventing one case of disease (i). Thus the benefit of vaccinating one individual is UTU(i) x SUF(i) x
EFW).
The benefit derived from vaccinating NUM(i,t) individuals, so that BEN(i,t) = UTU(i) x SUF(i) x EFV(i) x NUM(i,t) = UTU(i) x PREC(i,t); and hence BEN*(i) = UTU(i) x PREC*(i). The corresponding totals for all of the target diseases taken together are BEN(t) and BEN*.
Note: The net unit benefit (benefit minus cost) of vaccinating one individual is UTU(i) x SUF(i) x EFV(i) -
VAC(i), and the net total benefit is [UTU(i) x SUF(i) x EFV(i) - VAC(i)I x NUM(i,t) = BEN(i,t) - CST(i,t). The same relationship is valid for NUM*(i), BEN*(i), and CST*(i).
BTR(i) BENT
D
Unit cost of treatment-the cost of adequately treating one case of disease (i).
The benefit derived solely from not having to treat disease cases. Note that BENT < BEN because the former does not include all of the benefits; hence BENT(i,t) = BTR(i) x
PREC(i,t), and BENT*(i) = BTR(i) x PREC*(i). The corresponding totals for all of the
target diseases taken together are BENT(t) and BENT*.