Abstract1—The design of an aerodynamic simulator to be used in an automatic optimization requires reducing as much as possible its computational cost. The simulator –based on CFD code- has the requirement of being able of perform a correct ranking of different models in terms of their performances. At his stage, the qualitative accuracy is more important than the quantitative accuracy because the aim of this proceeds is to rank the alternatives. However, some validation of the achieved numerical results is required in order to guarantee that the results obtained produce a correct ranking. This work presents an experimental validation procedure applied to a simplified aerodynamic simulator for sail design. The simulator permits evaluating a large number of different alternatives with a moderate computational cost and achieving good precision in the results.
Index Terms—aerodynamics, evolutionary algorithms, optimization.
I. INTRODUCTION
Often, when trying to achieve particular design goals in any type of aerodynamic or hydrodynamic problem, CFD codes are used in order to try to simulate the behavior of what is being designed. This information is then used by the human designer to propose modifications that might make the system better meet its goals. However, CFDs are complicated programs that in many cases require a good deal of parameter tuning in order to achieve any type of believable result. The process of tuning these parameters is not straight forward and requires the user to be very experienced. Any imprecision in the tuning of the parameters could lead to results that are way off reality and, consequently, will produce mistaken design choices and usually lead to cost overruns and project failures. The main purpose of an engineering design process is to achieve an optimum value for a set of some derived quantities measuring the fitness criteria that represent the objective sought in that particular design. The inherent complexity of this process has created a demand for the capability of automating this task; in this sense some proposals making use of different optimization procedures have been published [1,
Manuscript received July 22, 2008. This work was supported in part by the Xunta de Galicia under project PGIDIT03REM08E and PGIDIT04DPI166004PR and by the MEC of Spain under project TRA2005-09290-C02-01/TMAR and under the FPU program.
Authors are with Integrated Group for Engineering Research, University of Corunna, E.P.S, Ferrol, 15403 Spain (phone: +34-981-337400 ext 3866 (e-mail: [email protected])
3866;2fax: +34-981-337-410; e-mail: [email protected], [email protected],
[email protected], [email protected]).
2]. Evolutionary techniques are in the basis of most of these procedures mainly due to their suitability for exploring very complex solution spaces, even in cases where well conformed fitness functions do not exist. The main idea of any automatic design process is to take the designer out of the search/decide loop to avoid the biases it introduces due to previous experience/inexperience and the limited number of alternatives a human is capable of contemplating.
In most engineering problems the objective function values representing their fitness are often computed using sophisticated and realistic numerical simulations of physical phenomena. Their use inside automatic design environments implies the evaluation of a very large number of models -individuals within the evolution process- in order to search design parameter spaces that are characterized by a very high dimensionality. This is an extremely computationally intensive process that could result to be excessive even when large computational resources are accessible. Consequently, to make them affordable for the computational resources and the available time to be employed in their solution, it is essential to reduce as much as possible both the number of evaluations and the computational cost of each evaluation. The former would be achieved by choosing an optimizing an appropriate evolution strategy and the later by using simulators as simple as possible.
An automatic design environment based on evolutionary techniques was created by our group with the objective of achieving valid results in generic optimization or design processes [3]. This design environment was lately implemented and adapted for performing aerodynamic designs and applied, as a first application, to the design of wind turbine blades [4]. In that particular case a simple, fast, and robust aerodynamic simulator based on blade element theory was developed for the prediction of the performance of any turbine blade produced by the evolutionary process. The general structure of the environment can be used for other aerodynamic or hydrodynamic designs, but the simplicity of the simulator used in this first application makes it unsuitable for most of these problems.
Within this framework we have been simultaneously working on one hand on the evaluation of the reliability of simplified CFD codes and the development of appropriate code calibration techniques so as to be able to decide how faithful to reality they are. On the other hand we have been introducing different simplifications on the models used in order to improve the computation of these design processes. From the point of view of aerodynamic or hydrodynamic design, this is a process that tries to optimize the shape of a
Wind Tunnel Corrections for a Low Cost
Simulator in an Evolutionary Sail Optimization
Environment
body; therefore in these problems the model is a surface acting as a boundary on the fluid dynamic problem. Several elements are involved in the evaluation stage and all of them affect to the final result of the optimization process.
The main requirement for the CFD simulators used is of being able of carry out a correct ranking of the models under evaluation in terms of their fitness. The precision in evaluating the fitness of each individual is unimportant at this stage because de goal is to know which individual performs best. Thus, even if the error of the evaluation is large it will not take effect on the searching process if this main requirement is achieved. However, the literature gives information about the accuracy of different CFD codes, but not on their appropriateness in performing good fitness ranking. It is in this framework where the appropriate experimental validation procedure becomes so important in order to determine the quality of the results.
In this paper we are going to concentrate on the presentation of a simplified model for the evaluation of sails within evolutionary design procedures and a wind tunnel based methodology for the validation of the results provided by this model. We will first introduce, in a very general manner, the evolutionary environment within which the simulator and the validation strategy operate.
II. OPTIMIZATION ENVIRONMENT
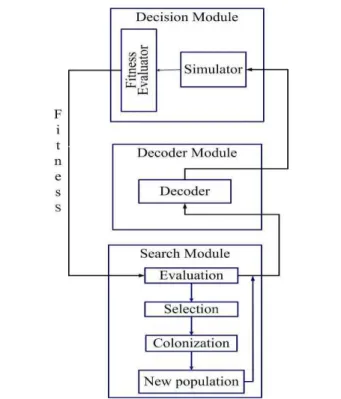
An automatic design environment was created in our group with the objective of achieving valid results in generic optimization or design processes. This environment integrates a solution search block based on evolutionary algorithms and a decision making module based on a simulator of the process. The environment has been adapted and applied to some instances of aerodynamic design by incorporating aero/hydrodynamic simulators that are appropriate for each problem under analysis. Obviously, as the computational cost incurred when applying evolution (or any other type of search technique) to a design process is very high due to the need to adequately sample the solution space, it is necessary to find ways to reduce it. This is usually done through the optimization of the search strategy so as to make very efficient use of the samples obtained and through the simplification of the simulators as much as it is viable. In the presented case the system has been adapted in order to be used in a sail optimization problem.
The basic structure of the design system comprises three blocks:
Solution search block.
Decision block, quality evaluation of each alternative.
Decoder block, links the parametric definition used in the search block to the 3-dimensional representation used in the simulator.
The search stage is based on different types of evolutionary algorithms employing a decision block for the evaluation of candidate solutions. As in the present case the search space is highly non-linear with dispersed local maxima and minima, a
macroevolutionary algorithm [5] has been developed and adapted to the search module. This type of algorithms has been proven to be a useful search procedure in this type of highly complex design problems. However, the environment has not been developed for a specific search algorithm, attending to the characteristics of each optimization /design problem different algorithms have been developed.
The aim of the evolutionary algorithm is to locate the best solutions in the search space. This search is carried out in two different ways:
1. Exploration: new individuals are created randomly in the search space.
2. Exploitation: new individuals are generated as a combination of previous above average individuals.
During the optimization process these methods are combined to achieve better results in a few number or iterations. During the first steps of evolution exploitation is hardly used, however in the last stages exploitation becomes the most important method. That is due to the fact
The quality of the results is constrained by the number of evaluations that can be made during the optimization process. Therefore the use of a low computational cost aerodynamic simulator allows increasing the number of evaluated individuals and improves the exploration and exploitation of the search surface.
The algorithm makes use of a decision module based on the evaluation of the fitness of each candidate sail through an aerodynamic simulator. This simulator provides the fitness value needed for evolution to be carried out.
III. FLUID DYNAMICS SIMULATION
Any optimization procedure needs a large number of evaluations of different alternatives. In the case of aerodynamic optimization problems, as the presented one, the fitness calculus requests high computational resources
and it’s this stage which will determinate the duration of the
optimization procedure.
Therefore, to reduce the computational cost, either the number of evaluations is reduced, or the duration of each one is shortened. The first possibility may be achieved in two different ways:
Decreasing the dimensionality of the problem, degrees of freedom of each alternative.
Reducing the size of each dimension through a smaller resolution or a reduced range.
However, all of them imply avoiding solutions. Consequently, to allow the use of an unconstrained search domain, we have concentrated on the reduction of computational cost of the simulator to study its repercussion on the quality of the results.
This quality of results achieved on the aerodynamic simulator is mainly influenced by two factors:
- The fluid dynamics numerical model - The mesh size.
The mesh element size determines the equation system size. This size is proportional to the number of mesh nodes which grows inversely with the cube of mesh element size.
The fluid dynamics are governed by the Navier-Stokes equations. However, the complete system generated by the direct application of the Navier-Stokes equations cannot be reasonably solved in complex real problems. Thus fluid dynamic numerical model used must be adapted to the characteristics of the problem. The first step in this process is to study the mean parameters that define the fluid motion around the sail [6].
In the particular case of sails, which is the problem considered here, the characteristic dimensions are:
- Kinematic air viscosity at 25ºC ( ): 1.5 ·10-5 m2/s - Wind velocity (v): 10 m/s
- Sail characteristic length (L): 12 m.
Thus, a set of standardized nondimensional parameters may be showed in the following table.
TABLE I
NONDIMENSIONAL PARAMETERS
Reynolds number 1.3·107
Froude number 0.71
Mach number 0.029
Additionally, the fluid can be considered incompressible if
1 ,
1 ,
1
Re 2 2
2
M
Fr M
M . (1)
These conditions are fulfilled in this case and air can be considered uncompressible in these simulations.
Another simplification that may be made is to neglect viscous forces. If the Reynolds number is significantly larger than one, this simplification may theoretically be made. Thus, the Navier-Stokes equation system is reduced to the Euler stationary equation by assuming an uncompressible and inviscid flow:
0 · v p v
(2)
Therefore, using a mesh and solving the Euler equation instead of the Navier-Stokes equation the computational cost can be drastically reduced. Obviously, this reduction is achieved at the cost of solution accuracy.
This is reflected by the fact that:
The use of larger mesh element size increases de size of the smallest fluid structure that may be captured by the simulator.
The fluid can be assumed as incompressible and inviscid in large regions of the domain. However in certain areas, such as in the proximity of the sail and in turbulent wakes, these considerations are not valid. Then, in regions with important changes in the value of the velocity gradient, where the dissipation processes appear, the high value of the Reynolds number and the value of the laplacian of the velocity are of similar order and the viscous effects must be taken into account.
Several considerations have been introduced in the aerodynamic simulator developed for this work in order to reduce the computational cost of each simulation. However these considerations can introduce errors in the results. Thus, the solutions must be validated through experimental procedures in order to insure that they reflect reality.
IV. SAIL SHAPE DEFINITION
In the optimization process each stage uses a different representation of the alternative: the search stage uses the chromosome, a parametric definition, and the simulator uses the 3-dimensional performance of the surface. This makes it necessary to introduce a phase decoding enabling communication between different modules that constitute the design environment. There is a huge number of different ways to achieve a good approximation to the definition of the surface. However, the parameters, used to define the surface, will be used in the optimization process in order to find the best sail shape. Consequently, the criteria employed to choose the numerical model of the surface are:
- Low number of parameters: to use a small number
- Simple definition of the surface: allowing an easy interpretation of the results in the first steps of the design process and resulting in a lower computational cost than a complex definition.
To facilitate the definition and control surfaces non uniform b-splines (NURBS) were considered. The shape of these surfaces is given by a set of control points, except those at the border are not part of the surface. These control points act as attractors of the surface, which allows for an easy way to control the shape and concavity by changing its position and weight.
In this way the number of parameters used to define the shape can be easily adapted to the requirements of each experiment. These parameters define the position and the weight of each control point, directly or through a behavior equation. The problem of this system is that the position of the points of the surface can be directly controlled. This makes it necessary to add a process of integration of the values of length and area to ascertain the real values over the sail. This allows the application in the decision module to constrain on these values, including values of the area or length.
The sails selected to perform these experiments are the
“Tornado class”, thus, the international rules for tornado class have been used to define constrains for this sail optimization. These constrains determine the maximum size and the relative position between the main sail and the jib. The limits over the size are defined over the maximum length of the sail at different heights. Thus, before the aerodynamic analysis, these values are calculated and if all restrictions are passed, the sail is rejected.
To define the main sail, five parameters have been used: Maximum displacement and its position. Maximum displacement in the head.
Displacement of the trailing edge in the head. Displacement leech over the foot.
Line of maximum deformation over the sail. To define the jib, three parameters have been used:
Maximum displacement and its position. Displacement of the trailing edge. Line of the maximum deformation.
In addition, a parabolic definition for the weight and for the horizontal position of the control points was used in order to increase the range of alternatives that can be evaluated.
V. EXPERIMENTAL VALIDATION
The aim of the evaluation process in an evolutionary design strategy is to determine which alternatives are better and the relative value of the difference between alternatives. Thus, the results of the simulator must be qualitatively acceptable even though they may not be quantitatively realistic.
In this study, the quality of each individual is determined by the resultant of forces over the sail. The experimental validation of the results of the simulator consists in comparing the real forces and the forces calculated by the numerical simulator. Due to the simplifications used in the simulator, the target of this validation procedure is reduced to generating the qualitative value of the result.
Thus, the validation procedure consists in the evaluation of a sail configuration under different attack angles and comparing the evolution between real and numeric result. To compare these two results it is necessary to determine the real shape of the sail and the forces acting over the sail.
A. Experimental apparatus
Tests were performed on a sail model placed in the subsonic closed loop wind tunnel of the University of Corunna Fluid Dynamics Lab. This wind tunnel has an open test section of 1.1 m X 0.8 m, its wind velocity can be continuously controlled and adjusted from 5 to 45 m/s, the turbulence level is below 1% and the maximum value in axial velocity non uniformity is of 2%. The sail is supported by a six component force and moment transducer. This set-up is complemented by a smoke tracer for flow visualization and a particle image velocimeter (PIV).
B. Sail shape analysis
The The first step in the simulator validation process is to determine the real shape of the sail. The sail is an anisotropic membrane and solving the problem of the real sail shape under a specific wind condition implies solving a highly non-linear problem of fluid-structure interaction. To eliminate this problem the sail is considered as a solid body in the simulator.
The shape of the sail must be measured under each specific wind condition in order to be introduced in the simulator. The measurement process must be external to the sail to avoid disturbing the flow around the sail. In this case a
stereoscopic camera system has been proposed to acquire the sail shape. This process can be divided into the following stages:
- Sail marking. A grid of point is marked on the sail in
order to permit the recognition of the surface.
- Photography. Simultaneous photographs are taken
from different points of view. In the presented case three different photographs had been used.
- Point recognition. The marked grid is recognized in
each photograph and the 3-dimensional grid is regenerated by identifying which points are the same.
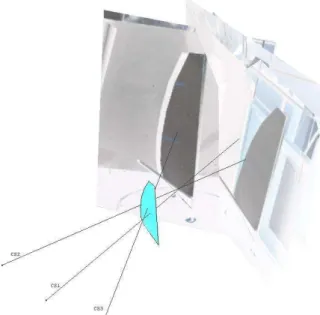
- Surface definition. A surface is generated through a
least square minimum method using the points of the grid and applying all the constraints of the problem. These constraints are the fixed position of the mast and the fact that the sign of the convexity over the whole surface must be maintained.
Figure 3. 3D-model generated.
C. Forces analysis
The sail position is defined by the mast and boom position. The mast is supported by a platform that permits the simulation of the course and the roll of the ship. The connection between the mast and the platform is achieved through the six axes force/torque transducer, which provides the forces and moments on each axis. The boom is linked to the mast by a spherical joint and its position is determined by the length of the sheet. The control of its length is carried out by a winch over a strain-gage cell that measures the tension (T) in the sheet. Through this distance, the roll of the platform and the measurement of the direction of the sheet is calculated, a director vector is obtained as:
)) cos( ), cos( ), (cos(
s , (3)
where is the angle between the sheet and the X axis, is the angle between the sheet and the Y axis and is the angle between the sheet and the Z axis. The procedure used to calculate these angles has been designed as a redundant
system in order to reduce the error in their values.
Using the mast and boom position and the sheet direction, all forces and moments are combined. With these data the center of pressure and the total force may be calculated.
Thus, the total force acting over the sail is evaluated as
) ·cos(
) ·cos(
) ·cos(
T F R
T F R
T F R
z z
y y
x x
. (4)
The position of the center of pressure is calculated through the relation between the torque and the total force.
VI. INTEGRATION OS COMPUTATIONAL AND EXPERIMENTAL ANALISIS
In the wide range of angles, shapes, relative positions analyzed in the optimization process, several considerations assumed in the numerical model will be broken. When this happens, the accuracy of the simulator is compromised, especially if the high turbulence region is large. To correct the deviations from the real values of lift and drag a neural network is used within our scheme. We made use of a simple multilayer perceptron neural network with 12 input neurons, two hidden layers having 12 neurons each and 2 output neurons (lift and drag coefficients). The input neurons correspond to: calculated lift coefficient, calculated drag coefficient, air velocity, angle of attack, and other 8 which define the shape of the sail (weigh and position of control points). These parameters were selected because lift and drag coefficients achieve near real results. They contemplate two classes of parameters: two that depend only on the studied case (attack angle and Reynolds) and four that depend on the sail profile and the analyzed case.
The validation process is carried out by means of a systematic series of measurements taken for several courses and roll angles. For each combination of course and roll the sail shape under the action of the wind is determined by a photogrammetric procedure as explained above. It is then is numerically simulated with the same shape and under the same conditions. The values of the forces and moments measured by the six axis balance supporting the mast and the strain-gage cell value for the tension in the boom rope are used as fitness parameters to evaluate the performance of the simulation.
These tests, complemented with some flow visualizations and detailed PIV measurements in specific portions of the flow field, allow establishing a correlation between numerical and real results.
VII. CONCLUSION
complement to be sure that flow details and not only the integral parameters are matched between the experimental and the numerical analysis.
This work is performed in the framework of an automatic design environment based on evolutionary techniques that is being implemented and adapted for performing the aerodynamic design of sails. The large number of evaluations needed for such a process makes it necessary to use a simplified aerodynamic simulator to reduce the computational cost of each evaluation within the evolutionary process without compromising the accuracy of the results. This can be verified only by performing a validation procedure such as the one proposed here.
REFERENCES
[1] Ziman J, (2003) Technological Innovation as an Evolutionary Process, Cambridge University Press
[2] Nolfi S., Floreano D. (2004), Evolutionary Robotics: The Biology, Intelligence, and Technology of Self-Organizing Machines, Bradford Books
[3] Lamas, A. and Duro, R. J. “ADEUS: Integrating Advanced Simulators,
Evolution and Cluster Computing for Autonomus Robot Design”
Proceedings of the International Conference on Compuational Intelligence, Robotics and Autonomous Systems.pp 398-404, 2001 [4] Díaz Casás, V., Duro, R. J., Lopez Pena, F. (2005), Evolutionary
Design of Wind Turbine Blades. International Scientific Journal of Computing. Vol. 4, No 3, 49-55, December 2005.
[5] Marín, J., Solé, R.V. (1999), “Macroevolutionary Algorithms: A New
Optimization Method on Fitness Landscapes”, IEEE Transactions on
Evolutionary Computation 3(4):272-286