FEDERAL UNIVERSITY OF SÃO CARLOS CENTER OF EXACT SCIENCE AND TECHNOLOGY
GRADUATE PROGRAM ON MATERIALS SCIENCE AND ENGINEERING
HIGHLY POROUS GEOPOLYMERS: EFFECT OF THE PROCESSING ROUTE ON THE REACHED PROPERTIES
Marcelo Strozi Cilla
FEDERAL UNIVERSITY OF SÃO CARLOS CENTER OF EXACT SCIENCE AND TECHNOLOGY
GRADUATE PROGRAM ON MATERIALS SCIENCE AND ENGINEERING
HIGHLY POROUS GEOPOLYMERS: EFFECT OF THE PROCESSING ROUTE ON THE REACHED PROPERTIES
Marcelo Strozi Cilla
Thesis presented to the Graduate Program on Materials Science and Engineering as a partial requirement to obtaining the title of DOCTOR IN
MATERIALS SCIENCE AND
ENGINEERING
Tutor: Prof. Dr. Márcio Raymundo Morelli Cotutor: Prof. Dr. Paolo Colombo
Founding Agency: CAPES (03/01/2011 - 02/28/2012) FAPESP (03/01/2012 - 02/28/2014)
Ficha catalográfica elaborada pelo DePT da Biblioteca Comunitária/UFSCar
C572hp
Cilla, Marcelo Strozi.
Highly porous geopolymers : effect of the processing route on the reached properties / Marcelo Strozi Cilla. -- São Carlos : UFSCar, 2015.
90 f.
Tese (Doutorado) -- Universidade Federal de São Carlos, 2015.
1. Engenharia de materiais. 2. Geopolímeros porosos. 3. Rotas de processamento. 4. Propriedades. I. Título.
DEDICATORY
To all those who were involved, participated and supported me during this work, especially my parents, my wife and my son.
CURRICULUM OF THE CANDIDATE
UNIVERSIDADE FEDERAL DE SÃO CARLOS
, \..,)
ufÍ--~~""
..-Centro de Ciências Exatas e de Tecnologia
Programa de Pós-Graduação em Ciência e Engenharia de Materiais
Folha de Aprovação
Assinaturas dos membros da comissão examinadora que avaliou e aprovou a Defesa de Tese de Doutorado do candidato Marcelo Strozi Cilla, realizada em 10/02/2015:
.a2
árcio Ray~undo MorelliUFSCar
D~~b
Prof. Dr. Paolo Colombo UNIPD
rtulan
/'
iii
ACKNOWLEDGEMENTS
To God, for making me strong and believe in completing this challenge, especially in the difficult times.
“Aos meus pais, Francisco e Maria, aos quais serei eternamente grato pelas lições de amor, honestidade e perseverança.”
To my wife Isabel, for accompanying me and support me throughout this work. To my son and source of inspiration ,Vinícius.
To my tutor and friend, prof. Dr. Márcio Raymundo Morelli, for believing in this project from the beginning, by the encouragement and confidence deposited in this period.
To my tutor, prof. Dr. Paolo Colombo, by the empathy shown from the beginning, even before the period in Italy, for all the support during the period in Italy, and after by the recognition and maintenance in the academic collaboration.
To the teachers and staff of PPGCEM and UNIPD by the support in professional and scientific development.
To the lab partners, and other people in Brazil and in Italy, who directly or indirectly, contributed to this work.
To prof. Dr. Murilo Innocentini, for his technical support to make the permeability tests and also for his valuable contribution on the data analysis and suggestions to the work.
v
ABSTRACT
The geopolymers (inorganic polymers) have attracted increasing attention from academia for several reasons, particularly because it is considered a sustainable material where industrial by-products can be used as raw material, and is based on a low energy cost process. Such materials find applications in virtually all industrial sectors, depending on the atomic ratio Si: Al, responsible for its properties. Currently the application of large volumes of geopolymers is focused on replacement of Portland cement. However, due to their similar properties to ceramic materials and the search ever greater of new applications, studies particularly on porous geopolymers has also attracted great interest from the academic community. But the processing routes currently used to obtain porous geopolymers are based on the routes applied in the civil construction for the production of aerated concrete with closed porosity, limiting its application where open porosity is required. Thus, this work had as objective the study and application of two new processing routes (Gelcasting Route and Gelcasting/Saponification/Peroxide Combined Route), to create a new class of porous geopolymers with predominantly open porosity. Both techniques consist of the adoption of the direct foaming technique used for the production of ceramic components, where the major difference between them is the chemical nature of the pore forming agent. For the "Gelcasting Route” commercial surfactants were used, and for the “Gelcasting/Saponification/Peroxide Combined Route” was explored the saponification reaction of a triglyceride in an alkaline medium for the in situ generation of surfactant. With the adoption of the
vii
GEOPOLÍMEROS ALTAMENTE POROSOS: EFEITO DA ROTA DE PROCESSAMENTO SOBRE AS PROPRIEDADES ALCANÇADAS
ABSTRACT (PORTUGUESE)
Os geopolímeros (polímeros inorgânicos) têm atraído a atenção da academia por várias razões, em particular pelo fato de ser considerado um material sustentável onde subprodutos industriais podem ser utilizados como matéria prima, além de um processo de baixo custo energético. Tais materiais encontram aplicações em todos os setores industriais, dependendo da razão atômica Si:Al, responsável por suas propriedades. Atualmente seu grande volume de aplicação está na substituição do cimento Portland. Entretanto, devido às suas propriedades similares aos materiais cerâmicos e a busca cada vez maior por novas aplicações, estudos sobre geopolímeros porosos tem despertado grande interesse da academia. Porém, as rotas usadas atualmente na obtenção dessa classe de materiais são baseadas nas da construção civil para a produção do concreto aerado, de porosidade fechada, limitando sua aplicação onde porosidade aberta é necessária. Neste sentido, este trabalho teve como objetivo o desenvolvimento de duas novas rotas de processamento (Gelcasting Route e Gelcasting/Saponification/Peroxide Combined Route), para
a criação de uma nova classe de geopolímeros porosos com porosidade aberta.Em ambas as rotas foram adotadas a técnica de espumação direta para
a produção de componentes cerâmicos, sendo que a maior diferença entre elas está na natureza química do agente porogênico. Na “Gelcasting Route” foram
usados surfactantes comerciais, e na “Gelcasting/Saponification/Peroxide Combined Route” foi explorada a reação de saponificação de um triglicerídeo
em meio alcalino para a geração in situ de surfactante. A partir das novas rotas
ix
GEOPOLIMERI ALTAMENTE POROSI: EFFETTO DELLA VIA DI TRASFORMAZIONE SULLE PROPRIETÀ RAGGIUNTI
ABSTRACT (ITALIAN)
I geopolimeri (polimeri inorganici) hanno attratto sempre più attenzione da parte del mondo accademico per diversi motivi, soprattutto perché è considerato un materiale sostenibile dove riffiuti industriale possono essere utilizzate come materia prima, e si basa su un processo a basso costo energetico.Tali materiali trovano applicazione in tutti i settori industriali, in funzione del rapporto atomico Si: Al, responsabile delle sue proprietà. Attualmente l'applicazione di grandi volumi è focalizzata sulla sostituzione del cemento Portland. Intanto, a causa delle loro proprietà simili ai materiali ceramici e la ricerca di nuove applicazioni, studi sui geopolimeri porosi, ha anche suscitato grande interesse da parte della comunità accademica. Tuttavia, i percorsi di lavorazione attualmente utilizzate per ottenere questi materiali sono basati sulle linee utilizzate nella costruzione per la produzione di calcestruzzo poroso, con porosità chiusa, limitano la sua applicazione dove è richiesta porosità aperta. Pertanto, questo studio hanno come obiettivo lo sviluppo di due nuovi percorsi di elaborazione (Gelcasting
Route e Gelcasting/Saponification/Peroxide Combined Route), per creare una
nuova classe di geopolimeri porosi con porosità aperta. Entrambe le tecniche consistono dell'adozione della tecnica di schiumatura diretta utilizzati per la produzione di componenti ceramici, e la differenza principale tra di loro è nella natura chimica dell'agente che formano i pori. Per "Gelcasting Route” sono stati
usati tensioattivi commerciali, e per "Gelcasting/Saponification/Peroxide Combined Route " è stata esplorata la reazione di saponificazione di un
trigliceride in ambiente alcalino per la generazione in situ di tensioattivi. Con
xi
PUBLICATIONS
CILLA, M. S.; MORELLI, M. R.; COLOMBO, P. Effect of process parameters on the physical properties of porous geopolymers obtained by gelcasting.
Ceramics International, v. 40, n. 8, p. 13585–13590,
doi:10.1016/j.ceramint.2014.05.074, 2014.
CILLA, M. S.; MORELLI, M. R.; COLOMBO, P. Open cell geopolymer foams by a novel saponification/peroxide/gelcasting combined route. Journal of the
European Ceramic Society, v. 34, p. 3133–3137,
doi:10.1016/j.jeurceramsoc.2014.04.001, 2014.
CILLA, M. S.; MORELLI, M. R.; COLOMBO, P. Geopolymer foams by gelcasting. Ceramics International, v. 40, n. 4, p. 5723–5730,
doi:10.1016/j.ceramint.2013.11.011, 2014.
CILLA, M. S. ; MORELLI, M. R. . Influência do ativador alcalino sobre a refratariedade de um geopolímero contendo metacaulim e cinzas volantes. In: 20º CBECIMAT - Congresso Brasileiro de Engenharia e Ciência dos Materiais, 2012, Joinville. Anais 20º CBECIMAT - Congresso Brasileiro de Engenharia e Ciência dos Materiais, 2012.
xiii
SUMARY
Page
“FOLHA DE APROVAÇÃO” (EXAMINING BOARD) i
ACKNOWLEDGMENTS iii
ABSTRACT v
ABSTRACT (PORTUGUESE) vii
ABSTRACT (ITALIAN) ix
PUBLICATIONS xi
SUMARY xiii
INDEX OF TABLES xvii
INDEX OF FIGURES xix
SYMBOLS AND ABREVIATIONS xxv
1 INTRODUCTION 1
1.1 Generality on porous geopolymers 3
2 LITERATURE REVIEW 5
2.1 Geopolymers 5
2.1.1 Precursors 10
2.1.2 Activators 11
2.1.3 Geopolymers to medium-high temperature applications 11
2.2 Ceramic foams (filters) 11
2.3 Industrial applications of ceramic filters 13
2.4 Processing routes to macroporous ceramics 14
2.4.1 Replica technique 15
2.4.2 Sacrificial template method 16
2.4.3 Direct foaming method 16
2.5 Saponification 17
2.6 Triglycerides sources 18
3 MATERIALS AND METHODS 21
3.1 Materials 21
3.1.1 Gelcasting route (GCR) 21
3.1.2 Gelcasting/Saponification/Peroxide Combined Route (GCSPCR)
xiv
3.2 Methods 22
3.2.1 Gelcasting route (GCR) 23
3.2.1.1 Total and open porosity 25
3.2.1.2 Mechanical strength 25
3.2.1.3 Permeability 26
3.2.1.4 Morphological analysis 27
3.2.1.5 Specific surface area 27
3.2.1.6 Linear thermal shrinkage 27
3.2.1.7 TG/DTA analysis 28
3.2.2 Gelcasting/saponification/peroxide combined route (GCSPCR) 28
3.2.2.1 Total an open porosity 30
3.2.2.2 Mechanical strength 30
3.2.2.3 Permeability 30
3.2.2.4 Morphological analysis 30
3.2.2.5 Specific surface area 31
3.2.2.6 Linear thermal shrinkage and TG/DTA analysis 31
4 RESULTS AND DISCUSSION 33
4.1 Gelcasting route (GCR) 33
4.1.1 Total and open porosity 33
4.1.2 Mechanical strength 38
4.1.3 Permeability 39
4.1.4 Morphological analysis 43
4.1.5 Specific surface area 49
4.1.6 Linear thermal shrinkage 50
4.1.7 TG/DTA analysis 52
4.2 Gelcasting/saponification/peroxide combine route (GCSPCR) 53
4.2.1 Total and open porosity 55
4.2.2 Mechanical strength 58
4.2.3 Permeability 59
4.2.4 Morphological analysis 60
4.2.5 Specific surface area 65
xv
5 CONCLUSIONS 67
6 SUGGESTIONS FOR FUTURE WORKS 69
7 REFERENCES 71
xvii
INDEX OF TABLES
Page Table A.1 Chemical analysis of precursors -* supplier - ** XRF…... 79 Table A.2 Real density of precursors………..… 81 Table A.3 Specific surface area of precursors………..… 82 Table A.4 Amount of the oxide presented in the geopolymer
composition……….….. 83
Table A.5 Amount of majoritarian oxides in the geopolymer
composition………... 84
Table A.6 Different geopolymer compositions with variations in the precursors (metakaolin: type and amount) and activators
xix
INDEX OF FIGURES
Page Figure 1.1 Overall framework of the applications according to the
molar ratio Si:Al [3]………..………..….. 2 Figure 2.1 Schematic diagram for geopolymer production [6]…..…..…. 5 Figure 2.2 Conceptual schematic model for geopolimerization
reaction [6]………. 7
Figure 2.3 Classification of porous materials by pore size according
IUPAC standard [25]……… 13
Figure 2.4 Scheme of possible processing routes used for the
production of macroporous ceramics [33]………….……..… 15 Figure 3.1 Porous geopolymer sample after demolding:
a) permeability test; b) mechanical strength test……… 24 Figure 3.2 Schematic diagram for the production of geopolymer foams
by gelcasting route [42]………... 24 Figure 3.3 Laboratory-made air permeator used to measure the
permeability of the porous geopolymers……….. 25 Figure 3.4 Schematic diagram for the production of geopolymer foams
by Gelcasting/Saponification/Peroxide Combined Route
[46]………... 29
Figure 4.1 Effect of solid content in the slurry on total porosity. All samples were produced using 2 wt% of surfactant and
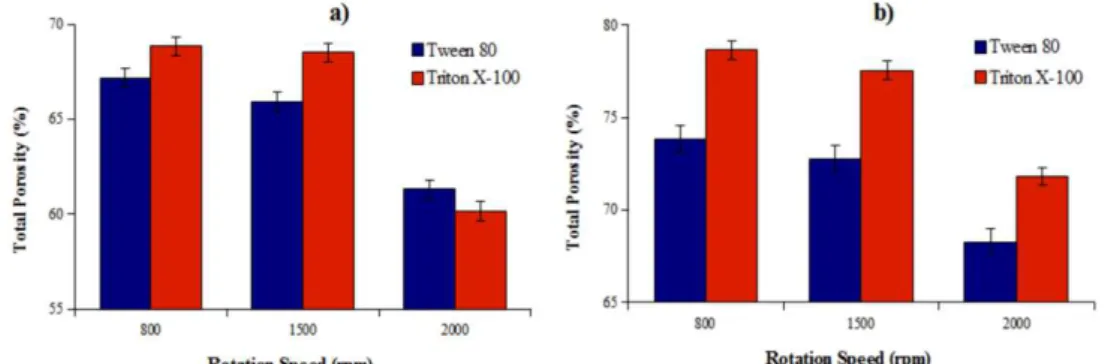
mixing at 1500 rpm mixing speed………..…….. 34 Figure 4.2 Effect of rotation speed and surfactant content in the slurry
(solid content set at 68 wt%); a) 2 wt% surfactant; b) 4 wt%
surfactant………... 35
Figure 4.3 Relation between total porosity and open porosity estimated by the Archimedes Principle; surfactant content
set at 2 wt% (a) and 4 wt% (b)...….……… 36 Figure 4.4 Total porosity as a function of the heat treatment of
geopolymer foams: (a) 2 wt% of surfactant; (b) 4 wt% of
xx
Figure 4.5 Correlation among compressive strength, relative density and total porosity of geopolymer foams.(a) 2 wt% of
surfactant; (b) 4 wt% of surfactant………. 39 Figure 4.6 Permeability constants (k1, k2) of geopolymer foams
produced with different surfactants (type and content) and different mixing speeds, as a function of open porosity estimated by the Archimedes Principle. (a) 2 wt% of
surfactant; (b) 4 wt% of surfactant………. 42 Figure 4.7 Location of k1 and k2 data obtained thought the
permeability measure, for geopolymer foams obtained by the gelcasting route in a comprehensive permeability map
[44]……….. 43
Figure 4.8 Effect of mixing speed on the cell size distribution of samples produced using 2 wt% of surfactant (solid content set at 68 wt%). a) Tween 80, 1500 rpm; b) Tween 80, 2000 rpm; c) Triton X-100, 1500 rpm; d) Triton X-100, 2000 rpm. In the insets are shown the pore size distribution for each
sample……… 44
Figure 4.9 Effect of mixing speed on the cell size distribution of samples produced using 4 wt% of surfactant (solid content set at 68 wt%). a) Tween 80, 1500 rpm; b) Tween 80, 2000 rpm; c) Triton X-100, 1500 rpm; d) Triton X-100, 2000 rpm. In the insets are shown the pore size distribution for each
sample……… 46
Figure 4.10 Effect of surfactant content on the average cell size (𝑑𝑠𝑝ℎ𝑒𝑟𝑒)and its relation with the relative density of samples (solid content set at 68 wt% and mixing speed at
xxi
Figure 4.11 Morphology of geopolymer foam not heat treated obtained from slurry with 68 wt% solids, 2 wt% surfactant Tween and stirred at 2000 rpm. (a) lowest magnification; (b) and (c) intermediate magnification in different regions; and (d) highest magnification………... 49 Figure 4.12 Linear shrinkage of geopolymer foam as a function of
temperature………... 50
Figure 4.13 Open porosity as a function of the heat treatment of geopolymer foams with (a) 2 wt% of surfactant; (b) 4 wt%
of surfactant……….. 51
Figure 4.14 TG/DTA curve for a sample produced using surfactant Tween 80 (2 wt % – 1500 rpm)……….. 52 Figure 4.15 Effect of heat treatment on the surface morphology for a
sample produced using Tween 80 as surfactant (2 wt% –
1500 rpm): (a) room temperature; (b) 700 °C; (c) 1200 °C. 53 Figure 4.16 SEM image highlighting the struts of samples produced
with different surfactants: (a) Tween 80; (b) Triton X-100, as prepared and dried………. 53 Figure 4.17 SEM micrographs of geopolymer foams, as-prepared and
dried, produced using different processing approaches: (a) saponification/peroxide/gelcasting combined route; (b)
saponification route; (c) peroxide route……… 54 Figure 4.18 Effect of the type of triglyceride and temperature on the
total porosity of the geopolymer foams. a) real values of the total porosity according the heat treatment of 300, 600, 900 and 1200 °C and b) decrement values of the open porosity of each triglyceride source due the heat treatment
in the same temperatures………... 56 Figure 4.19 Effect of the type of triglyceride and temperature on the
open porosity of the geopolymer foams. a) real values of the open porosity according the heat treatment of 300, 600,
xxii
porosity of each triglyceride source due the heat treatment in the same temperatures………... Figure 4.20 Effect of the type of triglyceride and heat treatment on the
mechanical strength of the geopolymer foams……… 58 Figure 4.21 Location of k1 and k2 data for geopolymer foams obtained
by GCSPCR in a comprehensive permeability map [44]…... 59 Figure 4.22 Effect of the type of triglyceride on the morphology
(macro-pore architecture) of the geopolymer foams heat treated
at 300 °C……… 61
Figure 4.23 Cumulative cell size distribution of geopolymer foams according triglyceride source after heat treatment
at 300 °C……….. 61
Figure 4.24 Effect of the type of triglyceride on the morphology (macro-pore architecture) of the geopolymer foams heat treated
at 600 °C………. 62
Figure 4.25 Cumulative cell size distribution of geopolymer foams according triglyceride source after heat treatment
at 600 °C……….. 62
Figure 4.26 Effect of the type of triglyceride on the morphology (macro-pore architecture) of the geopolymer foams heat treated
at 900 °C………. 63
Figure 4.27 Cumulative cell size distribution of geopolymer foams according triglyceride source after heat treatment
at 900 °C……….. 63
Figure 4.28 Effect of the type of triglyceride on the morphology (macro-pore architecture) of the geopolymer foams heat treated
at 1200 °C………... 64
Figure 4.29 Cumulative cell size distribution of geopolymer foams according triglyceride source after heat treatment
xxiii
Figure 4.30 Effect of the type of triglyceride and temperature on the specific surface area of the geopolymer foams. a) real values of the specific surface area according the heat treatment of 300, 600, 900 and 1200 °C and b) decrement values of the specific surface area of each triglyceride source due the heat treatment in the same
temperatures 65
Figure A.1 XRD pattern of HP metakaolin (HPMK)……… 80 Figure A.2 XRD pattern of Minasolo metakaolin (MSMK)………. 80 Figure A.3 XRD pattern of fly-ash (FA)……… 81 Figure A.4 Phase equilibrium diagram of the three majority oxide in
the geopolymer composition where the green line represents the SiO2, red line represents the Al2O3 and blue line represents the K2O and their intersection sets the composition according Table A.5……….. 85 Figure A.5 XRD pattern of the untreated geopolymer composition……. 86 Figure A.6 Effect of the type and amount of metakaolin (MSMK and
HPMK) and type of alkali based solution………. 88 Figure A.7 Effect of temperature in different geopolymer composition
activated with Na based solution………... 89 Figure A.8 Effect of temperature in different geopolymer composition
xxv
SYMBOLS AND ABREVIATIONS
°C Celsius degree
Al aluminum
Al2O3 aluminum oxide
ASTM American Society for Testing and Materials
Ca calcium
FA fly ash
FDA US Food and Drug Administration
GCR gelcasting route
GCSPCR gelcasting/saponification/peroxide combined route
H2O water
H2O2 hydrogen peroxide
HPMK HP metakaolin
IUPAC International Union of Pure and Applied Chemistry
K potassium
K2O potassium oxide
K2SiO3 (PS) potassium silicate
KOH potassium hydroxide
Li lithium
M Molar concentration (Molarity)
MPa Megapascal
MSMK Minasolo metakaolin
Na sodium
Na2O sodium oxide
Na2SiO3 (ASA) alkaline sodium silicate
NaOH sodium hydroxide
OH- hydroxyl
pH hydrogen potential
Si silicon
SV saponification value
xxvi
SSA specific surface area
Ti titanium
US United States
Zr zircon
𝜌 density
1 INTRODUCTION
The term geopolymer was created by Davidovits [1] in 1978 to define a class of materials of mineral nature with chemical composition similar to that of zeolite, but with a mixed microstructure (from amorphous to semi-crystalline).
The silica (SiO2) and alumina (Al2O3) species present in the raw materials react in a highly alkaline medium, organizing themselves in a continuous three dimensional structure by sharing oxygen atoms, forming bonds such as Si-O-Al-O (sialate), Si-O (sialate-siloxo) or Si-O-Al-O-Si-O-Si-O (sialate-disiloxo), also called polysialates, where the term sialate is an abbreviation for silicon-aluminate.
Among the different types of geopolymers, those based on potassium activators show improved mechanical and thermal properties due to the larger size of the potassium ion compared to sodium [2].
These materials have found application in virtually all fields of industry, depending in particular on the SiO2/Al2O3 molar ratio, which provides, among their properties, high mechanical strength, resistance to freeze-thaw, high chemical inertness, including acid attack, and excellent fire resistance, being considered as replacement for conventional cement-based applications as well as for ceramic components that can be used up to medium-high temperature (typically below 1200 °C) [1].
2
Figure 1.1 Overall framework of the applications according to the atomic ratio Si:Al [3].
3
Moreover, geopolymers could be produced using as raw materials, industrial waste as fly ash and furnace slag or building wastes as bricks and tiles, all of them rich in Al2O3 and SiO2 in a non-crystalline form.
1.1 Generality on porous geopolymers
Several papers describe the production of porous components based on geopolymers borrowing the typical approach used in the cement industry to procedure aerated concrete, that is the addition to an aqueous geopolymer slurry of components (such as silica fume or Al powder) capable of generating
in situ gaseous H2 because of the oxidation reaction occurring with metallic Si
or Al in a highly alkaline environment [2, 4]. Another approach that has been proposed is the addition of peroxides, which decompose generating gas [5].
These approaches provide a suitable way of fabricating highly porous components, but when these processing routes are used the cells are typically closed, i.e., no interconnecting pores are present on the cell walls, thereby greatly limiting properties such as the permeability to liquids or gases of the component. Despite all these studies, little work has been devoted to the production of geopolymer foams in routes where open cells could be achieved.
Within this context, the objective proposed in this work was study and develop for the first time two alternative approaches: a Gelcasting Route (GCR), based on the presence of appropriate surfactants applied with mechanical stirring, and also a Gelcasting/Saponification/Peroxide combined route, using a triglyceride source which reacts in a basic medium to produce in situ surfactant
5
2 LITERATURE REVIEW
2.1 Geopolymers
A geopolymer is an inorganic binder, which is synthesized by mixing at ambient or slightly above temperatures (e.g. 90 °C) a reactive aluminosilicate powder (e.g. metakaolin, calcined clay, fly ash) with an alkaline activator that contains alkali hydroxide, silicates, aluminates, carbonates or sulphates, or a combination thereof (Figure 2.1). The reaction product consists mainly by an amorphous aluminosilicate phase due by interlinked SiO44- and AlO4 5-tetrahedral forming a 3D-structure [6].
Figure 2.1 Schematic diagram for geopolymer production [6].
6
Generally, the alkali activation is a hydration reaction that comprises dissolution and precipitation of aluminosilicates (precursors) in an aqueous solution of alkaline or alkaline earth metal, such as:
hydroxide (ROH, R(OH)2),
salts of weak acids (R2CO3, R2S, RF),
salts of strong acids salts (Na2SO4, CaSO4.2H2O), or silicate salts of type R2(n)SiO2,
where R is an alkaline ion such as Na, K or Li, or an alkaline earth such as Ca [3].
Considering the zeolite chemistry, Davidovits [1, 3] suggests several molar ratios and parameters that should be controlled, because they affect substantially the geopolymer properties like durability and mechanical strength:
Geopolymer mixture: 0.20 < Na2O/SiO2 < 0.48 3.30 < SiO2 /Al2O3 < 4.50 0.80 < Na2O/Al2O3< 1.60, being possible the replacement of Na by K or Li.
Water content in the mixture: 10.00 < H2O/Na2O < 25.00, also respecting the workability.
Curing temperature in the range 30-90 °C; Curing time in the range 6-96 hours.
7
the strong correlation with the Young’s modulus and large increases in mechanical strength [14], however, any effect on the microstructure of changing the alkali cations from Na to K was not observed [15].
In this way, different microstructures and properties observed and cited in the literature may be explained by the conceptual geopolymer reaction proposed model presented in Figure 2.2, which shows a highly simplified reaction mechanism for the geopolymerization [6].
8
Figure 2.2 outlines the reaction mechanism that occurs during the transformation of a solid aluminosilicate source into a synthetic alkali aluminosilicate. Once in solution, the species released by dissolution are incorporated into the aqueous phase, which may already contain silicate present in the activating solution [6]. Hence, a complex mixture of silicate, aluminate and aluminosilicate species is thereby formed, and the equilibrium within these solutions have been intensively studied [17-19].
Even though presented linearly, these processes are largely coupled and occur concurrently, where dissolution of the solid aluminosilicate source by alkaline hydrolysis (consuming water) produces aluminate and silicate species. It is important to note that the dissolution of solid particles at the surface resulting in the liberation of aluminate and silicate into solution has always been assumed to be the mechanism responsible for conversion of the solid particles during geopolymerization [20].
The geopolymerization reaction of a metakaolin in Na+ solution [1], is described, in seven steps, as follows:
Step 1: alkalination and formation of tetravalent Al in the side group
sialate -Si-O-Al-(OH)3-Na+
Step 2: alkaline dissolution starts with the attachment of the base
9
Step 3: disruption of the siloxane oxygen in Si-O-Si through: transfer
of the electron from Si to O, formation of intermediate silanol Si-OH and basic siloxo Si-O-
Step 4: further formation of silanol Si-OH groups and isolation of the
ortho-sialate molecule
Step 5: reaction of the basic siloxo Si-O- with the sodium cation Na+
and formation of Si-O-Na terminal bond
Step 6: (if waterglass* is present): condensation between
10
Step 7: further polycondensation into Na-poly (sialate-disiloxo) albite
framework with its typical feldspar chain structure
Despite this, the actual process of particle-to-gel conversion has never been confirmed in the highly alkaline and poorly solvated conditions as occurs during geopolymer synthesis. Thus, without of conclusive mechanistic understanding of solid particle conversion will be assumed the surface dissolution, as described in the model presented in Figure 2.2 [6].
2.1.1 Precursors
Aluminosilicates such as slag (obtained in blast furnaces), fly ash (obtained from the burning of coal in thermoelectric plants), volcanic ash (with natural thermal treatment) and powder tile or stone (passing through industrial furnaces) are potential starting materials for alkaline activation, because they have a prior heat treatment [1].
11
these changes, the material loses much of its crystalline structure, getting a substantially amorphous state of high entropy, increasing their tendency to combine chemically [1, 3].
One important aspect to be observed in these materials is the very low or almost zero amount of calcium, not entering the traditional line of binders where calcium, as in Portland cement, has a prominent role [1, 3].
2.1.2 Activators
The most common alkaline activators used to obtain geopolymeric materials are sodium or potassium hydroxide, potassium carbonate, sodium or potassium silicates, and especially mixtures thereof [1].
2.1.3 Geopolymers to medium-high temperature applications
In several studies, it has been observed a high degree of thermal stability of geopolymers, especially in K-polisialates with melting temperature in the range of 1400 °C [21]. However, geopolymers for application at temperatures between 1000 and 1200 °C were also obtained with sodium activators for applications such as thermal insulators [22].
2.2 Ceramic foams (filters)
12
The most commonly encountered advantages of ceramic filters, when compared to other membrane types used in pressure driven membrane processes, include the following [24, 26]:
long and reliable working lifetime
resistance to high temperatures across the entire pH range excellent chemical stability
corrosion and abrasion resistant
bacteria resistant and, frequently, bio inert compatibility with highly viscous fluids enhanced ease of cleaning and sterilization
Ceramic filters are used, among the most mature filtration technologies, in the pressure-driven membrane processes for liquid separations, and are generally classified into four categories, according the size of the materials which should be retained:
Nanofiltration (0.005–0.0005 µm) Ultrafiltration (0.1–0.001 µm) Microfiltration (0.05–10 µm)
Regarding the materials which are made, the most common ceramic membranes are produced of Al, Si, Ti, or Zr oxides, but also with other materials including non-oxides (carbides, borides, nitrides, silicides) and with combinations thereof.
Specifically for food and pharmaceutical applications, membranes made of Al, Zr, and Ti oxides are suitable, since they meet the US Food and Drug Administration (FDA) requirements detailed in 21 Code of Federal Regulations (Good manufacturing practices) [24].
13
membranes, using kaolin as starting material with other additives, as quartz and calcium carbonate, for industrial applications [27-29].
2.3 Industrial applications of ceramic filters
Initially, ceramic filters were developed for uranium enrichment and were also used in wastewater treatment. Over the past years, successful solutions and possible applications covered all industries and ceramic filters are increasingly being used in industries such as biotechnology and pharmaceutical, dairy, food and beverage, as well as chemical and petrochemical, microelectronics, metal finishing, and power generation [24].
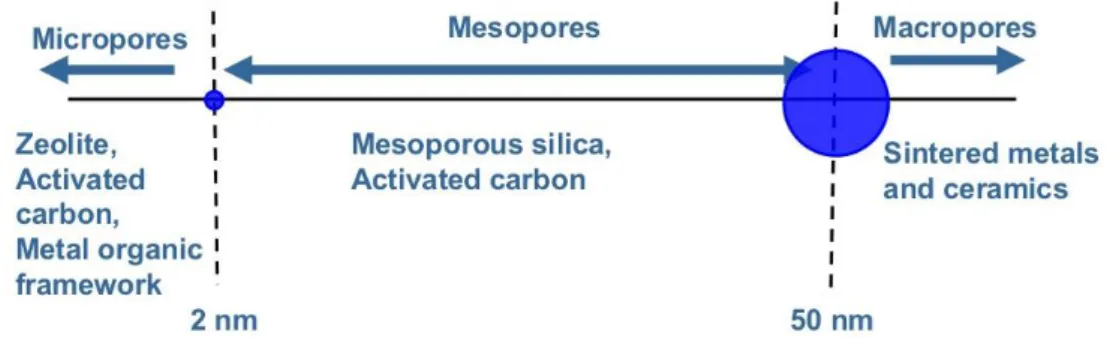
Figure 2.3 shows the classification of porous materials by pore size according IUPAC standard.
Figure 2.3 Classification of porous materials by pore size according IUPAC standard [25].
14
technologies such as coalescers and oil skimmers. Furthermore, many polymeric membranes are unsuitable due to their limited stability in aggressive chemical environments such as highly contaminated oily wastewater (e.g., lube oils, petroleum fractions) as previously mentioned [24].
Once geopolymers can be used to replace ceramic components in several applications, it is possible to extend and apply this concept to the development of a new class of inorganic (geopolymer) membrane, with the same low cost clay-based presented earlier [29]. Also, specifically related to radioactive wastewater treatment, geopolymers behave similarly to zeolites, materials which are known for their abilities to adsorb toxic chemistry wastes. In the case of geopolymers, their three dimensional framework is responsible by locking the hazardous elements contained in the waste [3].
As the field of application for these materials varies widely, the final properties of the filter in a particular application are also diverse. Consequently, the search for the different routes to produce these foams such as, the replica technique, the sacrificial template method and the direct-foaming technique, each having its own set of properties, has attracted interest from the academic world [33].
2.4 Processing routes t o macroporous ceramics
Ceramic properties can be tailored for each specific application by controlling the composition and microstructure of the porous ceramic. Changes in open and closed porosity pore size distribution, and pore morphology can have a major effect on a material’s properties. All of these microstructural features are in turn highly influenced by the processing route used for the production of the porous material.
15
Figure 2.4 Scheme of possible processing routes used for the production of macroporous ceramics [33].
2.4.1 Replica technique
16
2.4.2 Sacrificial template method
The sacrificial template technique usually consists of the preparation of a biphasic composite comprising a continuous matrix of ceramic particles or ceramic precursors and a dispersed sacrificial phase that is initially homogeneously distributed throughout the matrix and is ultimately extracted to generate pores within the microstructure. This method leads to porous materials displaying a negative replica of the original sacrificial template, as opposed to the positive morphology obtained from the replica technique described previously.
2.4.3 Direct foaming method
In direct foaming methods, porous materials are produced by incorporating air into a suspension or liquid media, which is subsequently set in order to keep the structure of air bubbles created. In most cases, the consolidated foams are afterwards sintered at high temperatures to obtain high-strength porous ceramics.
17
To avoid this, surfactants can be used as surface-active agents for the stabilization of wet foams, because they stabilize the liquid-gas interface decreasing the surface tension of the system. These long-chain amphiphilic molecules adsorb at the gas bubble surface with their hydrophilic tail in contact with the aqueous phase. The foaming ability of a surfactant is related to its effectiveness to lower the interfacial energy or the surface tension at the gas-liquid interface. Surfactants are classified, according to the nature of the hydrophilic group, as anionic, cationic, non-ionic, and amphoteric [36].
In the case of a slurry containing geopolymer precursors, which has several ions in solution (K+, Al3+, Fe3+, SiO42-), non-ionic surfactants have a more pronounced effect since they possess hydrophilic groups without electric charges. The type of surfactant can influence the cell size, size distribution and degree of interconnection among adjacent cells (open/closed cell ratio). The wet foam can be rapidly gelled simply by exploiting the kinetic of geopolymerization reaction itself in a temperature higher than at room temperature, with no need for organic monomers or other stabilization/gelling additives.
2.5 Saponification
As it is well known, the hydrolysis of fat or oil in alkaline medium produces glycerol and fatty acid salts (soap) for cleaning purpose, for example, and the reaction is called saponification [37]. An example of the saponification of a triglyceride with KOH to form a mixture of potassium carboxylates (soap) and glycerol is showed in reaction 2.1.
18
As suggested in the equation, soap is a salt composed of a mixture of carboxylate anions, due a variety of fatty acid residues in each triglyceride molecule, and a univalent cation provided by the alkaline medium.
Concerning the saponification reaction, one important analytical chemical parameter explored here, which should be quoted, is the saponification value (SV), that is linked to the average molecular weight of all fatty acids and represents the quantity in grams of potassium hydroxide required to saponify 1 g of oil [38].
Also, in the present work, this parameter (SV) was used to determine the amount of KOH which should be add with the oil to ensure the in situ
formation of surfactant molecules by the saponification reaction.
2.6 Triglycerides sources
Vegetable oils and fats are mainly constituted of triglycerides that consist of one molecule of glycerol combined with three molecules of fatty acids. These latter contain a long chain of carbon atoms, linked by single bonds and combined with hydrogen, ending with carboxyl group. Fatty acids are almost entirely straight chain aliphatic carboxylic acids. The broadest definition includes all chain lengths, but most natural fatty acids are C4 to C22, with C18 most common. Besides that, fatty acids can be divided into two classes: saturated and unsaturated. In the latter one or more couples of two adjacent carbon atoms are linked by a double bond. If there is more than one double bond, the fatty acid is polyunsaturated, as compared to monounsaturated when there is only one double bond [38].
19
Taking into account how the saponification reaction was applied here, there are some important attributes which represents a different aspect of the produced soap [40].
Bubbly lather: refers to the soap’s ability to lather up and get bubbly. Higher values will tend to produce fluffy foam rather than creamy foam with little or no bubbles, usually in the range from 14 to 46.
21
3 MATERIALS AND METHODS
This section presents all materials used to obtain the geopolymer composition (precursors and activators) and also the additives applied in the two proposed routes (GCR and GCSPCR) in order to promote the porosity (pore agents).
Basically, the pore agents used were commercial non-ionic surfactants for the GCR and triglycerides sources for the GCSPCR which were responsible to generate in-situ surfactant due the saponification reaction.
3.1 Materials
3.1.1 Gelcasting route (GCR)
Experiments were carried out using as geopolymer precursors metakaolin obtained from the calcination at 750 °C for 6 hours in a muffle of kaolin (Minasolo - Minerals and Abrasives Grains (Brazil)), metakaolin HP Ultra (Metacaolim do Brasil (Brazil)), fly ash class F (#200 mesh; Tractebel Energia (Brazil)), and as alkaline activators commercial sodium hydroxide, potassium hydroxide KOH pellets (85% purity, Dinâmica Química Contemporânea Ltda (Brazil)), sodium silicate (Si/Na = 3.30, density = 1.39, viscosity = 420 cP, and potassium silicate (Si/K = 2.05, density = 1.38 g/l, viscosity = 430 cP; Una Prosil - Usina Nova América (Brazil)). Considering the high content of iron oxide (Fe2O3) present in the fly ash (10.2 wt%), a maximum addition of 30 wt% of fly ash with respect to metakaolin was used, because, as quoted by Lloyd et al. [5], during alkaline activation iron dissolves from iron-rich fly ash particles and forms either crystalline or colloidal hydrates.
In order to decrease the viscosity of the suspension, polyacrylic acid (Dolapix CE-64, Zschimmer & Schwarz) was used.
22
monooleate - C64H124O26 (VWR BDH Prolabo) and Triton X-100, a Polyethylene glycol tert-octylphenyl ether - C14H22O(C2H4O)n ,n = 9-10 (Sigma-Aldrich).
3.1.2 Gelcasting/Saponification/Peroxide Combined Route (GCSPCR)
For this route, samples were produced using the same raw materials described previously (GCR), up to the surfactant addition. Other components were also used as sources of different triglycerides: sunflower oil, olive oil, babassu oil, coconut oil, castor oil, palm stearin, bovine lard, soybean biodiesel and hydrogen peroxide (10 vol.), to contribute to the macro-pore formation.
With the aim to show the efficiency of the proposed technique, sunflower oil foams were also produced with i) the addition of oil but no
hydrogen peroxide (saponification reaction) and ii) with the addition of hydrogen
peroxide but no oil (peroxide reaction). To make this comparative test, hydrogen peroxide and sunflower oil were added always in the same amounts specified previously.
3.2 Methods
Since the experimental development proposed here was done in three steps as follows:
First step (Brazil): was done all initial characterization of raw materials and formulation of the geopolymer, presented in Appendix A;
Second step (Italy): studied and applied the gelcasting route (GCR) in order to obtain open-cell geopolymer foams;
23
All methodology will be present and discussed according the two routes studied.
In the same way, always according the applied route, were evaluated some physical properties of the geopolymer foams, without any comparative intent, but to understand and set the process parameters and respective effect on the reached properties in each route.
3.2.1 Gelcasting route (GCR)
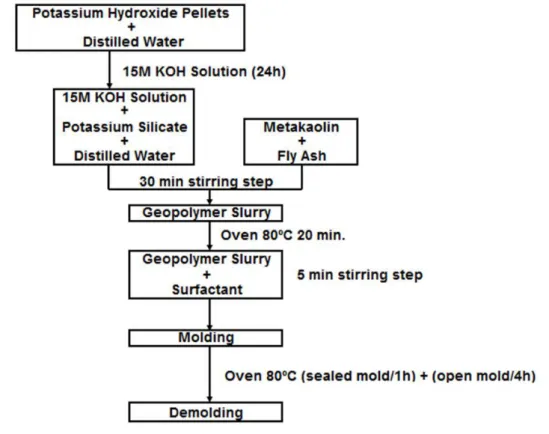
The first step in the preparation the geopolymer foams was the preparation of a 15 M KOH solution, which should be used after 24 hours [41]. Then, a solution of potassium-based activators and distilled water was prepared in a mixer (500 rpm, 30 minutes, Ika-Werke Ost Basic, Staufen, Germany), following the oxide molar ratios presented in Table A.5. To this solution, Dolapix CE-64 was added (0.32 wt% on the total weight). Then, MSMK and FA were added at room temperature to the activator solution, stirring at 1000 rpm for 30 minutes, producing suspensions with a solid content ranging from 61 to 71 wt%. The geopolymer precursor suspension was placed in an oven at 80ºC for 20 minutes to initiate the geopolymerization reaction, which is the key to enabling the retention of porous morphology of the wet foam subsequently produced. Thereafter, the suspension was removed from the oven and stirred again while adding dropwise one of the surfactants.
Surfactant addition ranged from 2 to 4 wt% with respect to total weight, and the suspension was stirred at different mixing velocities (800, 1500 and 2000 rpm for 5 minutes) in order to generate wet foams by the entrapment and stabilization of air bubbles.
24
The sample was then removed from the plastic bag and left at 80 °C for further 4 hours. It should be noted that the samples were characterized as prepared, and were not subjected to any heat treatment at high temperature.
Figure 3.1 Porous geopolymer sample after demolding: a) permeability test; b) mechanical strength test.
Figure 3.2 shows the flowchart of process used for fabricating geopolymer foams by gelcasting.
25
Geopolymer foams were heat treated in a tube furnace (Carbolite CWF1200, Derbyshire, UK) at 700 and 1200 °C in air with heating rate of 2 °C/min, dwelling time of 2 h and cooling rate of 10 °C/min, in order to assess how the physical properties of the geopolymer foams were affected by the thermal treatment.
3.2.1.1 Total and open porosity
The bulk density of the geopolymer foams was computed by dividing the mass of foam cut into a parallelepiped divided by its geometric volume measured, with a caliper. The total pore volume (𝑃) was obtained based on the equation 3.1, where ρ0 is the true (skeleton) density of the pore-free solid material [43], measured with an helium pycnometer (Accupyc 1330, Micromeritics, Norcross, GA), and also, the open porosity was quantified by “Archimedes” Principle.
𝑃 = 100 × (1 −𝜌𝜌
0) (3.1)
3.2.1.2 Mechanical strength
26
3.2.1.3 Permeability
The air-permeation behavior of porous geopolymers was investigated at room temperature using a laboratory-made air permeator (Figure 3.2) at the Istituto Nazionale di Fisica Nucleare, Laboratori Nazionali di Legnaro (INFN-LNL), Italy, which is based on an action-response device, making a correlation between the pressure drop applied across a porous medium and the resulting flow rate or velocity of the fluid output [44].
Figure 3.3 Laboratory-made air permeator used to measure the permeability of the porous geopolymers.
27
3.2.1.4 Morphological analysis
The morphology of the foams was investigated using an optical stereoscope (Wild Heerbrugg, Type 376788, coupled with a digital camera) and a Scanning Electron Microscopy (SEM, FEI Quanta 200, Hillsboro, Oregon, USA).
The pore size distribution was evaluated from the acquired images using the Axio Vision 4.8.2 LE image processing software (Carl Zeiss, Oberkochen, Germany).
Values obtained by image analysis were converted to 3D values using the stereological equation (3.2), in order to determine the effective cell-size [45] and present these data in Figures 4.8, 4.9, 4.23, 4.25, 4.27 and 4.29.
𝐷𝑠𝑝ℎ𝑒𝑟𝑒 = 𝐷0.785𝑐𝑖𝑟𝑐𝑙𝑒 (3.2)
3.2.1.5 Specific surface area
The Brunauer-Emmett-Teller specific surface area (SSA) was determined by multipoint BET method using the adsorption data in the relative pressure (P/P0) range 0.05–0.3 obtained by a Quantachrome Nova Station A (Quantachrome Instruments, Boynton Beach, USA).
All the samples were degassed at 300 °C prior to nitrogen adsorption measurements.
3.2.1.6 Linear thermal shrinkage
28
3.2.1.7 TG/DTA analysis
TG/DTA analysis was performed by a Simultaneous Thermal Analyzer (STA 409, Netzsch, Selb, DE) up to 1400 °C in air with heating rate of 10 °C/min.
3.2.2 Gelcasting/Saponification/Peroxide Combined Route (GCSPCR)
When the vegetable oil is added to the highly alkaline geopolymer suspension (pH ~9.5), it generates in situ carboxylate surfactants (soap
molecules) through the saponification reaction, which consists of the hydrolysis of the triglycerides found in oils or fats, plus glyceride, a water soluble molecule (glycerol) which can be extracted by water after the curing process [63]. While previous work exploited the formation and extraction of glycerol to create micro- and meso-pores increasing the specific surface area of the material, we used the surfactant molecules (produced in situ) to generate stable wet macrocellular
foam with interconnected porosity, obtained by stirring (direct foaming, aided by the gas generated from the decomposition of the peroxide, followed by gelcasting to set the structure).
For this route, samples were produced using the same raw materials described previously (GCR), up to the surfactant addition. Thereafter, the suspension was removed from the oven and then 25 wt% of triglyceride source (oil or fat) and respective amount of KOH solution, considering the SV, were added, mixing at 500 rpm for 5 minutes. Then, the combined suspension was placed in an oven at 80ºC for 30 minutes, being stirred again at 1500 rpm for 5 minutes, and then 6 wt% of hydrogen peroxide was added.
Finally, the geopolymer foam was cast in a polystyrene mold and placed for 1h at 80 ºC into an oven after sealing it into a plastic bag, and then removed from the plastic bag and left at 80 °C for further 4 hours.
29
Figure 3.4 Schematic diagram for the production of geopolymer foams by Gelcasting/Saponification/Peroxide Combined Route [46].
Prior to the characterization, the glycerol generated by the saponification reaction was extracted by hot water exchanging it every 30 minutes until it remained clear, visually indicating complete extraction. This step of the extraction of glycerol can also be used to confirm the extent of the geopolymerization reaction, since non-fully condensed geopolymer materials are sensitive to water and undergo swelling or complete destruction [3]. Also, glycerol and others organic compounds could be extract by heat treatment.
To this route, the same set of physical properties evaluated in gelcasting route was performed, only changing the equipments, since this study was completed in Brazil.
30
3.2.2.1 Total and open porosity
To this route, total and open porosity were evaluated in the same manner of the GCR.
3.2.2.2 Mechanical strength
The compressive strength of as prepared samples was determined using a Universal Testing Machine (Instron 5500R, Canton, Massachusetts, USA), with a constant crosshead displacement of 1 mm/min. At least 5 specimens per type were tested.
3.2.2.3 Permeability
Likewise to the GCR, the air-permeation behavior was investigated at room temperature using a laboratory-made air permeator at University of Ribeirão Preto / UNAERP (Brazil).
3.2.2.4 Morphological analysis
31
3.2.2.5 Specific surface area
The Brunauer-Emmett-Teller specific surface area (SSA) was determined by multipoint BET method using a Quantachrome Nova 1000e (Quantachrome Instruments, Boynton Beach, USA).
3.2.2.6 Linear thermal shrinkage and TG/DTA analysis
33
4 RESULTS AND DISCUSSIOIN
As presented in the Materials and Methods section, the achieved results will be also presented according the used route.
4.1 Gelcasting route (GCR)
4.1.1 Total and open porosity
With the aim of producing components possessing a high amount of total porosity, first was evaluated the influence of the solid content (with real density of 2.192 g/cm3, measured with a helium pycnometer Accupyc 1330, Micromeritics) in the slurry, maintaining fixed all other parameters to a specific value, which was set according to preliminary optimization experiments (surfactant content = 2 wt%; mixing speed = 1500 rpm).
In Figure 4.1 the presented data indicate that, as expected, with increasing the solid content in the suspension a reduction in total porosity occurred for both types of surfactant, because of the increase in viscosity in the slurries. We can observe that Triton X-100 appeared to be more effective in incorporating and maintaining a large amount of gas into the liquid, which led to a larger amount of total porosity after gelling and drying. This behavior is certainly related to the difference in the chemical structure of the two surfactants, but further investigations are necessary to determine the accurate acting mechanism and others differences among them.
34
Considering these aspects, Gibbs and Marangoni [47] proposed two theories of elasticity for surfactant solutions, both dealing with the surface elasticity effect caused by different mechanisms. In this sense, surfactants with different chemical structure and foaming properties can notably influence the microstructure of porous scaffold prepared by the direct foaming method.
Figure 4.1 Effect of solid content in the slurry on total porosity. All samples were produced using 2 wt% of surfactant and mixing at 1500 rpm mixing speed.
35
stress in the suspension at higher rotational speed, which resulted in a lower total volume of entrapped air into the suspensions [48-50].
As far as the amount of surfactant was concerned, the data indicate that, regardless of the mixing speed used, an average increase in total porosity was achieved when passing from 2 to 4 wt% of surfactant addition, which was of 10% for samples produced using Tween 80 and of 15% for those made using Triton X-100. Increasing the surfactant concentration favors its adsorption at the gas/liquid interface and decreases the surface tension, thereby promoting foaming.
For a certain concentration of surfactant (Cmax), the surface tension is minimal and foaming is maximum. This concentration is close to the critical micelle concentration (CMC), which represents the minimal surfactant quantity to reach the minimal surface tension. For higher concentrations, the surface tension remains minimal, but the addition of more surfactant will generate an increase in the viscosity of the system, which inhibits the foaming effect [51].
Figure 4.2 Effect of rotation speed and surfactant content in the slurry (solid content set at 68 wt%); a) 2 wt% surfactant; b) 4 wt% surfactant.
36
structure and foaming ability can influence the microstructure of porous geopolymers fabricated by gelcasting.
Figure 4.3 Relation between total porosity and open porosity estimated by the Archimedes Principle; surfactant content set at 2 wt% (a) and 4 wt% (b).
It is also important to observe that the processing parameters (slip rheology, foam volume, type of surfactant, idle time prior to polymerization, and other features) affect also the ratio between open and closed cells in the foams [56, 57]. Moreover, foams with different characteristics (total porosity, average
Tween 1500 rpm Tween 2000 rpm Triton 1500 rpm Triton 2000 rpm 40.0 50.0 60.0 70.0 80.0
a)
Total Porosity Open Porosity
(vo l% ) Tween 1500 rpm Tween 2000 rpm Triton 1500 rpm Triton 2000 rpm 45.0 55.0 65.0 75.0 85.0
b)
Total Porosity Open Porosity
(vol
37
cell size and size distribution) possess a different average strut thickness, which results in different mechanical properties.
The heat treatment at 700 °C had no pronounced effect on the total porosity, as shown in Figure 4.4 for samples prepared using 2 wt% (a) and 4 wt% (b) of surfactant, respectively. However, increasing the heat treatment temperature to 1200 °C led to a ~6.0 to 20.0 vol% decreases in the total porosity, depending on the type and content of surfactant.
38
4.1.2 Mechanical strength
The correlation between compressive strength, relative density and total porosity of the geopolymer foams is shown in Figure 4.5. For samples produced using 2 wt% of Tween 80 (Figure 4.5a), an increase of ~41% in the compressive strength (from 2.35 to 3.32 MPa) was observed when the total porosity decreased ~6% (from 66 to 62%). This decrease on the total porosity was accompanied by a ~18% increase of the relative density (from 0.75 to 0.85). Also, samples produced using 2 % of Triton X-100 as a surfactant had a similar behavior, with similar changes in property values: ~40% increase (from 1.94 to 2.72 MPa) for the compressive strength; ~10% decrease (from 69 to 61%) for the total porosity, and ~26% increase (from 0.69 to 0.87) for the relative density.
39
the strength of samples produced with 2 wt% of Tween 80 (2000 rpm) indicate an increase of ~14% in the compressive strength (from 3.32 ± 0.40 to 3.97 ± 0.40 MPa) and ~184% (from 3.32 ± 0.40 to 9.44 ± 0.30 MPa) after heat treatment at 700 and 1200 °C respectively.
Figure 4.5 Correlation among compressive strength, relative density and total porosity of geopolymer foams not heat treated: (a) 2 wt% of surfactant; (b) 4 wt% of surfactant.
4.1.3 Permeability
40
porous media for a wide range of fluid velocities [58]., and the permeability coefficients k1 (Darcian) and k2 (non-Darcian) were evaluated according to
Forchheimer’s equation [44, 59]:
∆𝑃 𝐿 =
𝜇 𝑘1𝑣𝑠+
𝜌 𝑘2𝑣𝑠
2 (4.1)
where L is the medium thickness along flow direction, vs is the superficial
velocity, µ is the absolute viscosity, ρ is the fluid density, k1 (Darcian) and k2
(non-Darcian) the permeability coefficients.
According to the equation 4.1 the term µvs/k1 represents the viscous
effects of the fluid-solid interaction, whereas the term ρv2
s/k2 represents the
kinetic effects [59]. Fluid loses energy by friction between the molecules of the fluid during draining; in this case, the higher the viscosity of the fluid (µ), the
greater the friction will be and consequently the conversion of pressure energy into heat. Usually, the increase in area is associated with the reduction of particle size for granular structures or of pore size for cellular structures [59]. Besides that, any change in the processing parameters, which leads to an increase of the interconnected porosity and pore size, or the decrease of pore tortuosity and roughness, will lead to higher values of k1 and k2 [44].
Derived from the Kozeny–Carman or Ergun relationships [44], notwithstanding the limited validity for specific porous medium properties, the typical proportionalities between porosity P and the coefficients k1 and k2 may
be described by the following relations (4.2 and 4.3):
𝑘1 ∝ 𝑃
3
(1−𝑃)2 (4.2)
𝑘2 ∝ 𝑃
3
(1−𝑃) (4.3)
41
compared in Figure 4.6, as a function of open porosity. In Figure 4.6(a), for samples produced using a surfactant addition of 2 wt%, we can observe that an 8% increase in the open porosity (from 50 to 54%) led to a 2 and 3 orders of magnitude increase in k1 and k2 values, respectively, when using Tween 80.
Likewise, when using Triton X-100 as a surfactant, a ~16% increase (from 43 to 50%) in the open porosity also led to an increase of 2 and 3 orders of magnitude in k1 and k2 values.
Considering a surfactant addition of 4 wt%, Figure 4.6(b), an increase of ~6% in the open porosity (from 54 to 57%) led to an increase of 1 and 2 orders of magnitude in k1 and k2 values, respectively, when using Tween
80. Similarly, an increase of ~12% in the open porosity (from 51 to 57%) led to an increase of 1 order of magnitude for both, k1 and k2 values, when using
Triton X-100 as a surfactant. This increase in the k1 and k2 values can be
42
Figure 4.6 Permeability constants (k1, k2) of geopolymer foams not heat
treated, produced with different surfactants (type and content) and different mixing speeds, as a function of open porosity estimated by the Archimedes Principle. (a) 2 wt% of surfactant; (b) 4 wt% of surfactant.
As shows Figure 4.7, these geopolymer foams present similar permeation behavior to those ceramic foams obtained by gelcasting, being suitable to replace ceramic components for use in filtration or adsorption applications.
43
Figure 4.7 Location of k1 and k2 data obtained thought the permeability
measure, for geopolymer foams obtained by the gelcasting route in a comprehensive permeability map [44].
4.1.4 Morphological analysis
44
45
A similar decrease in D50 value (~25%, from 555 ± 90 to 453 ± 86 µm for samples made using Tween 80 and ~ 13%, from 530 ± 113 to 459 ± 90 µm for samples made using Triton X-100) occurred also for samples produced using a surfactant amount of 4 wt% (see Figure 4.9). This effect was also observed when producing liquid foams, and considering the stresses applied to the slurry by the mechanical shearing processes the Taylor model can be used to explain the rheological behavior and respective cell size obtained [52-54].
This model illustrates that, when an isolated, spherical droplet of radius R0 with a relatively low viscosity ηd is dispersed in a fluid of higher
viscosity ηc, the droplets will deform into an ellipsoid or elongated cylinder. Ordinarily, the rupture of these elongated cylinders in smaller droplets is achieved when reaching the so-called Rayleigh instability, which reduces the high interfacial energy possessed by the elongated droplets. Deformation of the dispersed phase only takes place when the shear stress ηcγ exceeds the interfacial stress σ/R0, where γ is the shear rate and σ is the interfacial tension.
The ratio between these two stresses is defined by the capillary number (Ca). When the capillary number overcomes a critical value Cacrit, the elongated droplet will rupture into smaller droplets of average radius R
according to equation (4.4). In this sense, Cacrit depends on the viscosity ratio between the dispersed and continuous phase (ηd/ηc) and the type of flow [54, 55].
46
47
This model has also been applied for the prediction of bubble size as a function of suspension composition for both, particle-stabilized emulsions and surfactant stabilized emulsions [55].
Secondly, it is possible to observe an inverse relation between the average cell size and the relative density, as shown by Figure 4.10 for a definite set of processing conditions. Specifically, at the same mixing speed of 1500 rpm, increasing the surfactant amount from 2 to 4 wt% increased the D50 nearly by 61% for samples produced using Tween 80, and about by 15% for samples produced using Triton X-100, while at the same time the relative density decreased by 20% and 28%, respectively. Also, the number of macropores increased further and the mean pore diameter also increased, causing the majority of pores to share pore edges and the interconnectivity to increase.
This behavior is related to the increased foam volume obtained after stirring a slurry with 4 wt% of surfactant with respect to a slurry with 2 wt% of surfactant, processed at the same mixing speed. In this work, an increase in the volume of the wet foam on the order of 2 and 3 times with respectively 2 wt% and 4 wt% surfactant content was observed for both surfactants, regardless of the mixing speed. The volume of the wet foam is the first indication that the greater the volume obtained in the foam is, the greater the average pore size becomes [54].
48
Figure 4.10 Effect of surfactant content on the average cell size (𝑑𝑠𝑝ℎ𝑒𝑟𝑒) and its relation with the relative density of samples (solid content set at 68 wt% and mixing speed at 1500 rpm).
Figure 4.11 shows SEM images of the microstructure of geopolymer foam not heat treated obtained from the slurry with 68 wt% solids, 2 wt% Tween 80 surfactant and stirred at 2000 rpm, where it is possible to observe the presence of spherical and interconnected cells and dense struts.
Tw ee n 2w t% Tw ee n 4w t% Tr ito n 2w t% Tr ito n 4w t% 0.40 0.50 0.60 0.70 0.80 0.90 200 300 400 500 600 700 Relative Density Cell Size
49
Figure 4.11 Morphology of geopolymer foam not heat treated obtained from slurry with 68 wt% solids, 2 wt% surfactant Tween and stirred at 2000 rpm. (a) lowest magnification; (b) and (c) intermediate magnification in different regions; and (d) highest magnification.
4.1.5 Specific surface area
![Figure 1.1 Overall framework of the applications according to the atomic ratio Si:Al [3]](https://thumb-eu.123doks.com/thumbv2/123dok_br/15694003.627757/36.892.156.696.148.876/figure-overall-framework-applications-according-atomic-ratio-si.webp)
![Figure 2.4 Scheme of possible processing routes used for the production of macroporous ceramics [33]](https://thumb-eu.123doks.com/thumbv2/123dok_br/15694003.627757/49.892.167.768.146.665/figure-scheme-possible-processing-routes-production-macroporous-ceramics.webp)

![Figure 3.4 Schematic diagram for the production of geopolymer foams by Gelcasting/Saponification/Peroxide Combined Route [46]](https://thumb-eu.123doks.com/thumbv2/123dok_br/15694003.627757/63.892.189.736.136.582/figure-schematic-production-geopolymer-gelcasting-saponification-peroxide-combined.webp)