European Journal of Remote Sensing
An official journal of the Italian Society of Remote Sensingwww.aitjournal.com
Assessing the effectiveness of RapidEye multispectral
imagery for vegetation mapping in Madeira Island
(Portugal)
Andrea Massetti1,2*, Miguel Menezes Sequeira2, Aida Pupo2, Albano Figueiredo2,3,
Nuno Guiomar4 and Artur Gil2,5
1Department of Civil Engineering, 23 College Walk, Monash Univesity, 3800,
Melbourne, VIC, Australia
2Madeira Botanical Group, Faculty of Life Sciences, University of Madeira, 9020-105 Funchal, Portugal 3Departamento de Geografia / Centro de Estudos em Geografia e Ordenamento do Território
(CEGOT), Faculdade de Letras, Universidade de Coimbra, 3004-530 Coimbra, Portugal
4ICAAM - Instituto de Ciências Agrícolas e Ambientais Mediterrânicas, Universidade de Évora,
Núcleo da Mitra, 7006-554 Évora, Portugal
5CE3C - Centre for Ecology, Evolution and Environmental Changes; Azorean Biodiversity Group,
Department of Biology, University of the Azores, 9501-801 Ponta Delgada, Portugal *Corresponding author, e-mail address: [email protected]
Abstract
Madeira Island is a biodiversity hotspot due to its high number of endemic/native plant species. In this work we developed and assessed a methodological framework to produce a RapidEye-based vegetation map. Reasonable accuracies were achieved for a 26 categories classification scheme in two different seasons. We tested pixel and object based approaches and the inclusion of a vegetation index band on top of the pre-processed RapidEye bands stack. Object based generally showed to outperform pixel based classification approaches except for linear or highly scattered classes. The addition of a vegetation index to the workflow increased the separability of the Jeffrey-Matusita least separable class pairs, but not necessarily the overall accuracy. The Pontius accuracy assessment highlighted class specific accuracy tradeoffs related to different combinations of the inputs and methods. The approach to be used, in conclusion, should be carefully considered on the basis of the desired result.
Keywords:
Land cover mapping, biodiversity assessment, land use assessment, oceanicisland.
Introduction
facing the coasts of the African continent and the Iberian Peninsula. The archipelagos share a common geologic origin and several fauna and flora elements [Fernández-Palacios et al., 2011]. Madeira Island is also considered part of the Mediterranean basin biodiversity hotspot [Medail and Quezel, 1997] mainly due to the high degree of endemism and the presence of Laurisilva, a laurel forest whose most representative species are nowadays occurring only in Macaronesia. Madeira’s Laurisilva, representing the world widest continuous and better conserved patch [Fernández-Palacios et al., 2011], was named in 2009 World UNESCO Heritage [World Heritage Committee, 2009] and is protected under the Natural Park of Madeira framework. Despite the conservation efforts, human influence led to a conspicuous recession of these native/endemic species, with the substitution by exotic, invasive and sin-anthropic species [Capelo et al., 2004]. Human development is not the only cause for relevant changes in land cover. Madeira is subject to violent catastrophic events such as landslides with debris streams after winter season flash-floods [Lira et al., 2011, 2013] and large wildfires, when the annual grass and the seasonal shrubs curing levels turn them in an extremely flammable fuel [Nasa Visible Earth, 2010; Fontinha et al., 2014]. Since the year 1803 flood (which caused 800-1000 casualties) at least 30 main events of this kind followed, with the most disastrous of our century being dated on 20 February 2010; the flood caused 45 casualties and temporary streams with a range of 200-600 m3 s-1 of debris transportation (maximum peak of 663 m3 s-1 in Ribeira Brava basin) [Fragoso et al., 2012].
Wildfires can sensibly affect main land cover changes, favoring the spread of certain exotic species which are on one hand, in critic periods, a more flammable fuel than endemic species and on the other, a more aggressive colonizer during the recovery [Fontinha et al., 2014]. During the eighth Convention on Biological Diversity in Brazil it was in fact established that among the main threats in small islands to sustainable development, nature conservation and biodiversity maintainability, there are the climate variability and changes, the proliferation of invasive exotic species, the increasing growth of tourist activity, the natural catastrophes and the overexploitation of natural resources [CBD, 2006]. Remote
Sensing data is optimal for vegetation mapping at various scales of interest, as well as time
oriented studies demonstrated that artificial bands derived from combinations of satellite data can be more correlated to certain vegetation characteristics than the reflectance values originally acquired by the sensor. For example Beckschäfer et al. [2014] showed higher correlation of vegetation indices and texture bands retrieved from RapidEye product with the Leaf Area Index than its own bands. Lu [2014] found higher correlation of forest stand structure and aboveground biomass to an artificially calculated texture band than to the reflectance bands used for its calculation. Thus, although the data becomes redundant in the set, it has been demonstrated that the implementation of a calculated band in a multi-spectral dataset improves the final classification accuracy [Schuster et al., 2012; Adelabu et al., 2014; Buck et al., 2015; Godinho et al., 2016]. Due to the high spatial resolution of RapidEye multispectral imagery (6.5 m), and a set of channels strategically positioned for vegetation oriented analysis [Dube et al., 2014], the image processing and classification procedures of this type of remote sensing data can be approached either as pixel oriented or object oriented. A pixel oriented approach enables the possibility not to lose any spatial information, classifying every pixel in the scene; an object oriented approach consists in one additional preliminary step before the classification which clusters the pixels in segments. A segment is a group of spatially adjacent and spectrally similar pixels which, once filtered, will assume a unique spectral value (per band) with a decrease of complexity for the classifier [Blaschke, 2010]. This research paper proposes and describes a methodological framework which aims to produce a high spatial resolution vegetation map with a specific focus on natural vegetation of Madeira Island (Archipelago of Madeira, Portugal), especially its native/endemic and invasive vegetation patches, through the use of pixel-based and segment-based supervised classifications of RapidEye multispectral bands
and derived vegetation indices.
Materials and methods
Study AreaThe Archipelago of Madeira is located in the biogeographic region of Macaronesia. It includes the islands of Madeira and Porto Santo, as well as the Selvagens islets. Madeira Island (32°38′49.96″N 16°54′29.59″W / 32.6472111°N 16.9082194°W) has an extension
of 742 km2. From a geological perspective, the archipelago formation is considered due
most recent models [Aguiar et al., 2004; Costa et al., 2012] the natural potential vegetation of Madeira corresponds to the following climatophyllous series:
1) Mayteno umbellatae-Oleo maderensis sigmetum (series of madeiran oleaster tree), inframediterranean, termophyllous on rocky biotopes, surviving in scarce mosaics in steep ravines (south face up to 200 m a.s.l.);
2) Helichryso melaleuci-Sideroxylo marmulanae sigmetum (series of marmulano tree), microforest in inframediterranean (north face 0 to 80 m a.s.l., south face, 200-300 m a.s.l.), scarcely represented on current vegetation;
3) Semele androgynae-Apollonio barbujanae sigmetum (mediterranean laurel/ barbusano-tree forest series), thermophillous, infra- and thermomediterranean forest, nowadays mostly destroyed (South 300-800 m a.s.l., North 50-450 m a.s.l.);
4) Clethro arboreae-Ocoteo foetentis sigmetum (stink-laurel temperate forest series) Infra to mesotemperate, forest series, still covering large areas of the island, mainly on the North face (800-1450 m a.s.l. South face; 300-1400 m a.s.l. North face);
5) Polysticho falcinelli-Erico arboreae sigmetum (high altitude tree-heath series), Meso-supra temperate series of tree-heath forests, mostly destroyed cutting and grazing (Erica arborea) (1400 to 1650 m a.s.l.).
Satellite imagery
Two RapidEye scenes processed at level 1B (L1B), fully covering Madeira Island and acquired respectively on December 13th, 2009 (winter) and August 10th, 2011 (summer) were used in this study. RapidEye is constituted by a constellation of five Earth Observation satellites carrying identical multispectral push-broom sensors. Each sensor records in five bands of the spectrum including three visible radiation bands (blue, 440-510 nm; green, 520-590 nm; red, 630-685 nm), a red-edge band (690-730 nm) and a near infrared band (760-850 nm)
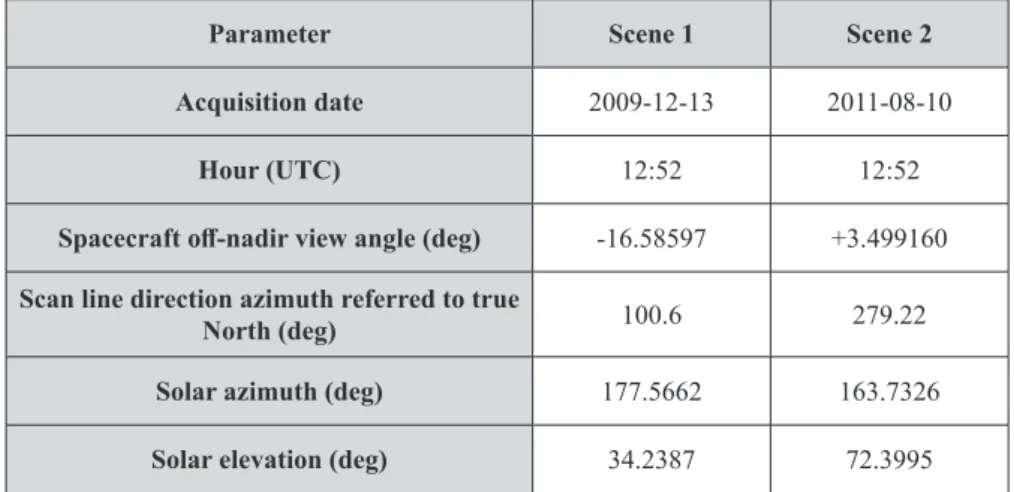
L1B RapidEye products are delivered with a spatial resolution of 6.5 m at nadir, a radiometric resolution of 16 bit and with only minimum level of processing. This imagery comes radiometrically inter-calibrated, to uniform responses from different sensors in different geometric conditions and with the bands co-registered to each other, to guarantee the overlap of the bands within a scene. No terrain model is used for the processing of L1B imagery thus an ortho-rectification step must be included to increase the accuracy of the product. Excluding off-nadir and terrain effects, the root mean square error (RMSE) is expected to be of 10m [RapidEye, 2012]. The main characteristics of the scenes used are reported in Table 1.
Table 1 - RapidEye scenes dates and acquisition geometry details.
Parameter Scene 1 Scene 2
Acquisition date 2009-12-13 2011-08-10
Hour (UTC) 12:52 12:52
Spacecraft off-nadir view angle (deg) -16.58597 +3.499160 Scan line direction azimuth referred to true
North (deg) 100.6 279.22
Solar azimuth (deg) 177.5662 163.7326
Solar elevation (deg) 34.2387 72.3995
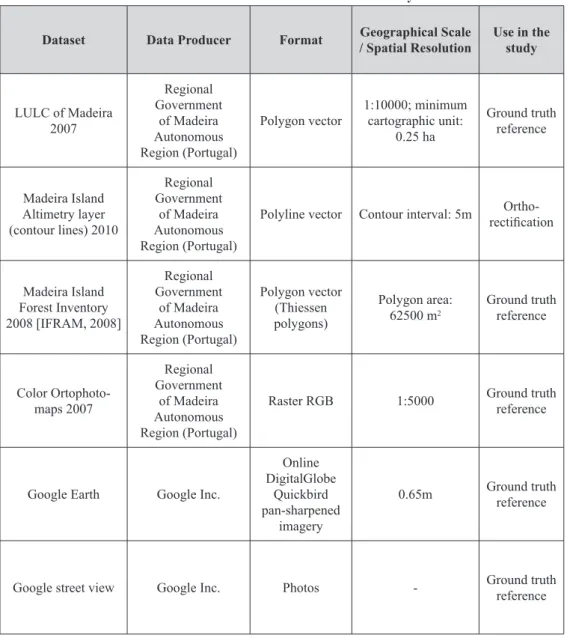
Other datasets used
Table 2 - Additional datasets used in this study.
Dataset Data Producer Format Geographical Scale / Spatial Resolution
Use in the study
LULC of Madeira
2007 Regional Government of Madeira Autonomous Region (Portugal)
Polygon vector 1:10000; minimum cartographic unit: 0.25 ha
Ground truth
reference
Madeira Island Altimetry layer (contour lines) 2010
Regional Government
of Madeira Autonomous
Region (Portugal)
Polyline vector Contour interval: 5m rectification
Ortho-Madeira Island Forest Inventory 2008 [IFRAM, 2008]
Regional Government of Madeira Autonomous Region (Portugal) Polygon vector (Thiessen polygons) Polygon area:
62500 m2
Ground truth reference Color Ortophoto-maps 2007 Regional Government of Madeira Autonomous Region (Portugal)
Raster RGB 1:5000 Ground truth reference
Google Earth Google Inc.
Online
DigitalGlobe Quickbird
pan-sharpened imagery
0.65m Ground truth reference
Google street view Google Inc. Photos - Ground truth
reference
Note: Original or re-projected Geographic References: EPSG 3061; projection UTM; Ellipsoid International 1924; Datum: Porto Santo 1995; UTM Coordinate System - Zone 28N.
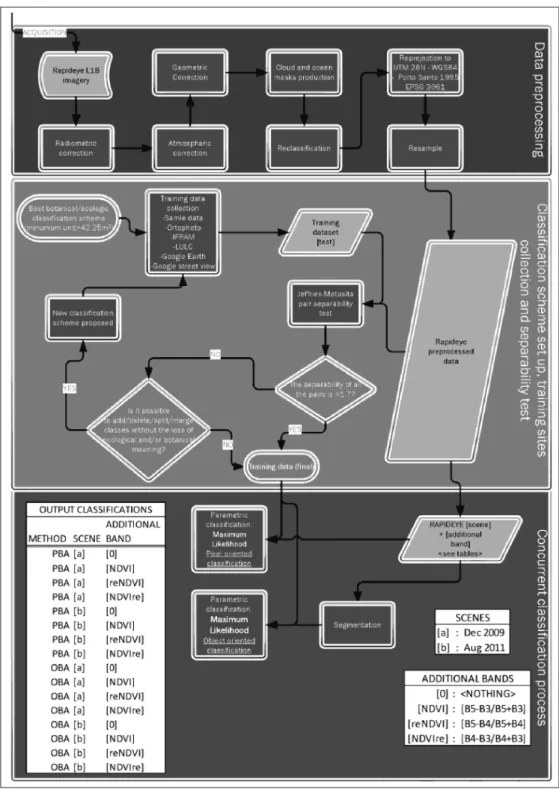
Figure 2 schematically represents the methodological workflow of this study which can be divided in three different steps, namely: (1) RapidEye data preprocessing; (2) classification scheme set up, training sites collection and spectral separability assessment; and (3) concurrent classification process and accuracy assessment. Every step is described
Preprocessing
The two RapidEye images were converted to top-of-atmosphere reflectance (radiometric correction), and subsequently atmospherically corrected with the Fast Line-of-sight Atmospheric Analysis of Hypercubes (FLAASH) algorithm [Adler-Golden et al., 1998]. FLAASH method is based on the Moderate Atmospheric Transmittance code (MODTRAN) [Abreu and Anderson, 1996; Matthew et al., 2000] and adapted to the observations made by Kaufman et al. [1997]. Both images were ortho-rectified using the Rational Polynomial Coefficients (RPC) provided within the imagery and the digital elevation model layer. Since the result was not accurate as expected, the scenes were further warped with 30 ground control points each, to fit a polynomial second order equation [Richards and Jia, 1999; Jensen, 2005] and further resampled to co-register the two scenes to ensure an effective overlay (geometric correction) - The digital elevation model was obtained by interpolation of the contour data with ANUDEM technique [Hutchinson, 1988]. Cloud masks were manually digitized through on-screen photo-interpretation. The pixels within the ocean and those covered by cloud masks have been reclassified as no data. Shadows originated by clouds and by both relief/sun and relief/ sun/sensor geometries have been left to be posteriorly recognized and mapped by the classifier. The imagery was re-projected in the local reference system UTM 28N - Porto Santo 1995 (EPSG 3061)
Classification scheme set up, training sites collection and spectral separability assessment
An “ideal classification scheme” for vegetation mapping in Madeira Island was initially set up to be consistent in the representation of dominant plant species within their ecological communities for the Island according to the works of Capelo et al. [2004] and Costa et al. [2004]. With every point representing a pixel in the RapidEye scene, hence a given land-cover’s spectral signature, an iterate process was initialized to obtain a training data set formed by at least 45 point elements per class with each class’ spectral response being statistically separable from the others. For every classification scheme since the “ideal”, the iteration thus included two steps: the collection of new point sets for the classification scheme under assessment and the spectral separability assessment of the points for the RapidEye scene. The available surveys developed from 2009 to 2011 by the Madeira Botanical Group were used as training basis for the photointerpretation process. The point elements were collected through visual likelihood of the field survey points within the ortophoto-maps. In addition Google Earth and Google Street View online resources were used as supplementary sources of information where the ortophoto quality was low or the land cover uncertain. The points however were finally accepted only if the result was meaningful with respect to the classes of the Land use Land cover map (LULC) of Madeira and the Madeira Island Forest Inventory [IFRAM, 2008]. The Jeffries-Matusita
(JM) spectral separability measure was computed for every pair of classes in order to assess
TSP JM N
n 1 7. ==
[[ ]]
1where JMn are the class pairs with a JM distance ≥ 1.7 (1.4 in the original version of TSP)
and N is the total number of class pairs. The higher threshold of 1.7 was introduced to better
split problematic from easily separable classes. In Table 2 are reported the main changes operated to the “ideal classification scheme” towards an operational and spectrally viable classification scheme. The resulting sample was finally randomly stratified into 30 points per class for the training data and 15 points per class for ground truth data.
Data segmentation and classification
The classification step can be divided in three different levels of analysis:
a) Winter (December 2009) vs. Summer (August 2011) scenes; b) Pixel-based approach (PBA) vs. object-based approach (OBA);
c) Pertinence of using RapidEye-derived vegetation indices as ancillary bands in the
classification procedure.
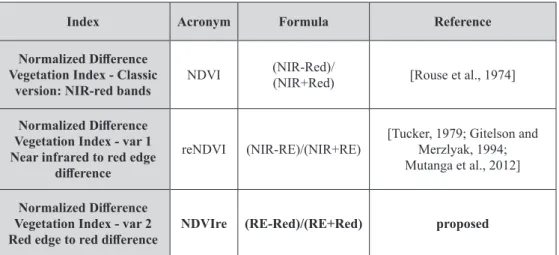
Pixel and object-based Maximum Likelihood supervised classifications were applied to eight initial datasets including solely RapidEye multispectral bands (from December 2009 and August 2011, respectively) and also combinations of these same multispectral bands with three different vegetation indices - the classic NDVI, the already tested reNDVI and a newly tested NDVIre, respectively - in order to test the full potential of the RapidEye red-edge band for vegetation studies, as presented in Table 3. Sixteen different input combinations and, subsequently, classification maps were thus obtained (see output table printed in Fig. 2), assessed and compared.
Table 3 - Vegetation indices used in this study.
Index Acronym Formula Reference
Normalized Difference Vegetation Index - Classic
version: NIR-red bands NDVI
(NIR-Red)/
(NIR+Red) [Rouse et al., 1974]
Normalized Difference Vegetation Index - var 1 Near infrared to red edge
difference
reNDVI (NIR-RE)/(NIR+RE) [Tucker, 1979; Gitelson and Merzlyak, 1994;
Mutanga et al., 2012]
Normalized Difference Vegetation Index - var 2
Red edge to red difference NDVIre (RE-Red)/(RE+Red) proposed
NIR: near infrared band, wavelength 760-850 nm, RapidEye band 5; RE: red-edge band, wavelength 690-730 nm, RapidEye band 4; Red: red band, wavelength: 630-685 nm, RapidEye band 3.
segmentation [Roerndink and Meijster, 2000] was performed. Watershed segmentation algorithms require the determination of the best fitting combination of two coefficients, the scale factor and the merge factor within an iterative process aimed to reach a segment size lower than the class object size [Blaschke, 2010]. Several combinations have been assessed until reaching a fitting combination for all the scenes, in order to reduce the disturbance in accuracy due to segmentation parameters. The scale factor was set to 10 and the merge
factor to 45.
Accuracy assessment
The sixteen classifications accuracy results were assessed by overlaying ground truth data to each map to compute confusion matrices, from which statistics have been calculated such as, class-wise quantity disagreement and allocation disagreement [Pontius and Millones, 2011], overall accuracy [Congalton, 1991; Foody, 2002] and Kappa coefficient of agreement [Cohen, 1960]. Quantity disagreement (QD) takes into account the difference in distribution for every class in a set of classes (the classification scheme) between the map in evaluation and the reference given for the accuracy assessment. Allocation disagreement (AD) oppositely takes into account the spatial position mismatch for every class in a set of classes between the map in evaluation and the reference given for the accuracy assessment. Overall accuracy (OA) is the averaged sum of the correct classified pixels proportion per class. Kappa coefficient of agreement (Kˆ ) compares the observed proportion of correctly
classified pixels to the proportion that would accidentally be classified as correct.
Results
PreprocessingThe ortho-rectification process-derived RMSE resulted lower than a pixel for both images: 6.21 meters for the scene of December 2009 and 4.84 meters for the scene of August 2011. The unavailable data in RapidEye for 2011 scene amounted to 4 km2 due to shadow coverage and to 22 km2 due to cloud coverage, which aggregated correspond to 3.53% of Madeira’s
land. For 2009 scene, the unavailable data amounted to 98 km2 due to shadow coverage and to 70 km2 due to cloud coverage, which aggregated correspond to an unavailable
spectral coverage of 22.57% of the island territory. Although the atmospheric correction significantly improved the contrast in the visible wavelengths, an over-reflection of the blue band remained in the December scene due to haze on the eastern part of the Island.
Classification scheme set up, training sites collection and spectral separability assessment
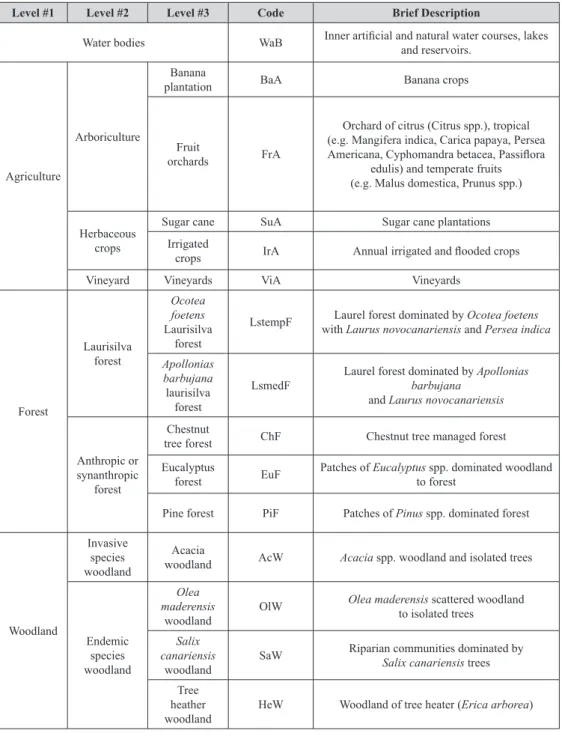
Table 4 (Continued on the next page) - Land-cover classification scheme adopted with brief class description.
Level #1 Level #2 Level #3 Code Brief Description
Water bodies WaB Inner artificial and natural water courses, lakes and reservoirs.
Agriculture
Arboriculture
Banana
plantation BaA Banana crops
Fruit
orchards FrA
Orchard of citrus (Citrus spp.), tropical (e.g. Mangifera indica, Carica papaya, Persea Americana, Cyphomandra betacea, Passiflora
edulis) and temperate fruits (e.g. Malus domestica, Prunus spp.)
Herbaceous crops
Sugar cane SuA Sugar cane plantations Irrigated
crops IrA Annual irrigated and flooded crops Vineyard Vineyards ViA Vineyards
Forest Laurisilva forest Ocotea foetens Laurisilva forest
LstempF with Laurel forest dominated by Laurus novocanariensis and Ocotea foetensPersea indica
Apollonias barbujana
laurisilva forest
LsmedF Laurel forest dominated by barbujana Apollonias and Laurus novocanariensis
Anthropic or synanthropic
forest
Chestnut
tree forest ChF Chestnut tree managed forest Eucalyptus
forest EuF
Patches of Eucalyptus spp. dominated woodland to forest
Pine forest PiF Patches of Pinus spp. dominated forest
Woodland
Invasive species woodland
Acacia
woodland AcW Acacia spp. woodland and isolated trees
Endemic species woodland Olea maderensis woodland
OlW Olea maderensisto isolated trees scattered woodland
Salix canariensis
woodland
SaW Riparian communities dominated by Salix canariensis trees
Tree heather woodland
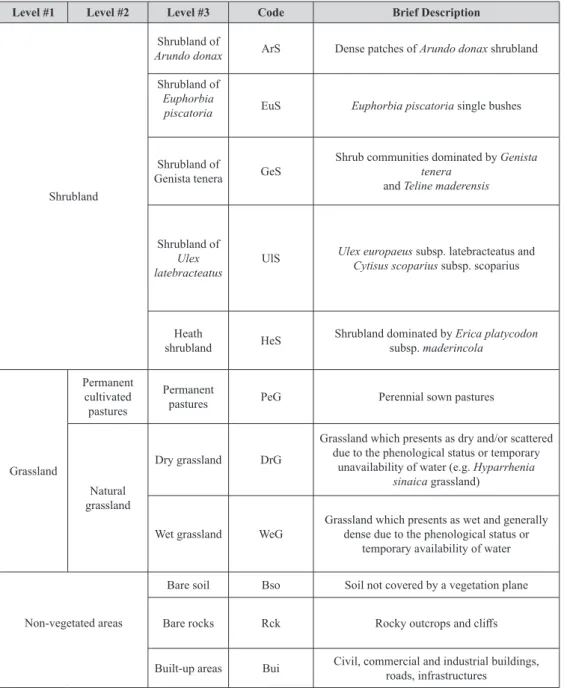
Table 4 (Continued from preceding page) - Land-cover classification scheme adopted with brief class description.
Level #1 Level #2 Level #3 Code Brief Description
Shrubland
Shrubland of
Arundo donax ArS Densepatches of Arundo donax shrubland
Shrubland of Euphorbia
piscatoria EuS Euphorbia piscatoria single bushes
Shrubland of
Genista tenera GeS
Shrub communities dominated by Genista tenera
and Teline maderensis
Shrubland of Ulex latebracteatus
UlS Ulex europaeus subsp. latebracteatus and Cytisus scoparius subsp. scoparius
Heath
shrubland HeS Shrubland dominated by subsp. maderincolaErica platycodon
Grassland
Permanent cultivated pastures
Permanent
pastures PeG Perennial sown pastures
Natural grassland
Dry grassland DrG
Grassland which presents as dry and/or scattered due to the phenological status or temporary
unavailability of water (e.g. Hyparrhenia sinaica grassland)
Wet grassland WeG
Grassland which presents as wet and generally dense due to the phenological status or
temporary availability of water
Non-vegetated areas
Bare soil Bso Soil not covered by a vegetation plane
Bare rocks Rck Rocky outcrops and cliffs
Built-up areas Bui Civil, commercial and industrial buildings, roads, infrastructures
In Table 5 are presented the land cover/vegetation classes ordered by frequency of occurrence among the least separable pairs according to Jeffrey-Matusita separability test (JM lower
than 1.4 and JM lower than 1.7, respectively) - This table shows the most problematic
Table 5 - Jeffrey-Matusita separability test results for December 2009 and August 2011 imagery: TSP1.4 and TSP1.7 resume respectively the percentage of classes with JM separability above the
threshold of 1.4 and 1.7, thus the easy-to-separate classes. The lists of the classes with separability below these thresholds are given. Since the JM results are pairwise, every class in a n classes
classification scheme has n-1 values of separability. The percentages aside to each class represent the frequency with which each class appears in the group of pairs whose separability is below the thresholds; the highest values represent classes with separability problems towards many classes.
RapidEye December 2009 RapidEye August 2011
TSP1.4= 94.00% TSP1.7= 82.90% TSP1.4= 94.60% TSP1.7= 87.80%
JM<1.4 JM<1.7 JM<1.4 JM<1.7
IrA 11.90% FrA 11.70% PeG 10.50% FrA 8.10%
FrA 11.90% ArS 7.50% IrA 10.50% IrA 7.00%
ArS 9.50% AcW 6.70% ViA 7.90% LsmedF 7.00%
SaW 9.50% IrA 5.80% FrA 7.90% AcW 7.00%
PeG 7.10% PiF 5.80% AcW 7.90% WeG 7.00%
PiF 7.10% LstempF 5.80% OlW 7.90% GeS 5.80%
EuF 7.10% GeS 5.00% GeS 5.30% PeG 4.70%
AcW 4.80% SaW 5.00% UlS 5.30% ViA 4.70%
SuA 4.80% PeG 4.20% EuF 5.30% UlS 4.70%
GeS 4.80% SuA 4.20% WeG 5.30% OlW 4.70%
WeG 4.80% EuF 4.20% Rck 5.30% ArS 4.70%
BaA 2.40% ChF 4.20% LsmedF 2.60% SaW 4.70%
Bso 2.40% WeG 4.20% ArS 2.60% Bui 3.50%
ChF 2.40% BaA 3.30% Bui 2.60% BaA 3.50%
Rck 2.40% OlW 3.30% Bso 2.60% HeS 3.50%
LstempF 2.40% LsmedF 2.50% LstempF 2.60% EuF 2.30%
UlS 2.40% DrG 2.50% HeW 2.60% Bso 2.30%
LsmedF 2.40% HeS 2.50% PiF 2.60% SuA 2.30%
UlS 2.50% BaA 2.60% HeW 2.30%
Rck 2.50% PiF 2.30%
Bui 1.70% Rck 2.30%
HeW 1.70% ChF 1.20%
Bso 0.80% EuS 1.20%
EuS 0.80% WaB 1.20%
WaB 0.80% LstempF 1.20%
Data segmentation, classification and accuracy assessment
In Table 6 are presented the results in terms of OA of the classification and .
Table 6 - Overall Accuracy (OA) and Kappa coefficient of agreement () for the processed stacks. OBA: Object Based Approach; PBA: Pixel Based Approach; [a]: RapidEye December scene; [b]: RapidEye August scene. The vegetation index reference is reported in Figure 2.
Stack OA
OBA [b]+[NDVI] 74.53% 0.754
OBA [b]+[reNDVI] 74.77% 0.738
OBA [b]+[NDVIre] 73.83% 0.728
OBA [b] +[0] 72.90% 0.718
OBA [a]+[0] 67.52% 0.699
OBA [a]+[NDVI] 67.29% 0.697
OBA [a]+[reNDVI] 66.59% 0.689
PBA [a]+[reNDVI] 65.19% 0.674
OBA [a]+[NDVIre] 65.19% 0.674
PBA [a]+[NDVIre] 64.25% 0.664
PBA [b]+[0] 67.06% 0.657
PBA [a]+[0] 63.32% 0.653
PBA [a]+[NDVI] 63.32% 0.653
PBA [b]+[NDVIre] 66.59% 0.653
PBA [b]+[reNDVI] 65.65% 0.643
PBA [b]+[NDVI] 64.95% 0.636
The best OA and Kˆ values have been scored by August scene with an object-based
classification approach with the utilization of the additional reNDVI band. In Figure 3 are presented the Allocation and Quantity Disagreement for each class of the scheme for the stacks considered in each scene.
ˆ K
Figure 3 - Accuracy assessment results per class. December results on the left and August on the right. For each period have been plotted Pixel-based results versus Object-based reults. For each class, approach and period, the stack of four horizontal columns represents the Pontius accuracy for - bottom to top - [0], [NDVI], [reNDVI] and [NDVIre]. AD: Allocation Disagreement, QD: Quantity Disagreement.
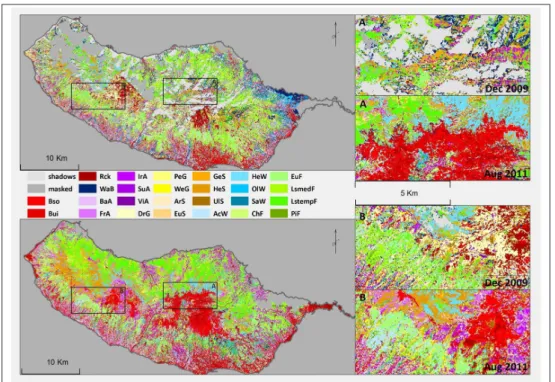
In Figure 4 are represented the best land cover/vegetation map produced for December 2009 and August 2011. The map for December was obtained by applying an object-based Maximum Likelihood supervised classification to the dataset including only the RapidEye multispectral bands (OA: 71%) - The map for August was obtained by applying an object-based Maximum Likelihood supervised classification to the dataset including the RapidEye multispectral bands and the reNDVI band (OA: 75%) - The color scheme codifies different saturation levels of the same main hue, for family of covers: greys represent masked pixels and shadows, reds bare and rocky soils and built-up areas, purples agriculture, yellows grasslands, oranges shrublands, light-blues woodlands, greens forests and deep-blue water
Figure 4 - Best classification maps produced for December 2009 (top) and August 2011 (bottom).
Discussion
PreprocessingTraining sample collection and ancillary data issues
A point sampling-based approach was selected for the training sites collection, in order to fully explore the potential of the available GPS-based botanical surveys developed from 2009 to 2011 by the Madeira Botanical Group. However some vegetation classes have been very difficult to identify and collect, either because mixed, sub-pixel sized or spectrally similar to other classes. Through the JM separability test it was possible to
assess spectral separability for every pair of land cover/vegetation class signatures, in order to progressively rearrange the classification scheme to guarantee higher spectral homogeneity and coherence within each final class. However, a spectral-based classification scheme definition, due to some similarities between classes (see Tab. 5) may have led to ecologically senseless land cover/vegetation classes. This lower spectral separability between some classes may be mainly derived from the synergistic combination between the medium spectral resolution of RapidEye imagery (despite the existence of the red edge band) and the extensive and ambitious classification scheme (frequently at the plant species/community level) that was adopted in this study. Therefore the final classification scheme alteration was stopped when an ecologically meaningful and an inter-class spectrally separable classification scheme was obtained (i.e. the loop-stopping condition represented in the second part of Fig. 2) - The December 2009 scene was affected by relevant lack of spectral data due to the cloudy and shadowy covers which forced to concentrate the training data in the reduced ground truth areas. For the August 2011 scene, instead, the training data has been collected in a wider range of areas having more ground truth examples to base on, resulting in a more scattered set of points. A more various training dataset gives more flexibility to the classification algorithm, making it able to properly classify pixels whose spectral signature presents slight to relevant differences from the average of the training class. A too various training dataset on the other hand can confuse the algorithm leading to bad classification results. This gives an introduction to the different behaviors of December and August datasets after the increase in variability of the spectral signature through the addition of an ancillary vegetation index band, and after a decrease in variability through a segmentation process.
Seasonal RapidEye data acquisition for improving vegetation mapping accuracy in Madeira Island: winter vs. summer
Most suitable supervised classification approach for improving vegetation mapping accuracy in Madeira Island: pixel versus object based classification
General accuracy assessment presented in Table 6 shows a decisive superiority of the OBA over the PBA (5.84% of OA gap between OBA [b] + [0] and PBA [b] + [0] and 4.2% of OA gap between OBA [a] + [0] and PBA [a] + [0]) - We conclude that these results are due to the enhanced intra-class coherence given by the segmentation process. According to Figure 3, it can be resumed that classes with wide and extended objects score better results in the OBA (AcW, SaW, LStempF, GeS, EuS, EuF, Bso, BaA, IrA and WeG and less noticeably PeG, DrG and ChF) and classes constituted by linear, pointy and very scattered objects perform better in PBA (ArS, Bui and WaB) - The segmentation configuration procedure however may represent a main issue jointly with the training data collection, as both processes are human-driven and directly dependent on the previous and accurate knowledge of the case-study area.
Pertinence of using RapidEye-derived vegetation indices as ancillary bands in the classification procedure for improving vegetation mapping accuracy in Madeira Island
A vegetation index is a combination of spectral bands that amplifies spectral information of high significance for a distinction of different cover classes [Gerstmann et al., 2016]; the data carried on a vegetation index band may be more correlated to specific vegetation features than the bands that originated it. The vegetation index can be considered a layer carrying information such as biomass [Vuolo et al., 2010; Dube et al., 2014], LAI [Beckschäfer et al., 2014], leaf pigment absorption [Godinho et al., 2016] and can be used as information layer to improve the classification results [Buck et al., 2015]. The 3 vegetation indices tested in this study demonstrated to have generally positive effects in the classification results for an image of good quality . However some controversial results emerged when the vegetation index layer was used to improve the accuracy of an image affected by high atmospheric disturbance. Observing Figure 3, some class accuracy behaviors due to the addition of a vegetation index can be pointed out. A gain in accuracy was determined by a better discrimination between classes of the same genus and characterized by different habitus, at this resolution meaning mainly a difference in canopy density, as observed in HeS and HeW (see the decrease of AD+QD of HeS and HeW after the addition of [NDVIre], above the other vegetation index, in PBA [b] and [NDVI] or [NDVIre] in OBA [a]). Another source of accuracy increase was inspected as the better discrimination among PeG and WeG grassland classes, whose spectral and textural differences may be slight (see the decrease of AD+QD of PeG and WeG after the addition of [reNDVI] in PBA [b], [NDVI] in OBA [b] and [reNDVI] in OBA [a]). Moreover it is observable a possible better detection of vegetated/non-vegetated areas transitions, if taken in consideration for example DrG, a very low density and low reflectance vegetation class (or EuS, who loses the leaves in summer) and Bso (see the decrease of AD+QD of DrG, EuS and Bso after the addition of [NDVI], [reNDVI] or, less markedly, [NDVIre] for PBA [b], [reNDVI], [NDVIre] or [NDVI] for OBA [b] and [reNDVI] or [NDVIre] for PBA [a]). Furthermore the addition of a vegetation index band showed to be useful into rising up the accuracies of the least separable classes for both periods: the classes with at least 5% of appearance in the least separable classes (with
in [a]), than in the PBA (only FrA in [b]). [reNDVI] showed to increase the accuracy of the least separable classes slightly more in the OBA (EuF, FrA, PeG, Rck, UlS and ViA in [b] and ArS, IrA and PiF in [a]) than in the PBA (IrA, UlS and WeG in [b] and PiF and SaW in [a]). [NDVIre] showed to increase the accuracy of the least separable classes slightly more in the OBA (AcW, FrA, PeG, Rck and WeG in [b] and IrA and PiF in [a]) than in the PBA (FrA, OlW, UlS and WeG in [b] and EuF and PiF in [a]). The addition of a vegetation index guaranteed an increase in general accuracy (see Table 6) in OBA [b] (all vegetation index sets better than [0]) of 1.63% of OA for the best set, [NDVI] and in PBA [a] ([reNDVI] and [NDVIre] better than [0] and [NDVI] worse than [0]) of 1.87% of OA for the best set, [reNDVI]. We assume that the negative results resulting from the addition of a vegetation index band to the OBA [a] and PBA [b] sets are due to different reasons: the OBA [a] set may have suffered for a too high concentration of the training data, resulting in very little variable class’ spectral signature (because collected in the segmented objects with an average reflectance value) combined with an aberrant vegetation index value (this at pixel level) due to atmospheric disturbance; instead PBA [b] set with the vegetation index additional band may have confused the algorithm with too much variance of the spectral signature. However, the decrease in accuracy in PBA [b] with vegetation index additional band can be considered extremely slight (0.47% of OA for the best set, [NDVIre]) as that in OBA [a] (all vegetation index sets worse than [0]) of 0.23% of OA for the best set, [NDVIre].
Main remarks on the output maps
shrubland and agricultural land, that may be misclassified humid grassland. In frame “B” it is well shown the seasonal (it is assumed to be non-permanent changes, only related to the season) land cover transition on the western plateau of Paul da Serra. In December a large part of the plateau is covered in grassland while in August it disappears for bare soil. The heat is dominant in the top part of frame B and while in December is mainly detected as woodland, in August it is detected as shrubland; this is probably due to different vegetative status in the two periods. The green forest strip top left to bottom seems to evolve from mixed endemic laurisilva to managed eucalypt. Such change behavior is not uncommon observing the two classifications, and it would hold a certain relevance if confirmed by future studies for an assessment of the forest management policies. The authors nevertheless prefer to consider the data with prudence due to difference in vegetative status possible misclassification. Furthermore, as expected, many bare areas (in red) during the winter, then turn in to agriculture lands during the summer (in purple). Some grasslands and pastures, inversely disappear with the warm season (an example is represented by the dry grassland around Ponta do Pargo, the westernmost cape of the island). Generally the natural vegetation follows an altitude gradient rule, especially on the southern coast, with three main strips: agriculture, pine forest and eucalyptus forest. The northern side of the island is dominated by the laurel forest in the wild steep valleys and diversely covered in the flat areas (where it is visible a seasonal change from bare to agriculture areas). At the higher altitudes, plateaus and mountains are covered by herbaceous, bushy and woody native/endemic species and by the invasive Acacia woodlands. According to the Pontius class accuracy in Figure 3, FrA are largely erroneously classified; this phenomenon is probably due to the high variety of fruit tree kinds and the related differences in phenology, plant density and vegetation spectral reflectance. AcW class has been found mainly mixed thus extremely difficult to sample. SaW low accuracy in the best December 2009 classification map may be explained by the riparian nature of the class, which affected the sampling process, frequently occurring covered by slope-projected shadows in this RapidEye scene. Wbo are largely misclassified because of their linear nature with widths that often approximate the pixel size. Jointly, the high reflective surrounds of rocky beds, which frequently results in water-rock mixed pixels, negatively affect the classifier response, both in PBA and OBA. Furthermore some shaded areas are commonly misclassified as water bodies. SuA classification quality suffers mainly from a spectral likelihood to ArS. This is possibly due to two different reasons: (1) they have the same name in Portuguese (“cana”) which may have made these classes subject to on-screen digitizing misinterpretations in previous works; (2) the difficulty of collecting ArS training data because it is usually used as hedgerow along the border of agricultural land, therefore with very narrow (sub-pixel) width. LSmedF achieved low accuracy values because it was not possible to find large patches of this class and therefore it was difficult to collect related training data.
Conclusions
of summer and winter imagery. The phenological differences of the vegetation showed not to consist in a multi-temporal series classification issue, if taken in consideration also that most of the natural/protected vegetation grows on the North side of the island, where the humidity is more constant. Nevertheless a main problem remains the availability of quality picture in the winter season considering the oceanic aerosol as further disturbance factor in addition to the clouds and the mist. Although the high spatial resolution would suggest the possibility of a singular tree-by-tree detection (whether the crown is twice the pixel size), we demonstrate that for a relatively important area as Madeira Island, with many spectral classes, considering the high radiometric depth of the RapidEye data, the best results are given by applying an object-based approach to reduce the classificator uncertainty. The five spectral bands, with the fourth placed on the wavelength of the vegetation red-edge spectral response, demonstrate to give accurate details for vegetation mapping. The use of a vegetation index stacked with the RapidEye dataset (pixel-sized and segmented) for improving the classification accuracy returned interesting effects of improvement of the accuracy of the statistically least separable classes, of different classes of plants from the same genus, of very low-reflectance and spread classes (as the dry grassland in summer) on the bare soil and classes whose differences may be slight but economically and practically necessary (as annual grassland and pastures). The addition of a vegetation index showed to be nevertheless a delicate phase whose results depend mainly on the quality of the imagery and training data. The maps produced overcome the previous existing cartography offering a huge variety of uses. We find relevant to stress the correlation between training step, which means certain knowledge of the land cover and accuracy of the classification; as observed in this research we conclude that the prior knowledge (and its resolution) of the cover in the training areas is the first driver of the map accuracy. Regarding the RapidEye imagery we recommend a careful selection of the scenes, with a particular attention to the off-nadir position of the sensor, because can lead to a massive data loss especially in oceanic islands whereas the topography is rugged.
Final remarks
Acknowledgements
The participation of co-author Artur Gil in this study was supported by the Post-Doctoral Research Project # SFRH/BPD/100017/2014 from the “Fundação para a Ciência e Tecnologia” (FCT), funded by the National Budget of the Ministry of Education and Science of Portugal and by the European Social Fund.
Appendices
Appendix 1 (Continued on the next page) - Main actions operated to the original classification scheme through the JM separability assessment and training data adjustment iterative process to
reach the final classification scheme.
Ideal classification scheme Action Final classification scheme
Natural water streams
Merged(1) Water bodies
Coastal ponds
Natural inner lakes and ponds
Artificial inner lakes and ponds
Fruit orchards Splitted(2) Fruit orchards
Banana plantation
Irrigated crops Splitted(3) Irrigated crops
Sugar cane
non-irrigated crops Removed(4)
-Vineyards none(5) Vineyards
Apollonias barbujana laurisilva forest
Merged(6) Apollonias barbujana laurisilva forest
Open Apollonias barbujana laurisilva forest Ocotea foetens Laurisilva forest
Merged(7) Ocotea foetens Laurisilva forest
Open Ocotea foetens laurisilva forest
Persea indica laurisilva forest Removed(8)
-Chestnut tree forest
Merged(9) Chestnut tree forest
Chestnut tree forest with broad-leaf trees Chestnut tree forest with resinous trees
Open chestnut tree forest
Eucalyptus spp. forest
Merged(10) Eucalyptus spp. forest Eucalyptus spp. forest with broad-leaf trees
Eucalyptus spp. forest with resinous trees
Appendix 1 (Continued from preceding page and on the next page) - Main actions operated to the original classification scheme through the JM separability assessment and training data
adjustment iterative process to reach the final classification scheme.
Ideal classification scheme Action Final classification scheme Pine forest
Merged(11) Pine forest
Pine forest with resinous trees Open pine forest
Open pine forest with broad-leaf trees
Forest of other broad-leaf trees Removed(12)
-Forest of other resinous trees Removed(13)
-Open forest of other broad-leaf trees Removed(14)
-Open forest of other resinous trees Removed(15)
-Community of Acacia dealbata
Merged(16) Acacia woodland
Community of Acacia mearnsii Community of Acacia melanoxylon Open community of Acacia mearnsii
Open community of Acacia melanoxylon
Olea maderensis woodland
Merged(17) Olea maderensis woodland
Open Olea maderensis woodland
Salix canariensis woodland none(18) Salix canariensis woodland
Tree heather woodland
Merged(19) Tree heather woodland
Open tree heather woodland
Community of Pittosporum undulatum Removed(20)
-Open community of Pittosporum undulatum Removed(21)
-Community of Arundo donax none(22) Community of Arundo donax
Community of Euphorbia piscatoria
Merged(23) Community of Euphorbia piscatoria
Open community of Euphorbia piscatoria
Community of Genista tenera none(24) Community of Genista tenera
Community of Ulex latebracteatus none(25) Community of Ulex latebracteatus
Heath shrubland with Myrtus spp.
Merged(26) Heath shrubland
Heath shrubland with Vaccinium spp.
Open heath shrubland with Myrtus spp.
Open heath shrubland with Vaccinium spp.
Myria faya Shrubland Removed(27)
-Sideroxylum mirmolano community Removed(28)
Appendix 1 (Continued from preceding page) - Main actions operated to the original classification scheme through the JM separability assessment and training data adjustment
iterative process to reach the final classification scheme.
Ideal classification scheme Action Final classification scheme
High altitude herbaceous community
Rearranged(30)
Dry grassland
Low altitude herbaceous community
Wet grassland
Invasive herbaceous community
Built-up areas
Merged(31) Built-up areas
Road system and associated areas
Reservoirs and cisterns
Beach, dunes and coastal areas Removed(32)
-Burnt areas
Merged(33) Bare rocks Quarries
Bare rock
- Added(34) Bare soil
(1)(20)(27)(28) scarce availability of data for comparison due to low spatial frequency of the object and/or high pixel mixture due to very scattered class combined with homogeneous patch size smaller than one pixel; (2)(3)(34) existence of stand-alone spectral natural aggregations in the previous class(es) which matched to the interpreter’s assessment; (4)(8)(12)(13)(14)(15)(21) unavailability of photo-interpreted data for comparison and impossibility to distinguish the class from others; (5)(18)(22)(24)(25)(29) no action required; (6)(7)(9)(10)(11)(16)(17)(19)(23) (26) dense, open and/or mixed classes have non relevant spectral difference whether the single object roughly approximates the pixel size; (30) unavailability of photo-interpreted data for comparison and impossibility to distinguish the class from others but existence of stand-alone spectral natural aggregations in the previous classes which matched to the interpreter’s assessment; (31) merged into anthropic impervious areas; (32)(33) non-relevant class differences; spectral inseparability of the class due to lack of information in the medium infrared; (34) class mainly consequent to seasonal changes between vegetated and non-vegetated areas. Spectrally separable from the others non-vegetated areas.
References
Abreu L., Anderson G. (1996) - The MODTRAN 2/3 report and LOWTRAN 7 model. Hanscom AFB, MA. Available online at: http://www.gps.caltech.edu/~vijay/pdf/ modrept.pdf.
Adam E., Mutanga O., Odindi J., Abdel-Rahman E.M. (2014) - Land-use/cover classification in a heterogeneous coastal landscape using RapidEye imagery: evaluating the performance of random forest and support vector machines classifiers. International Journal of Remote Sensing, 35: 3440-3458. doi: http://dx.doi.org/10.1080/01431161.2
from RapidEye image for classifying insect defoliation levels. ISPRS Journal of Photogrammetry and Remote Sensing, 95: 34-41. doi: http://dx.doi.org/10.1016/j. isprsjprs.2014.05.013.
Adler-Golden S.M., Berk A., Bernstein L.S., Richtsmeier S.C., Acharya P.K., Matthew M.W., Anderson G.P., Allred C.L., Jeong L.S., Chetwynd J.H. (1998) - FLAASH a MODTRAN4 atmospheric correction package for hyperspectral data retievals and simulations. NASA Jet Propulsion Laboratory.
Aguiar C., Capelo J., Costa J.C., Fontinha S., Espírito-Santo D., Jardim R. Lousã M., Rivas-Martínez S., Mesquita S., Sequeira M., Sousa J. (2004) - A paisagem vegetal da Ilha da Madeira. Querceteae, 6: 3-200, Capelo J. (Ed.).
Asam S., Fabritius H., Klein D., Conrad C., Dech S. (2013) - Derivation of leaf area index for grassland within alpine upland using multi-temporal RapidEye data. International Journal of Remote Sensing, 34: 8628-8652. doi: http://dx.doi.org/10.1080/01431161.2 013.845316.
Beckschäfer P., Fehrmann L., Harrison R., Xu J., Kleinn C. (2014) - Mapping Leaf Area Index in subtropical upland ecosystems using RapidEye imagery and the random Forest algorithm. IForest - Biogeosciences and Forestry, 7: 1-11. doi: http://dx.doi.org/10.3832/ ifor0968-006.
Blaschke T. (2010) - Object based image analysis for remote sensing. ISPRS Journal of Photogrammetry and Remote Sensing, 65: 2-16. doi: http://dx.doi.org/10.1016/j. isprsjprs.2009.06.004.
Borges P.a.V., Abreu C., Aguiar A.F., Carvalho P., Fontinha S., Jardim R., Melo I., Oliveira P., Sequeira M.M,. De Sérgio C., Serrano A.R.M., Sim M., Vieira P. (2008) - A Biodiversidade Terrestre e Dulçaquícola dos Arquipélagos da Madeira e das Selvagens. Repositório da Universidade dos Açores, pp. 13-25. Available online at: http://hdl.
handle.net/10400.3/1955.
Buck O., Millàn V.E.G., Klink A., Pakzad K. (2015) - Using information layers for mapping grassland habitat distribution at local to regional scales. International Journal of Applied Earth Observation and Geoinformation, 37: 83-89. doi: http://dx.doi. org/10.1016/j.jag.2014.10.012.
Capelo J., Sequeira M., Jardim R., Costa J.C. (2004) - Guia da Excursão Geobotânica dos V Encontros ALFA 2004 à Ilha da Madeira. In: A paisagem vegetal da Ilha da Madeira, J. Capelo J. (Ed.), Lisboa, ALFA, pp. 5-46.
CBD (2006) – Meeting Documents. Eighth Ordinary Meeting of the Conference of the Parties to the Convention on Biological Diversity, 20-31 March 2006, Curitiba, Brazil.
Available online at: https://www.cbd.int/doc/?meeting=cop-08.
Cho M.A., Ramoelo A., Debba P., Mutanga O., Mathieu R., van Deventer H., Ndlovu N. (2013) - Assessing the effects of subtropical forest fragmentation on leaf nitrogen distribution using remote sensing data. Landscape Ecology, 28: 1479-1491. doi: http:// dx.doi.org/10.1007/s10980-013-9908-7.
Cohen J. (1960) - A coefficient of agreement for nominal scales. Educational and
Psychological Measurement, 20: 37-46.
Congalton R.G. (1991) - A review of assessing the accuracy of classification of remotely sensed data. Remote Sensing of Environment, 37: 35-46.
S., Aguiar C., Rivas-Martinez R. (2004) - Catálogo sintaxonómico e florístico das comunidades vegetais da Madeira e Porto Santo. In: A paisagem vegetal da Ilha da Madeira. Lisboa, Capelo J. (Ed.), ALFA, pp. 61-186.
Costa J.C.A., Neto C., Aguiar C., Capelo J., Espirito Santo M.D., Honrado J.J., Pinto-Gomes C.J., Monteiro-Henriques T., Sequeira M., Lousã M. (2012) - Vascular Plant communities in Portugal (Continental, The Azores and Madeira). Global Geobotany, 2:
1-180. doi: http://dx.doi.org/10.5616/gg120001.
Cruz-Lopez M.I., Lopez-Saldaña G. (2011) - Assessment of affected areas by forest fires in Mexico. In: Advances in Remote Sensing and GIS applications in Forest Fire Management. From local to global assessments, pp. 81-86.
Dube T., Mutanga O., Elhadi A., Ismail R. (2014) - Intra-and-Inter Species Biomass Prediction in a Plantation Forest: Testing the Utility of High Spatial Resolution Spaceborne Multispectral RapidEye Sensor and Advanced Machine Learning Algorithms. Sensors, 14: 15348-15370. doi: http://dx.doi.org/10.3390/s140815348.
Eitel J.U.H., Long D.S., Gessler P.E., Smith A.M.S. (2007) - Satellite Series for Prediction of Wheat Nitrogen Status. International Journal of Remote Sensing, 28: 4183-4190. doi: http://dx.doi.org/10.1080/01431160701422213.
Elatawneh A., Wallner A., Manakos I., Schneider T., Knoke T. (2014) - Forest Cover Database Updates Using Multi-Seasonal RapidEye Data-Storm Event Assessment in the Bavarian Forest National Park. Forest, 5: 1284-1303. doi: http://dx.doi.org/10.3390/f5061284.
Emery K.O., Uchupi E. (2012) - The Geology of the Atlantic Ocean. Springer Science & Business Media.
Fernández-Palacios J.M., De Nascimento L., Otto R., Delgado J.D., García-Del-Rey E., Arévalo J.R., Whittaker R.J. (2011) - A reconstruction of Palaeo-Macaronesia, with particular reference to the long-term biogeography of the Atlantic island laurel forests. Journal of Biogeography, 38: 226-246. doi:
http://dx.doi.org/10.1111/j.1365-2699.2010.02427.x.
Fontinha S., Henriques D., Nobrega H., Teixeira D., Ferro A., Pinheiro de Carvalho M.A.A. (2014) - Vegetation recovery after a massive forest fire in the Ecological Park of Funchal (Madeira Island, Portugal). Silva Lusitana, 22: 207-230.
Foody G.M. (2002) - Status of land cover classification accuracy assessment. Remote Sensing
of Environment, pp. 185-201. doi: http://dx.doi.org/10.1016/S0034-4257(01)00295-4.
Förster M., Frick A., Kleinschmit B. (2011) - Utilization of spectral measurements and phenological observations to detect grassland-habitats with a RapidEye intra-annual time-series. Proceedings of 6th International Workshop on the Analysis of
Multi-Temporal Remote Sensing Images, Multi-Temp 2011, pp. 265-267. doi: http://dx.doi. org/10.1109/Multi-Temp.2011.6005099.
Förster M., Schmidt T., Schuster C., Kleinschmit B. (2012) - Multi-temporal detection of grassland vegetation with Rapideye imagery and a spectral-temporal library. IEEE International Symposium on Geoscience and Remote Sensing (IGARSS), pp. 4930-4933. Fragoso M., Trigo R.M., Pinto J.G., Lopes S., Lopes A., Ulbrich S., Magro C. (2012) -
The 20 February 2010 Madeira flash-floods: Synoptic analysis and extreme rainfall assessment. Natural Hazards and Earth System Science, 12: 715-730. doi: http://dx.doi.
collection 5 MODIS FPAR product in a heterogeneous agricultural landscape in arid Uzbekistan using multitemporal RapidEye imagery. International Journal of Remote Sensing, 33: 6818-6837. doi: http://dx.doi.org/10.1080/01431161.2012.692834.
Gerstmann H., Möller M., Gläßer C. (2016) - Optimization of spectral indices and long-term separability analysis for classification of cereal crops using multi-spectral RapidEye imagery. International Journal of Applied Earth Observation and Geoinformation, 52:
115-125. doi: http://dx.doi.org/10.1016/j.jag.2016.06.001.
Gil A., Fonseca C., Lobo A., Calado H. (2012) - Linking GMES Space Component to the development of land policies in Outermost Regions - the Azores (Portugal) case-study.
European Journal of Remote Sensing, 45: 263-281. doi: http://dx.doi.org/10.5721/
EuJRS20124524.
Gil A., Lobo A., Abadi M., Silva L., Calado H. (2013) - Mapping invasive woody plants in Azores Protected Areas by using very high-resolution multispectral imagery.
European Journal of Remote Sensing, 46: 289-304. doi: http://dx.doi.org/10.5721/
EuJRS20134616.
Gil A., Yu Q., Abadi M., Calado H. (2014) - Using aster multispectral imagery for mapping woody invasive species in pico da vara natural reserve (Azores Islands, Portugal). Revista Árvore, pp. 391-401.
Gil A., Yu Q., Lobo A., Lourenco P., Silva L., Calado H. (2011) - Assessing the effectiveness of high resolution satellite imagery for vegetation mapping in small islands protected areas. Journal of CoastalResearch, 64: 1663-1667.
Gil A., Abadi M. (2015) - Using Very High Resolution Satellite Imagery for Land Cover Mapping in Pico da Vara Nature Reserve (S. Miguel Island, Archipelago of the Azores, Portugal). Proceedings of the 2015 IEEE International Symposium on Geoscience and Remote Sensing (IGARSS), Milan, Italy, pp. 3329-3332. doi: http://dx.doi.org/10.1109/ IGARSS.2015.7326531.
Gitelson A., Merzlyak M.N. (1994) - Spectral Reflectance Changes Associated with Autumn Senescence of Aesculus hippocastanum L., Acer platanoides L. Leaves. Spectral Features and Relation to Chlorophyll Estimation. Journal of Plant Physiology, 143:
286-292. doi: http://dx.doi.org/10.1016/S0176-1617(11)81633-0.
Godinho S., Guiomar N., Gil A. (2016) - Using a stochastic gradient boosting algorithm to analyse the effectiveness of Landsat 8 data for montado land cover mapping : Application in southern Portugal. International Journal of Applied Earth Observations
and Geoinformation, 49: 151-162. doi: http://dx.doi.org/10.1016/j.jag.2016.02.008.
Hutchinson M.F. (1988) - Calculation of hydrologically sound digital elevation models. In: Third International Symposium on Spatial Data Handling. Sydney, Australia.
IFRAM (2008) - 1° Inventário Florestal Da Região Autónoma Da Madeira.
Metacortex-consultoria e modelação de recursos naturais, S.A.
Ivanov I., Chausheva R., Vassilev V. (2011) - Resac forest monitoring and forest damage assessmentin the frame of GMES projects-case study from Bulgaria. Advances in
Remote Sensing and GIS applications in Forest Fire Management. From local to global assessments. Sofia, Bulgaria, pp. 99-104.
Martins A.F., Silva l., Vieira V. (Eds.), pp. 157-208.
Jensen J.R. (2005) - Introductory digital image processing - A remote sensing perspective.
Prentice Hall.
Jiali S., McNairn H., Schulthess U., Fernandes R., Storie J. (2012) - Estimation of crop ground cover and leaf area index (LAI) of wheat using RapidEye satellite data: Prelimary study. 1st International Conference on Agro-Geoinformatics, Agro-Geoinformatics,
2012: 124-128. doi: http://dx.doi.org/10.1109/Agro-Geoinformatics.2012.6311624.
Jung-Rothenhäusler F., Weichelt H., Pach M. (2007) - RapidEye - A Novel Approach to Space Borne Geo-Information Solutions. ISPRS Hannover Workshop 2007: 4-7.
Available online at: http://www.isprs.org/proceedings/xxxvi/1-w51/\nhttp://www.isprs.
org/proceedings/xxxvi/1-w51/paper/Jung-roth_weichelt_pach.pdf.
Kaufman Y.J., Wald A.E., Remer L.A., Flynn L. (1997) - The MODIS 2.1-μm channel-correlation with visible reflectance for use in remote sensing of aerosol. IEEE Transactions on Geoscience and Remote Sensing, 35: 1286-1298. doi: http://dx.doi. org/10.1109/36.628795.
Kross A., McNairn H., Lapen D., Sunohara M., Champagne C. (2015) - Assessment of RapidEye vegetation indices for estimation of leaf area index and biomass in corn and soybean crops. International Journal of Applied Earth Observation and Geoinformation,
34: 235-248. doi: http://dx.doi.org/10.1016/j.jag.2014.08.002.
Kueffer C., Daehler C.C., Torres-Santana C.W., Lavergne C., Meyer J.-Y., Rudiger O., Silva L. (2010) - A global comparison of plant invasions on oceanic islands. Perspectives in Plant Ecology Evolution and Systematics, 12: 145-161.
Lira C., Lousada M., Falcão A.P., Gonçalves A.B., Heleno S., Matias M., Pereira J.M., Pina P., Sousa A.J., Oliveira R., Almeida A.B. (2013) - The 20 February 2010 Madeira Island flash-floods: VHR satellite imagery processing in support of landslide inventory and sediment budget assessment. Natural Hazards Earth System Science, 13: 709-719.
doi: http://dx.doi.org/10.5194/nhess-13-709-2013.
Lira C., Lousada M., Falcão A.P., Gonçalves A.B., Heleno S., Matias M., de Sousa J., Pereira J.M., Pina P., Oliveira R., Almeida A.B. (2011) - Automatic detection of landslide features with remote sensing techniques: Application to Madeira Island. IEEE International Symposium on Geoscience and Remote Sensing Symposium (IGARSS),
Vancouver, BC, pp. 1997-2000.
Lu D. (2014) - Aboveground biomass estimation using Landsat TM data in the Brazilian Amazon. Brazilian Amazon International Journal of Remote Sensing, 2612: 2509-2525.
doi: http://dx.doi.org/10.1080/01431160500142145.
Matthew M.W., Adler-Golden S.M., Berk A., Felde G., Anderson G.P., Gorodetzky D., Paswaters S., Shippert M. (2002) - Atmospheric correction of spectral imagery: evaluation of the FLAASH algorithm with AVIRIS data. Proceedings of Applied Imagery Pattern Recognition Workshop, pp. 157-163. doi: http://dx.doi.org/10.1109/ AIPR.2002.1182270.
http://proceedings.spiedigitallibrary.org/proceeding.aspx?articleid=905908 (Accessed September 1, 2015).
Medail F., Quezel P. (1997) - Hot-spot analysis for conservation of plant biodiversity in the Mediterranean Basin. Annals of the Missouri Botanical Garden, pp. 112-127.
Mesquita S., Capelo J., de Sousa J. (2004) - Bioclimatologia da Ilha da Madeira: abordagem numérica. In: A paisagem vegetal da Ilha da Madeira. Lisboa, Capelo J. (Ed.), ALFA, pp. 47-60.
Michelson D.B., Seaquist J.W. (1995) - Change detection in Swedish landcover from a year of ERS-1 SAR data. Sensors and Environmental Applications of Remote Sensing, pp. 123-129.
Mutanga O., Adam E., Cho M.A. (2012) - High density biomass estimation for wetland vegetation using WorldView-2 imagery and random forest regression algorithm.
International Journal of Applied Earth Observation and Geoinformation, 18: 399-406.
doi: http://dx.doi.org/10.1016/j.jag.2012.03.012.
Nasa Visible Earth (2010) - Fires in Madeira, Portugal. Available online at: http://
visibleearth.nasa.gov/view.php?id=45262 [Accessed July 11, 2016].
Polychronaki A., Spindler N., Schmidt A., Stoinschek B., Zebisch M., Renner K., Sonnenschein R., Notarnicola C. (2015) - Integrating rapideye and ancillary data to map alpine habitats in South Tyrol, Italy. International Journal of Applied Earth Observation
and Geoinformation, 37: 65-71. doi: http://dx.doi.org/10.1016/j.jag.2014.11.008.
Pontius R.G.J., Millones M. (2011) - Death to Kappa : birth of quantity disagreement and allocation disagreement for accuracy assessment. International Journal of Remote
Sensing, 32: 4407-4429. doi: http://dx.doi.org/10.1080/01431161.2011.552923.
Prada S., Menezes de Sequeira M., Figueira C., Oliveira da Silva M. (2009) - Fog precipitation and rainfall interception in the natural forests of Madeira Island (Portugal).
Agricultural and Forest Meteorology, 149: 1179-1187. doi: http://dx.doi.org/10.1016/j.
agrformet.2010.04.009.
RapidEye (2012) - Satellite imagery product specifications. Available online at: www.
rapideye.com.
Richards J.A., Jia X. (1999) - Remote Sensing Digital Image Analysis. Springer Berlin Heidelberg. Available online at: http://www.springerlink.com/
index/10.1007/978-3-662-03978-6.
Rivas-Martinez S. (2008) - Global Bioclimatics - Clasificación Bioclimática de la Terra. Phytosociological Research Center. Available online at: http://www.globalbioclimatics. org/.
Roerndink J.B.T.M., Meijster A. (2000) - The watershed Transform: Definitions, Algorithms and parallelization Strategies. Fundamenta Informaticae, pp. 187-228.
Rouse J.W., Haas R., Schell J.A., Deering D.W., Harlan J.C. (1974) - Monitoring the vernal advancement and retrogradation (Greenwave effect) of natural vegetation. Greenbelt,
MD, USA.
Schuster C., Förster M., Kleinschmit B. (2012) - Testing the red edge channel for improving land-use classifications based on high-resolution multi-spectral satellite data.
International Journal of Remote Sensing, 33: 5583-5599. doi: http://dx.doi.org/10.1080 /01431161.2012.666812.
multitemporal RapidEye satellite data. Remote Sensing of Environment, 136: 66-75. doi: http://dx.doi.org/10.1016/j.rse.2013.05.001.
Tucker C.J. (1979) - Red and photographic infrared linear combinations for monitoring vegetation. Remote Sensing of Environment, 8: 127-150. doi: http://dx.doi. org/10.1016/0034-4257(79)90013-0.
Vuolo F., Atzberger C., Richter K., Dash J. (2010) - Retrieval of Biophysical Vegetation Products From Rapideye Imagery. Symposium a Quarterly Journal in modern foreign literatures, XXXVIII: 281-286. Available online at: http://www.isprs.org/proceedings/ XXXVIII/part7/a/pdf/281_XXXVIII-part7A.pdf.
World Heritage Committee (2009) - Convention Concerning the Protection of the World Cultural and Natural Heritage. Seville, Spain.
Xie Y., Sha Z., Yu M. (2008) - Remote sensing imagery in vegetation mapping: a review.
Journal of Plant Ecology, 1: 9-23. doi: http://dx.doi.org/10.1093/jpe/rtm005.
Zbyszewski G. (1971) - Reconhecimento geológico da parte ocidental da ilha da Madeira,
Lisboa.