THE IMPACT OF INTANGIBLES ON THE PERFORMANCE
OF THE MAJOR TECHNOLOGICAL COMPANIES IN THE
WORLD
Catarina Filipa Pitau Ferreira
Dissertation submitted as partial requirement for the conferral of Master in Accounting
Supervisor:
Prof. Dr. Ilídio Tomás Lopes, Prof. Auxiliar, ISCTE Business School, Departamento de Contabilidade
I Abstract
Intellectual capital has been the focus of research in the knowledge-based economy, with authors attributing its intangibles the capacity of generating value for the company and constituting competitive advantages capable of enhancing business performance. Thus, if intangibles are associated with expected returns, a positive impact on turnover, and on other key performance indicators, can be expected. This research aims to identify the impact of different intangibles on the performance and profitability of the 25 major technological companies in the world, for a four-year period analysis (2014 – 2017), including characteristics of the board of directors as proxies of human capital. In order to achieve this goal, the correlation between the intangibles and performance was assessed through Pearson’s correlation coefficients, and multiple linear regression models were utilized. Broadly, based on the theoretical models, empirical evidence has shown a negative impact of some of the intangible assets disclosed on companies’ financial position on performance. The characteristics of the board displayed a positive effect on turnover, when considered alongside disaggregated measures of intangibles, reflecting synergetic effects between the variables. The most significant contribution to performance arises from software and research and development expenses, underlining the crucial role of innovation capital in this sector.
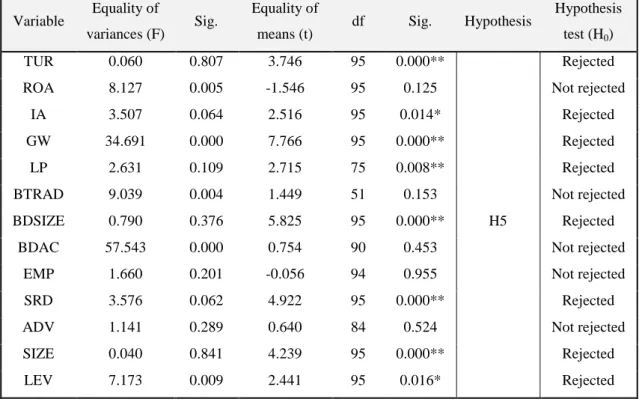
Complementarily, this study assesses whether the distribution of the intangibles varies among regions, finding it does for the variables intangible assets, goodwill, licenses and patents, size of the board of directors, software and R&D and turnover, which presented higher means for the North-American region.
Keywords: Intangibles, intellectual capital, business performance, technological sector. JEL Classification: G30, M41, L25.
II Resumo
O capital intelectual tem sido o foco de investigação na nova economia do conhecimento, com autores a atribuírem aos intangíveis a capacidade de gerar valor e constituírem vantagens competitivas capazes de melhorar a performance organizacional. Assim, sendo os intangíveis associados a retornos futuros, é esperado um impacto positivo no volume de negócios e noutros indicadores de performance. Este trabalho pretende identificar o impacto dos diferentes intangíveis na performance e rentabilidade das 25 maiores empresas tecnológicas do mundo, num período de 4 anos (2014 – 2017), incluindo características do conselho de administração em representação do capital humano das empresas. Deste modo, a correlação entre os intangíveis e a performance foi avaliada através dos coeficientes de correlação de Pearson e foram utilizados modelos de regressão linear múltipla. Evidências empíricas sugerem um impacto negativo na performance por parte de alguns ativos intangíveis divulgados na posição financeira das empresas. As características do conselho de administração mostram um efeito positivo no volume de negócios quando consideradas juntamente com intangíveis desagregados, o que reflete efeitos sinergéticos entre as variáveis. A contribuição mais significativa para a performance é do software e das despesas de pesquisa e desenvolvimento das empresas, salientando o papel crucial do capital de inovação neste setor.
Complementarmente, este trabalho testa a diferença da distribuição dos intangíveis segundo regiões, o que se verifica no caso das variáveis: ativos intangíveis, goodwill, licenças e patentes, tamanho do conselho de administração, software e P&D e volume de negócios, as quais apresentam médias superiores para a região Norte Americana.
Palavras-chave: Intangíveis, capital intelectual, performance organizacional, setor tecnológico.
III Acknowledgements
The conclusion of this dissertation represents the end of a journey I never travelled alone. For that reason, I would like to present my gratitude to the ones who made its conclusion possible.
Primarily, I would like to thank professor Ilídio Tomás Lopes for all the guidance, availability and comprehension demonstrated this last year, without which the termination of this study would never be possible.
Secondly, my appreciation goes to my family and friends who supported and motivated me along the way. Nevertheless, there are a few people I would like to highlight. My truest appreciation goes to Francisco, whose unconditional support, never-ending belief in me and patience even in the most difficult days always appeased me and never let me lose sight of what is important.
Finally, to my parents, who transmitted me essential values that are present in everything I do. To my mother, who shows me every day that life is for those who fight and do not give up, and that there is beauty in being a force of nature. To my father, who since an early age always made me believe that I am capable of anything. It is the culmination of an effort that was not only mine. A final note to my brother, who spent all these months saying I was on vacation.
IV Index
1 Introduction ... 1
1.1 Relevance of the topic ... 1
1.2 Objectives ... 1 1.3 Methodology ... 2 1.4 Structure ... 2 2 Theoretical Framework ... 3 2.1 Categories of intangibles ... 3 2.2 Intangible assets ... 3 2.3 Intellectual capital... 4
2.4 Resource-based view and knowledge-based view of the firm ... 6
3 Literature Review ... 8 4 Methodology ... 23 4.1 Objectives ... 23 4.2 Investigation paradigm ... 23 4.3 Data ... 23 4.4 Variables ... 24 4.5 Regression models ... 27 4.6 Investigation hypotheses ... 28
5 Results and Discussion ... 30
5.1 Descriptive measures ... 30
5.2 Correlations ... 31
5.3 Multiple Linear Regression Models ... 35
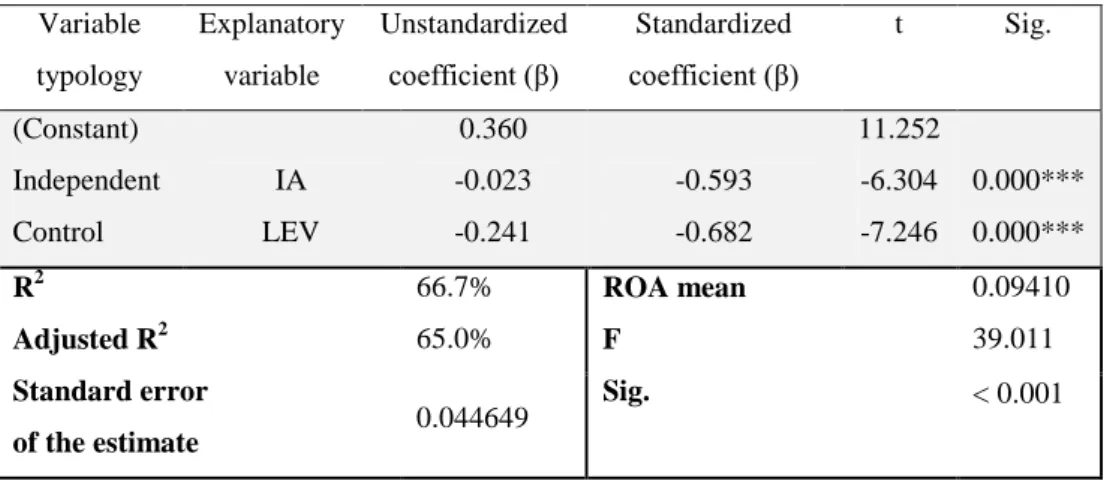
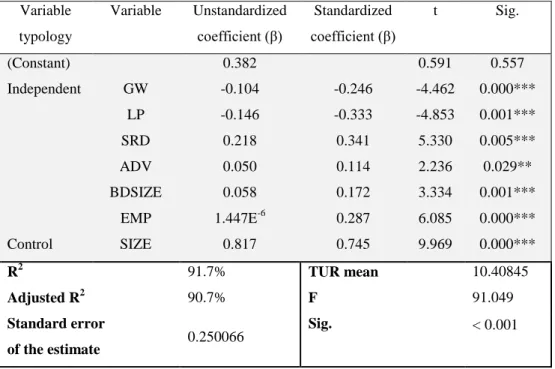
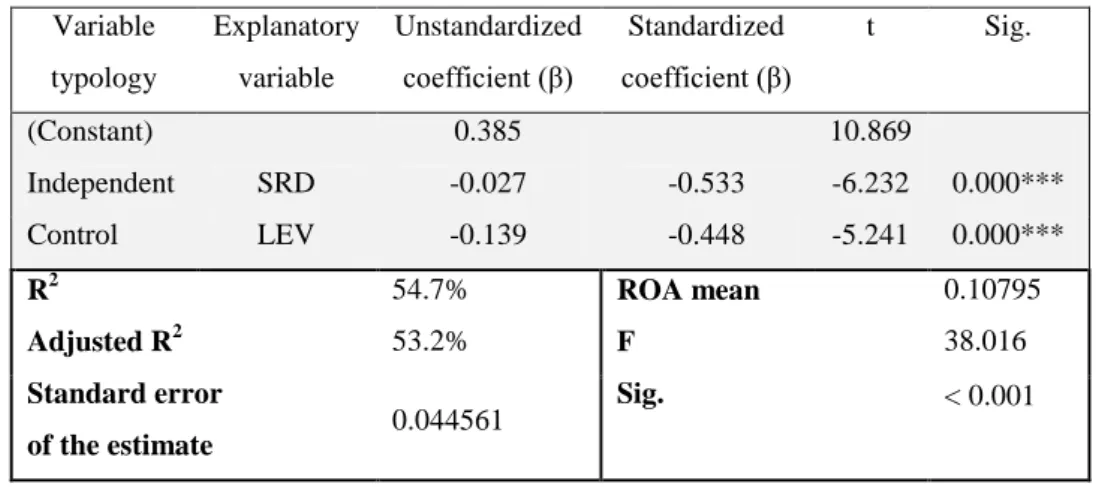
5.3.1 Explanatory factors of performance for each model ... 35
5.3.2 Global analysis and discussion of results ... 42
5.3.3 Reliability of the models ... 47
5.4 Distribution of the intellectual capital drivers depending on the region ... 48
6 Conclusion ... 51
6.1 Limitations ... 55
6.2 Further research ... 55
7 References ... 56
V Tables Index
Table 1 – Variables’ description and framework. ... 25
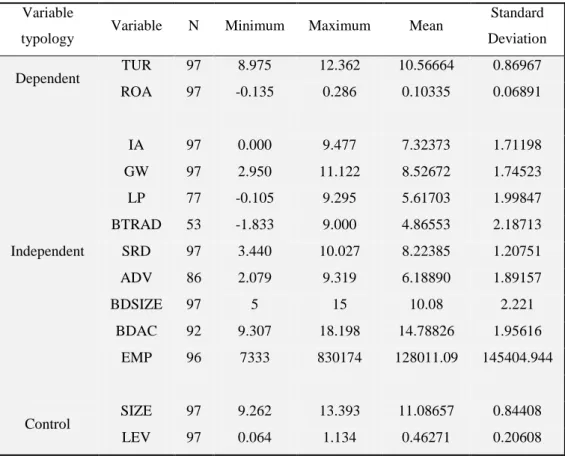
Table 2 - Descriptive measures. ... 30
Table 3 – Pearson correlation coefficients (Model 1). ... 32
Table 4 – Pearson correlation coefficients (Model 2). ... 33
Table 5 – Pearson correlation coefficients (Model 3). ... 34
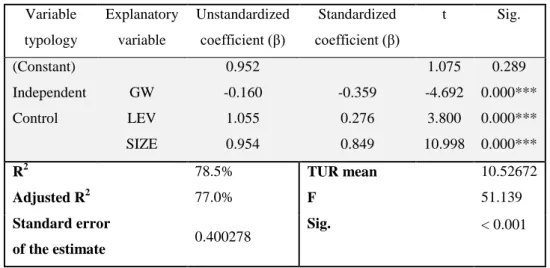
Table 6 - The effect of the significant explanatory variables on TUR, in Model 1. ... 36
Table 7 - The effect of the excluded variables on TUR, in Model 1. ... 36
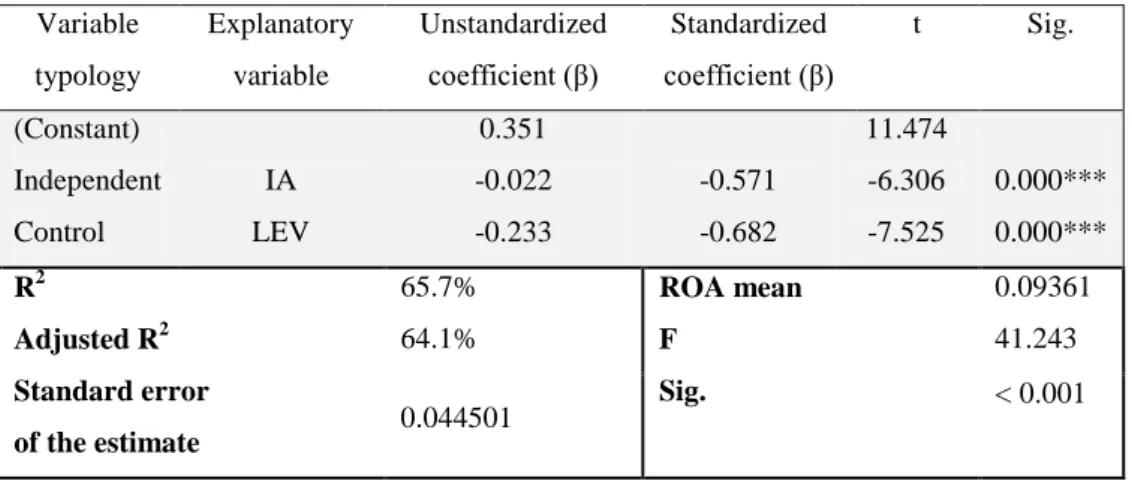
Table 8 - The effect of the significant explanatory variables on ROA, in Model 1. ... 37
Table 9 - The effect of the excluded variables on ROA, in Model 1. ... 37
Table 10 - The effect of the significant explanatory variables on TUR, in Model 2. .... 38
Table 11 - The effect of the excluded variables on TUR, in Model 2. ... 38
Table 12 - The effect of the significant explanatory variables on ROA, in Model 2. .... 39
Table 13 - The effect of the excluded variables on ROA, in Model 2. ... 39
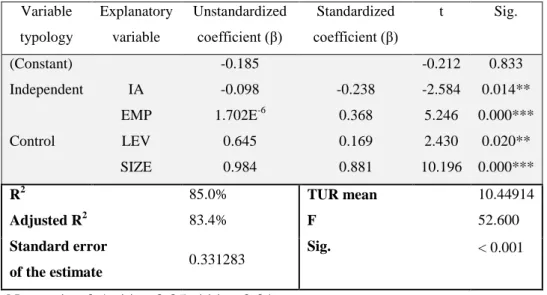
Table 14 - The effect of the significant explanatory variables on TUR, in Model 3. .... 40
Table 15 - The effect of the excluded variables on TUR, in Model 3. ... 40
Table 16 - The effect of the significant explanatory variables on ROA, in Model 3. .... 41
Table 17 - The effect of the excluded variables on ROA, in Model 3. ... 41
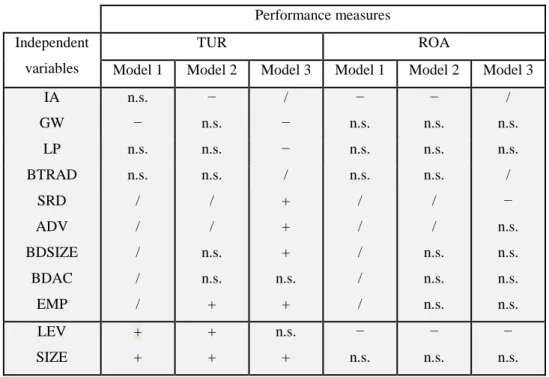
Table 18 – Synthesis of the independent variables that explain performance... 42
Table 19 - T-test to compare the equality of means between the variables of North-American companies and the variables from the remaining regions. ... 48
Table 20 – Comparison of the means between the variables of North-American companies and the variables of the remaining regions. ... 49
1 1 Introduction
1.1 Relevance of the topic
The topic of how intangibles contribute to a company’s performance is not new, especially when considering them as part of intellectual capital. In fact, intellectual capital has been the focus of several researches in the past decades. Although not having a general definition, this concept is referred to as ‘the sum of all of the intangible and knowledge-related resources that an organization is able to use in its productive processes in the attempt to create value’ (Kianto et al., 2014: 364). With the shift of focus to intangibles as resources that can constitute a competitive advantage for the firm (Barney, 1991), the search for comprehension on its importance to companies’ results is becoming more relevant.
Nonetheless, several studies reveal conflicting results considering this subject and have different perspectives on the contribution of intangibility to performance. Thus, in spite of its continuously increasing importance to the firms, intellectual capital’s disclosure on financial reports is still very limited, which reinforces the necessity for further research on the topic in order to make this disclosure possible.
This study aims to contribute to the literature by increasing the knowledge of intangibles and their contribution to organizational performance. Furthermore, this research innovates by analyzing the technological sector, which is a sector that has not been further analyzed by investigators and is here represented by the major companies in the world. It has been shown that the sector in which companies operate can contribute to the transformation of intangibles into company market value (Shakina and Molodchik, 2014) and have impact on their profitability (Tudor et al., 2014). Hence, it would be interesting to assess whether the results for this industry corroborate or refute the literature regarding the vital role of intangibles on performance.
1.2 Objectives
The general purpose of this study is to identify the impact of intangibles on the performance of the main technological companies in the world. The intangibles were selected as proxies of intellectual capital in order to conclude on its contribution to financial performance. The specific objectives consist of (i) investigating the effect of intangibles disclosed in companies’ financial position on performance; (ii) examining the effects of disaggregation of intangibles on performance and (iii) evaluating on what extent the characteristics of the board of directors as a representation of human capital
2 contribute to obtain future economic benefits. Furthermore, it will be determined whether the distribution of these intellectual capital drivers does depend on the region.
1.3 Methodology
The study conducted follows a positivist research approach, which comprehends the existence of an autonomous reality that is separated from the investigator and is independent from the researcher’s perspective or belief (Scott, 2012). This methodology permits to validate the knowledge through empirical confirmation by formulating the investigation hypotheses and analyzing the obtained results in order to verify or dismiss the theory. Positivism is commonly associated with a quantitative nature, relying on statistical and mathematical techniques to obtain objective results. This approach is frequently used by investigators when studying matters related to intangibles and intellectual capital.
Regarding the sample, it was selected considering Forbes’ ranking ‘World’s 25 Biggest Tech Companies in 2016’ (Forbes, 2017) and this study aims to determine the contribution of intangibles to the financial performance of these companies. This was the chosen sample to represent this sector since it comprehends the major companies in this industry, thus, the ones expected to have higher levels of intangibles and a more complete disclosure of intellectual capital.
The analysis of the data will be realized through descriptive statistics, correlation and multiple linear regressions in order to achieve the objectives proposed for this study, which will be conducted using the Statistical Package for Social Sciences (SPSS) program.
1.4 Structure
The structure of the present dissertation is as follows: chapter 1 constitutes the introduction to the topic, followed by the theoretical framework in chapter 2 and the literature review of the most significant studies about this theme, in chapter 3. The forth chapter explains the methodology chosen to achieve the objectives and introduces the investigation questions. Chapter 5 presents the discussion of the obtained results and, lastly, the sixth chapter regards the conclusion of this study, as well as its limitations and suggestions for future research.
3 2 Theoretical Framework
2.1 Categories of intangibles
Andriessen (2004: 18) defines intangible resources as ‘nonmonetary resources without physical substance that in combination are able to produce future benefits for an organization’. In another definition, Lev (2001) describes intangibles as claims to future benefits that lack physical or financial embodiment, and which are created by innovation, exclusive organizational designs, or human resources practices.
In earlier approaches, Hall (1992) considered that intangible resources should be classified as assets or skills. Intangible assets would include the intellectual property rights of patents, trademarks, copyright and registered designs, contracts, trade secrets and data bases. On the other hand, intangible resources classified as skills would represent the competencies of employees (such as know-how), suppliers and advisers, as well as the organizational culture of the company. Nowadays, intangibles are generally classified as knowledge resources, as intangible assets or as intellectual capital (Lopes and Ferraz, 2016).
2.2 Intangible assets
International Accounting Standard (IAS) 38 is the standard to be applied in accounting for intangible assets that are not under the assumption of another and more specific norm, and which focuses on the recognition and measurement of intangible assets. As supported by this norm, assets are resources from which future economic benefits are expected to flow to the entity if they are identifiable and controlled by it. An intangible asset is a non-monetary asset without physical substance that, to be recognized as so, must meet the previous criteria. Hence, if an item does not meet them, its expenditure (to acquire or generate internally) must be recognized as an expense when it is incurred.
When an intangible asset is generated internally, it must be classified according to two phases: the research phase and the development phase. In the first one, the expenditures occurred shall be recognized as expenses in that period due to the fact that the entity cannot prove that an intangible asset capable of generating future economic benefits exists. This is the case of activities aiming to obtain new knowledge or the search for new alternatives for materials, devices and products, among others. The cost of generating an intangible asset internally is often difficult to distinguish from the cost of maintaining or enhancing the entity’s operations or goodwill. This is why internally
4 generated brands, mastheads, publishing titles, customer lists and similar items are not recognized as intangible assets (IFRF, 2014). In the development phase, the expenses must be capitalized, since it is possible to identify the intangible asset and demonstrate its potential to generate future economic benefits. These expenses are associated with the design, construction and testing of new materials, devices, products, processes, systems or services before their commercial production or use.
Computer software, licenses, trademarks, patents, films and copyrights are some of the resources considered intangible assets under the assumption of IAS 38, whereas expenditure on advertising, research and development activities and similar outflows are not, thus must be recognized as expenses instead of capitalized.
Intangible assets have a volatile nature and the verification of their existence can be difficult, which leads to complications in their measurement and subsequent exclusion from the financial statements (Lopes and Martins, 2015). In accordance with international accounting norms, ‘goodwill recognized in a business combination is an asset representing the future economic benefits arising from other assets acquired in a business combination that are not individually identifiable and separately recognized’ (IFRF, 2014). Goodwill acquired in a business combination is within the scope of International Financial Reporting Standard (IFRS) 3, whereas internally generated goodwill is under the assumption of IAS 38 even though it cannot be recognized as an intangible asset because it is not identifiable – which means it cannot be separated from the total value and does not arise from legal rights. Thus, internally generated goodwill is an aggregated amount of all the intangibles that cannot be identified nor separately measured, representing the intangibles not recognized in the financial statements that, in spite of this fact, can have significant (though uncertain) future returns (Lopes and Martins, 2015; Zhang, 2013).
2.3 Intellectual capital
Intellectual capital (IC) is a much broader term. It embodies components such as intangible assets, intangible resources, invisible assets, intellectual property and intangibles in general (Kaufman and Schneider, 2004; Sonnier, 2008). Edvinsson and Malone (1997: 44) define it as ‘the possession of the knowledge, applied experience, organizational technology, customer relationships and professional skills that provide a company with a competitive edge in the market’. Overall, it represents ‘the sum of all of the intangible and knowledge-related resources that an organization is able to use in its
5 productive processes in the attempt to create value’ (Kianto et al., 2014: 364). Although there is no exact definition of this concept, it is commonly accepted to be divided into three categories: human capital, structural/organizational capital and relational capital (Sveiby, 1997). This model is currently referred to as the tripartite model of IC dimensions or three-dimensional IC measurement model (Inkinen et al., 2017; Hussinki et al., 2017).
IC comprises the valuable knowledge-based resources and the management activities related to them (Kianto et al., 2013). In this regard, human capital represents ‘the skills, intellect, attitudes, talent, and other tacit knowledge embodied in employee and management bodies’ (Lopes and Ferraz, 2016: 393). In other words, it represents the contribution of the exclusivity of the human factor to the entity. Relational capital refers to the value and the knowledge that reside in the relationships with internal and external stakeholders and the creation of a network between them (Inkinen et al., 2017; Lopes et al., 2016; Sánchez-Segura et al., 2014; Sonnier, 2008). Organizational capital concerns the information obtained and transmitted, while structural capital regards the knowledge residing in the organization and technology, fomented by the individual capabilities used in the organizational structure, often represented by processes, information systems, databases, patents, licenses, software and products (Inkinen et al., 2017; Lopes and Ferraz, 2016; Sánchez-Segura et al., 2014).
Some studies reveal the importance of enlarging the three-dimensional IC measurement model to include more elements. Inkinen et al. (2017) question the applicability of the tripartite model of IC dimensions, stating that it fails to consider the possible variation of intangible assets’ value in different conditions. This study suggests a seven-dimension model, including entrepreneurial capital, trust capital and renewal capital, as well as dividing relational capital into internal and external relational capitals. The objective was to assess if the IC structure is universal across its different dimensions or if it varies within countries and cultural background. The authors concluded that the structure of IC across countries is predominantly constituted by the same elements, encouraging researchers to continue to utilize the tripartite universal model. Nonetheless, it would benefit from the inclusion of renewal capital, which represents the skills for learning and development in order to create new knowledge (Kianto et al., 2010), and entrepreneurial capital, consisting on the present value of generated future entrepreneurial behavior, which is the competence and commitment of pursuing opportunities (Erikson, 2002). Their relevance was proven by this paper in the
6 increasingly globalized business environments. Previous studies support the inclusion of different categories of IC on the tripartite model, supporting the relevance of renewal capital (Kianto et al., 2010; Cesaroni et al., 2015; Buenechea et al., 2016) and entrepreneurial capital (Erikson, 2002; Cesaroni et al., 2015; Buenechea et al., 2016) and suggesting new dimensions. Some of the new dimensions suggested are innovation capital – the ability to build on previous knowledge and generate new knowledge, which consists on the aptitude to develop new products and innovative ideas (Maditinos et al., 2010; Tseng and Goo, 2005; Chen et al., 2004) – and trust capital – willingness to be vulnerable to the actions of another party, hereby specifically referring to the trust embedded in a company’s internal and external relationships (Mayer et al., 1995).
The importance of IC in value creation seems to be undeniable, promising to be ‘capable of explaining the value of knowledge in knowledge-intensive companies and in growing knowledge-based economies’ (Sánchez-Segura et al., 2014: 863).
2.4 Resource-based view and knowledge-based view of the firm
According to Barney (1991), a firm has a competitive advantage when it is implementing a value creating strategy different from the ones being implemented by its competitors. This competitive advantage is sustainable when the benefits from that strategy are unable to be duplicated by the company’s competitors. The resource-based view (RBV) of the firm relies on the argument that such strategies derive from the resources and capabilities that a company controls. However, not every resource of the firm constitutes a competitive advantage. In this scope, a sustainable competitive advantage exists when a resource is valuable, rare and difficult to imitate, trade or substitute. These resources and resulting competitive advantages are expected to contribute to companies’ superior performance.
A different approach that addresses the role of knowledge and its management on organizational competitiveness and performance is the knowledge-based view (KBV) of the firm. KBV is an extent of RBV that understands knowledge as the strategically most important resource of the firm (Grant, 1996). This view recognizes that the production of a good or service involves the application of different types of knowledge which, additionally to the importance of having resources that are valuable, rare, inimitable and non-substitutable (Barney, 1991), requires the firm to be aware and able to integrate, apply and manage different types of knowledge (Grant, 1996; Kogut
7 and Zander, 1992). Thus, one of the crucial points of KBV is the management of knowledge leading to organizational performance (Kianto et al., 2013).
Both of these approaches highlight the facts that the competitiveness of a company does not solely depend on the product-market positioning in relation to external competitors (Kianto et al., 2013), as it strongly relies on its distinct intern characteristics. While RBV literature focuses on the identification and strategic management of resources that constitute sustainable competitive advantages – which are mainly intangible, knowledge-based assets –, KBV studies the role of management in the value creation, use and appropriation of a firm’s knowledge-based assets, that is to say, intellectual capital (Sonnier, 2008). Hence, in a knowledge-based economy that is driven by intellectual capital (Gan and Saleh, 2008; Sánchez-Segura et al., 2014; Sharma and Dharni, 2016), the better a company is on managing its intangibles and strategically consider them, the more likely it is for it to achieve high levels of performance (Kianto et al., 2013).
8 3 Literature Review
Intellectual capital has become a critical concept for evaluating a company’s worth. Indeed, Edvinsson and Malone (1997) establish it as the difference between the market and the book value of a business. In the knowledge-based economy, this difference consists of the intangible resources that cannot be properly measured and reported within the traditional accounting framework (Salehi et al., 2014; Pal and Soriya, 2012). These resources are vigorously associated with knowledge, which, in many instances, means they cannot be evaluated by conventional methods due to the non-existence of a market price (Heiens et al., 2007). Contrarily, tangible assets can be easily imitated or purchased in a free market, making them impossible to be considered as strategic assets or to create competitive advantage for the business (Salehi et al., 2014). Accordingly, firms have shifted their focus to intangible assets, whose nature has the ability to permit the creation of a sustainable competitive advantage (Shakina and Molodchik, 2014). Yet, this immaterial nature contributes to a complex evaluation and management of these assets (Pucci et al., 2015) due to the inexistence of an organized market, the difficulty in verifying their existence, the possibility of not having finite lives, the potential fluctuation of their value and the possibility of them being embodied in a specific activity (Lopes and Martins, 2015). Hence, intangibles are expected to be of value for a company although their volatile nature and the difficulties in their measurement commonly exclude them from financial statements (Lopes and Martins, 2015). In fact, Ilmakunnas and Piekkola (2014) argue that the only time IC is fully evaluated is at mergers and acquisitions.
Nonetheless, intellectual capital is a vital resource of any knowledge-intensive company. It comprises all the ‘intangible assets that contribute to the delivery of a company’s value proposition, like individual and group talents and skills, people’s knowledge and experience, patents, copyright, models, methods or procedures’ (Sánchez-Segura et al., 2014: 862). Gan and Saleh (2008) refer to IC in two aspects. One comprised by the standards − which includes patents, intellectual property, brand and trademarks − and the second one is the ‘soft asset’ such as knowledge, information, and experience, which many researchers consider as the core of IC today.
In spite of its continuously increasing importance to the firms, IC’s disclosure on financial reports is still very limited, which reinforces the necessity for further research on the topic in order to make this disclosure possible.
9 As previously mentioned, the transition of the economy from capitalist to knowledge and technology driven motivated the change of focus from tangible resources to intangible (Sharma and Dharni, 2016). Furthermore, the increasing gap between the market value and the book value of the companies has motivated the conduction of several studies in the past decades in order to identify the impact the intangibles have on performance and the extent of their contribution.
According to IAS 38, intangibles are expected to generate future economic benefits for the company, which can be expected to contribute positively to the performance of the entity, and to be reflected on its performance indicators. The literature, in its majority, firmly supports their positive and significant effect on organizational performance, considering intangible assets as the main source of competitive advantage for the firms (Sharma and Dharni, 2016; Shakina and Molodchik, 2014; Sánchez-Segura et al., 2014; Omil et al., 2011).
Amadieu and Viviani (2010) highlight two main methodologies used when approaching the relationship between intangibles and companies’ performance. The first one regards the study of investment on intangibles and capital market financial performance measures (such as share returns, holding period returns and Tobin’s Q). Alternatively, the second one investigates the relationship between intangible assets and performance measures, which can be mainly financial (return on assets (ROA), return on equity (ROE), return on investment (ROI),…) or nonfinancial (for instance, market share and gross margin). This literature review will incorporate both approaches, in order to obtain a general appraisal of IC’s effect on performance.
Shakina and Molodchik (2014) stress the importance of intangibles as strategic assets and as a competitive advantage that is the principal cause of additional profit for a company. They used Economic Value Added (EVA) to determine whether the investment attractiveness of the company was influenced by intangible assets and which factors support or obstruct market value creation through IC. The results corroborate their assumption and indicate that the size (measured by book value of total assets and number of employees) and the industry in which the company is inserted influence value creation. This study also reinforces the importance of innovation activities, which were measured by the investment in research and development (R&D), showing a positive and significant relation with value creation.
10 In a different study aiming to confirm the assumption of IAS 38 that intangibles are associated with future economic benefits (IFRS, 2014), Lopes and Martins (2015) studied 127 listed companies in the Iberian Stock Exchange Markets in order to identify the impact of IC on the businesses’ turnover. These results showed a positive and significant correlation between the intangibles capitalized in the statement of financial position and performance. Furthermore, consistently with the previous study, the independent variable size (measured by total assets) presented significant results, confirming firms with higher level of assets tend to generate a higher level of turnover, revealing the presence of scale effects. Pucci et al. (2015) analyze the impact of intangible assets, such as patents, copyrights, brands and advertisement, on firms’ economic performance through their impact on the level of intellectual capital. Conclusions were taken for the Italian children’s clothing industry after the analysis of 45 companies. Intellectual capital was measured using the knowledge capital scorecard method and its correlation with profitability measures, namely return on investments, return on sales (ROS), return on assets, return on equity and capital turnover, was evaluated. Empirical evidence suggests that IC value is positively associated with every measure of performance except for turnover, having a high correlation with ROI, ROS and ROA, which are the performance measures commonly used by entrepreneurs (Pucci et al., 2015). Posteriorly, the authors evaluated the impact of the intangible assets on IC, proving a significant contribution of their interaction on IC level. Hence, the authors corroborate the possibility to use intellectual capital value as an indicator that measures the contribution of certain intangible resources to firm results, highlighting the importance of IC to economic performance.
In a recent paper regarding the effects of IC components on performance, Nadeem et al. (2016) defend that the relationship between IC and organizational performance is bidirectional and therefore should be considered dynamic, stating that lagged firm performance affects current or future IC efficiency. To conclude on this assumption, the authors measured the relationship between IC efficiency and the performance of 774 firms from the London Stock Exchange. The results show that VAIC (Value Added Intellectual Coefficient) is positively and significantly related to firm performance, mainly with return on assets and return on equity. When analyzing the IC’s components separately, Nadeem et al. (2016) observed that structural capital and physical capital are of great importance for firm performance, and human capital
11 was only found significant when using the static approach of Ordinary Least Squares (OLS) regression instead of the dynamic one. These results are congruent with most of the existent studies in the literature regarding the relevance of IC, but display the importance that is still attributed to physical assets on financial performance. A similar study from Sardo et al. (2018) analyzed the effect of intellectual capital on small- and medium-sized enterprises’ (SMEs) hotel financial performance, using a sample of 934 Portuguese companies. As well, this study adopted the Generalized Method of Moments (GMM) system estimator to analyze a dynamic panel data. The findings suggested that intellectual capital components, i.e., human capital, structural capital and relational capital provide a positive impact on financial performance, with human and structural capitals presenting the higher impact on return on assets. The results support that investments in IC take time to generate profitability and return, stressing that size has a negative impact on financial performance, suggesting that larger companies are less profitable in the hotel industry.
Lopes et al. (2016) discovered that, for the top 30 airlines worldwide, intellectual capital drivers, such as intangible assets, are significant in the prediction of ‘the most direct indicator of return’, turnover. The obtained results support the importance of human capital − namely employees’ expenses and benefits and the size of board of directors − and structural capital in the prediction of this indicator of profitability. However, the relationship between IC and other performance indicators, such as ROA, ROE and ROS, could not be validated. They also concluded that only variables associated with financial leverage and scale effects have a significant impact on profitability, with region not playing an important role on performance.
Not many studies find evidence on the negative or null impact of intangibles to performance. Nonetheless, an investigation on the French wine companies’ financial performance and its relation with intangible investments came to such conclusion. Amadieu and Viviani (2010) analyzed the financial statements of 207 SMEs of the wine industry and concluded on a negative impact of intangibility intensity on financial performance, measured by return on assets. The authors state that, for this industry, intangible assets are used in an ineffective way and, in order to guarantee financial success, intangible expenses should be accompanied by organizational and managerial changes. Pal and Soriya (2012) compared the IC performance between Indian pharmaceutical and textile industries using VAIC and association of IC with financial
12 indicators such as turnover, ROA, ROE and market to book value of the companies. Results show that, although both sectors are efficiently using IC, there was no impact of IC on the productivity of the companies, which was measured by turnover. Regarding the other measures of performance, the authors found that profitability measured by ROA increases with IC efficiency. Conversely, ROE is only positively influenced by IC in the case of pharmaceutical industry, due to the fact of it being a knowledge intensive sector. When analyzing the market valuation of the companies, the authors found no impact of IC, which reflects the lack of consideration of intangibles in the stakeholders’ decision-making, who prioritize other factors relative to performance.
Bubic and Susaz (2015) analyzed the impact intangible assets have on the profitability of Croatian companies and assessed their relationship with bankruptcy status. Their study established that companies which invest in intangible assets are less likely to bankrupt. In spite of that fact, they found no strong evidence that supports a positive relationship between investment in intangible assets and profitability ratios (ROA, ROE, net profit margin (NPM), gross profit margin (GPM) and return on capital employed (ROCE)), with the exception of EBIT (earnings before interests and taxes) and EBITDA (earnings before interests, taxes, depreciation and amortization), which continually increase as the investment in intangible assets grow.
These studies allow for the conclusion that, even though there is no consensus regarding the contribution of intangibles to performance, their importance has been the focus of the research in the field of accounting and finance in the last two decades (Nadeem et al., 2016), which emphasizes the relevance of this topic.
Lopes and Ferraz (2016) examined 125 non-financial business organizations listed on an Iberian stock exchange with the objective of identifying the impact of IC and the effect of boards’ expertise and knowledge on performance. In this respect, turnover was used as the main performance indicator and return on assets, return on equity and return on sales as complementary measures. The authors concluded on the positive and significant impact of intangibles on turnover of non-financial Iberian companies, not finding empirical evidence of the impact on the complementary indicators. Regarding the characteristics of the board, the study proved that the size of the board and the participation of the members on other internal or external boards of the organization are significantly associated with turnover.
13 In reality, corporate governance literature attributes an increasing importance to board of directors as ‘an expression of competence, professionalism, skills, knowledge, experience, culture and management abilities, to conduct the business’ (Lopes and Martins, 2015: 471). Board size is an important attribute of board structure and has been widely used as a proxy for human capital, complementary to other boards’ characteristics that represent the expertise and tacit knowledge of employees and management parties.
In this scope, Uadiale (2010) conducted a study to examine the impact of board structure on corporate financial performance in Nigeria, investigating the composition of boards of directors in Nigerian quoted firms. The OLS regression was used in order to estimate the relationship between corporate performance measures and boards’ characteristics. The findings show that there is a strong positive association between board size and performance, encouraging the companies to have a large board size to improve corporate financial performance. Complementary to this study, Wang et al. (2013) also examined the influence of board structure on firms’ performance. The size of the board was used as one of the proxies for human capital in order to determine which types of companies should have a larger board size and which ones should have smaller boards with the intuit of enhancing companies’ performance. Results showed the size of the board only has impact on complicated firms (firms with large size, high diversification and high leverage), since performance levels decrease with board size for simple firms, but increase with board size for complicated ones. Sheikh et al. (2013) conclude that the size of board of directors relates positively to return on assets, earnings per share (EPS) and market-to-book ratio, although boards’ effectiveness being sensitive to different economic periods. The authors defend that a board with high levels of links to external environment improves a firm’s access to various resources in more advantageous conditions, which positively affects firm’s performance.
Other researches present different results. When studying the influence of board structure on firms’ financial performance in the pharmaceutical industry of Bangladesh, Nath et al. (2015) found there is a significant negative relation between board size and firms’ financial performance, including return on assets. Other than the board size, there was no significant relationship between the remaining independent variables and firms’ results. The study defends that smaller but representative board sizes are more efficient to enhance companies’ performance. Mashayekhi and Bazaz (2008) investigated the relation between corporate governance and firm performance for companies listed in the
14 Tehran Stock Exchange for the years 2005-2006. Their regression results also show that board size is negatively associated with firm performance (ROE, ROA and EPS), indicating that larger board size generally reflects weaker control and supporting that smaller boards are likely to be more efficient in monitoring management. On Lopes and Martins (2015) investigation of the impact of IC to performance, the authors did not find a statistically significance of board of directors’ characteristics, including size, in the model. This reflects an absence of interaction between this human capital proxy and turnover.
Edvinsson and Malone (1997:12) state that ‘the core of knowledge-economy is huge investment flows into human capital as well as information technology’. In a broader research, Guo et al. (2012) assessed the influence of IC on the performance of 279 biotech firms listed in the US market from 1994 to 2005, discussing the relationship between intellectual human capital, technology innovation and financial performance. Research and development (R&D) expenditures and patents were considered as part of technology innovation, whereas stock return, ROA and ROE were used as financial performance indicators. The results show that human capital (measured by Chief Executive Officer’s (CEO) or Vice President’s compensation and their academic background) and R&D expenses significantly offset the current earnings in financial reports, decreasing performance in terms of cash flow and return on assets. Nonetheless, results show that R&D expenses and human capital increase future stock returns, enhancing performance in the long term.
Li and Wang (2014) examined the effect of R&D expenses, sales training and employee benefits on Hong Kong’s listed Information Technology companies’ return on assets. The authors defend that return on assets is the most suitable indicator to measure performance, since it correlates overtime with return on equity and return on investment, with the advantage of being the most stable throughout the years. The results showed that only R&D expenditure and sales training have a positive relation with return on assets, with employee expenses not being correlated with performance.
As research and development may be the most direct indicator to a company’s innovation (Omil et al., 2011; Li and Wang, 2014), R&D activities are becoming increasingly important in sustaining firms' competitive advantage. Recent studies have been focusing on this assertion. In this regard, Ruiqi et al. (2017) examine the relationship between R&D expenditures and future performance in Chinese companies
15 listed on the Main Board of Shanghai and Shenzhen stock exchanges. The multiple regression models’ results show that R&D expenditures are positively related to firms' future performance measured by Future Operating Performance indicator. The authors stress that R&D expenditures are essential to improve firms’ performance through reduction of production costs and creation of new products, which constitutes a competitive advantage in a fierce market. This study also concludes on a positive influence of state ownership on the relationship between R&D investments and future performance, defending that a connection with the government helps improving the efficiency of R&D resources.
Lome et al. (2016) analyzed 247 Norwegian manufacturers in order to evaluate the effect of a high R&D intensity on performance during a financial crisis. Using binary logistic regression, the authors found a very significant connection between R&D intensity and subsequent growth rates through the late 2000s financial crisis. These results introduce the importance of R&D activities during a financial crisis, defending that managers should consider it before cutting R&D spending, as it has a long-term effect and may constitute an important competitive advantage when the economy starts to recover. The literature defends that it takes time for a firm’s R&D investment to translate on a firm’s financial outcome (Li and Wang, 2014). This study also addresses that question, revealing a period of two years since the investment in R&D and the subsequent improved results on revenue. Thus, Lome et al. (2016) consolidate the importance of R&D investments for a company on the long-term, underlining the idea that R&D intensity acts as a form of insurance against future crises, proving that companies that highly invest in R&D activities perform significantly better than the ones that do not, even during recession periods. This conclusion is consistent with Shakina and Molodchik (2014) and Nadeem et al. (2016) previous inferences that intangibles are especially important during market instability since they provide most of a company’s competitive advantage in the knowledge economy.
Gleason and Klock (2006) investigated whether R&D capital and advertising capital were able to explain the variation of market value (represented by Tobin’s Q ratio) for U.S.’ chemical companies. The authors found that these measures of intangible capital, especially R&D, have an important and statistically significant role in firm valuation for this industry, particularly in firms established in the market for a longer period of time. Alongside this review, several researches commonly analyze
16 R&D in simultaneous with advertising expenses. Furthermore, previous studies reflect the importance of R&D efforts being aligned with advertising in order to achieve a higher level of performance.
In fact, Sridhar et al. (2014) found that for publicly listed U.S. high technology manufacturing firms, R&D spending and advertising spending have a positive and significant impact on firm value when interrelated. A different study conducted by Mizik and Jacobson (2003) found that value creation through R&D alone does not enhance firm value and that it is necessary to have value appropriation through advertising in order to achieve sustained competitive advantages. They argue that value creation influences the potential magnitude of the advantage, while value appropriation influences the amount of the advantage the firm is able to capture and the persistence of that advantage in time. The first is driven by innovative activities that rely on the firm’s technology capabilities, which are linked to R&D expenditures. On the other hand, value appropriation is associated with a firm’s ability to differentiate its offering through advertising. The authors used stock return as a measure of long-term financial performance, influenced by the variation in accounting business performance (through return on assets). Empirically, they found that the stock market reacts favorably when a firm increases its emphasis on value appropriation, even in the high-technology markets, where innovation and R&D are essential to companies’ success. These results show that, although R&D can create value through innovation, its effects are only maximized when the firm uses advertising to appropriate part of the value it has created. A research carried out by Hanssens and Joshi (2010) reinforces the importance of advertising, providing conceptual and empirical evidence of a positive relationship between advertising expenditures and the market value of firms. The authors defend that advertising has, simultaneously, a direct and indirect impact on firm value, which contributes to market capitalization. The direct impact arises from the constitution of the brand. By allowing the company to create its brand image, advertising helps guarantee firm’s reputation (Tanfous, 2013). Brand awareness proved to be crucial for investors, as they tend to favor well-known and powerful brand names, which causes long-term effects on firm value. The indirect impact of advertising is due to the consequent increase in the level of sales and profits, which will ultimately be reflected in the company’s turnover.
A recent study conducted by Acar and Temiz (2017) focused on the association between banks’ advertising expenses and the accounting measures of income and
17 profitability of the Turkish banking sector. This study was the first to investigate the long-term effect of advertising on financial performance of banking sector by using Koyck’s distributed lag model. The results show a positive effect of advertising on interest income, total operating income and return on assets. The authors not only confirmed the contribution of advertising to financial performance, as found a positive effect of advertising that extends over time. These results suggest that advertising expenses hold future economic benefits and, therefore, the authors argue they should be capitalized and then amortized rather than being recognized as a cost when it occurs. Another study that establishes advertising as an increasingly important investment for the firm is the one carried out by Assaf et al. (2015). This research analyzed 65 Croatian and Slovenian hotels for a six-year period (2007 to 2012) in order to determine the impact of advertising spending on firm performance for the hotel industry. This investigation was conducted using the Bayesian stochastic frontier approach to measure sales performance. This method is widely used in marketing literature as it compares a company’s sales performance against its optimal performance while considering competition, which results in a dynamic structure on the sale performance metric. Posteriorly, the effects of advertising were tested and resulted in a positive impact on hotel sales performance. Moreover, results suggest this impact is stronger for large hotels, which explains why advertising is sometimes less effective for some companies. Authors defend that large companies have a lower cost of advertising per customer and are able to reach a larger number of potential clients with the same advertising expenditure, which does not happen for smaller businesses. This paper reinforces the assumption that increased advertising spending enhances performance, hence should be considered as a significant investment for the firm.
Although the contribution of R&D and advertising is mostly supported in the literature, a few studies dismiss their importance to performance. One of these studies was conducted by Heiens et al. (2007) who investigated the contribution of intangible assets and expenditures to shareholder value for 1657 traded manufacturing firms for a six-year period. Defending that the traditional financial measures of performance, such as ROA and ROE, are inadequate in strategically planning decisions, the researchers used market-adjusted holding period returns as the measure of corporate shareholder value. The empirical tests suggest the intangible assets other than goodwill strongly and positively affect the values of this indicator, whereas investments in advertising do not
18 have a significant contribution to the generated long-term financial returns to investors. Additionally, goodwill and R&D expenditures presented a negative impact on this measure of performance. In fact, the more goodwill firms accumulate, the worst impact it has on holding period returns. This may be due to investors not considering the excess of the amount paid to acquire the assets adequate, or the assets not translating the benefits the firms were expecting. In regards to R&D, Heiens et al. (2007) defend that these results may be explained by the uncertainty of the future benefits of R&D or by the way markets tend to view the excess spending on intangibles negatively due to the risk involved. Nonetheless, the authors argue that, even though advertising and R&D expenditures negatively affect performance and therefore do not constitute a competitive advantage for the firm, their importance to competitiveness in an industry is undeniable.
A study lead by Tanfous (2013) on 252 non-financial French companies listed on Paris Stock Exchange aimed to demonstrate the aggregated effect of intangibles on value creation and examine whether the sector of the company is associated with intangible activities. The research confirmed the previous assumptions that R&D expenditures and advertising expenses contribute favorably to the value creation of companies when considered aggregately, as well as the participation and training of employees. Even so, the results vary from one sector to another and demonstrate that the technological sector has a lower investment on intangibles than the industrial and service sectors, although displaying the highest values in advertising expenses and motivation of personnel. This low investment diminishes the intangibles’ influence on value creation and this study alerts for the possibility of a different impact of intellectual capital among industries, with special focus on the technological one.
In this scope, for a sample of 562 companies listed on Frankfurt Stock Exchange and London Stock Exchange, Tudor et al. (2014) found there is a positive and steady relationship between intangible assets and various performance indicators (ROA, ROCE and GPM). This relationship seems to suffer structural differences and scale effects when considering distinct sectors or the two markets as a whole. One possible explanation for this fact regards the uncertainty of the sector in question. It can be argued that in sectors in which intangible assets such as patents, software, trademarks, brands, in-progress R&D, among others, have an important weight in the total value of intangible assets, there is a higher degree of uncertainty and a bigger vulnerability to
19 market conditions. In comparison, sectors in which intangible assets are protected by formal mechanisms (such as customer contracts, licensing and franchising agreements) tend to suffer less from the market’s fluctuations.
In their empirical review of the major topics concerning intangible assets, Sharma and Dharni (2016) validate the previous statement regarding the effect of intangible assets on firm performance across sectors. In their research, the authors observed differences in the contribution of intangibles depending on the sector they are inserted, which they believe may be due to the difference in appropriability of intangibles. This appropriability ‘may differ on account of the protection regimes available across sectors, nature of intangibles and the tendency of firm to leverage intangibles for business efficiency’ (Sharma and Dharni, 2016: 63). A significant relation between intangible assets and organizational performance was found in the biotechnology, pharmaceuticals and IT industries, which have one important thing in common: all are largely R&D and knowledge intensive firms. This conclusion is congruent with a previous deduction of Shakina and Molodchik (2014), stating that an intensive development strategy, which happens when a company decides to conduct its own research and development projects rather than buying new technologies, is positively correlated with value creation. Consistently, the firms from the food and agricultural sectors were found to have a negative relation with financial performance (Sharma and Dharni, 2016).
The current research regards a sample of the major technological companies in the world, with the respective ranking being based on a composite score from equally-weighted measures of revenue, profits, assets and market value (Forbes, 2017). Thus, one can deduct that these companies are high-profitable firms. In this scope, based on the resource-based theory of the firm, Omil et al. (2011) showed that high profitability firms (HPF) are strongly focused on their management of intangibles regarding relational factors, innovation activities, and employee productivity. This research suggests that in comparison with non-high profitability companies, HPF’s management of intangibles is reflected on their business performance (measured by return on assets). Among structural factors, innovation activities represent a crucial factor for a company to become high profitable. The study also suggests that ‘companies that invest time and resources in developing their business relationships will be able to obtain better business performance rates than others’.
20 Amadieu and Viviani (2010) offer an explanation for the variation of the impact of intangibles on performance among industries. They state that the nature of the intangible resources that create competitive advantages is different from one sector to another. Hence, the efficacy of the mechanisms that ensure the appropriation of the value generated by intangible assets is also different among industries.
A different factor that is worth analyzing regards the region where a company is located. Diversity has not always been observed in regards to the relation between intangible assets and performance of the firm across different countries. Nevertheless, Sharma and Dharni’s (2016) review verified that the majority of studies conducted in the USA, UK, and France establish a negative relationship between the intangible assets and performance of the firm. The authors found no relationship for Israel and Taiwan, while developing countries have shown a positive association with performance, which they justify by arguing that ‘firms from developing countries are still having a window of opportunity, while this window may be closing in case of developed nations’ (Sharma and Dharni, 2016: 63). Other research found no relation between performance and region (Lopes et al., 2016) and, in an investigation on whether the IC value was perceived differently across nations, Inkinen et al. (2017) proved the similarity of IC elements across the examined countries, establishing that firms are starting to uniform IC management and, therefore, verify less variation at this level.
This paper will additionally assess the effect of aggregation of intangibles on performance, in light of previous studies carried out by Tanfous (2013) and Lopes and Ferraz (2016). In order to comprehend whether the combination of intangibles has a different impact on performance, these authors conducted researches contemplating two regression models, in which one was represented by the aggregation of intangibles and the other one by their disaggregation, considering intangibles separately according to their typology (goodwill, software, etc.). Their conclusions are similar. Having regressed the theoretical models, a positive and significant correlation between intangible assets and performance indicators was found, considering the first model. Conversely, the analysis of the disaggregated effects showed the independent variables did not have a significant impact on performance. These results reflect that the integration of different intangible assets leads to more value creation than the individual contribution of each one of them (Tanfous, 2013) and that when intangibles of
21 intellectual capital are aggregated, their ‘synergetic effects increase the performance and profitability of businesses’ (Lopes and Ferraz, 2016: 411). Nonetheless, for the technology companies, Tanfous (2013) found that the contribution of the different variables has better and more significant results when the variables are considered individually than when aggregated, suggesting the disaggregated effect may be more relevant for this sector.
A less recent, although very relevant study conducted by Chen et al. (2005) allowed for interesting conclusions on this topic by exploring the relation between the value creation efficiency and firms’ market valuation and financial performance. This study regarding the Taiwanese listed companies used VAIC as the efficiency measure of capital employed and intellectual capital, in order to examine IC’s relationship with value creation (using firms’ market-to-book value ratios). Two regression models were established concerning (a) the selected aggregated measure of intellectual capital, VAIC, and (b) VAIC’s major three components, each representing elements of IC, such as human capital and structural capital, as well as capital efficiency. The authors were able to conclude that firms’ intellectual capital has a positive impact on market value and posteriorly examined whether IC is associated with firms’ financial performance. Thus, they performed the same models using ROE, ROA, growth in net sales (GR), and net value added per employee (EP) as dependent variables. In a third model, the authors included R&D and advertising expenditures to capture additional IC. Chen et al. (2005) verified that VAIC is significantly positive in the financial performance models, suggesting that firms with greater IC perform better in terms of profitability and revenue growth. However, the authors also observed that the explanatory capacity of the disaggregated model was substantially greater than the one in the first model. This means that the three components of IC separately are better than the aggregated measure VAIC in explaining firm value. The authors justify this difference affirming the investors may attribute distinct value to the different components of IC. This assertion was recently assessed by Hussinki et al. (2017), who argue that the configuration of IC substantially impacts the subsequent financial performance of the firm. Indeed, their results show that firms which specialize in some aspects of IC tend to achieve higher levels of performance. Moreover, the model containing R&D and advertising expenses reflected an even higher explanatory power than the previous models, with R&D expenses being strongly significant to the increase of performance, while advertising shows a negative impact. Nonetheless, these results underline the importance of
22 intellectual capital in enhancing firm profitability and revenue growth and highlight the disaggregated effects of intellectual capital in an investor’s perspective.
23 4 Methodology
4.1 Objectives
The general purpose of this study is to identify the impact of intangibles on the performance of the main technological companies in the world, in order to conclude on the contribution of intellectual capital to performance. The specific objectives consist of (i) investigating the effect of intangibles disclosed in companies’ financial position on performance; (ii) examining the effects of disaggregation of intangibles on performance and (iii) evaluating on what extent the characteristics of the board of directors as a representation of human capital contribute to obtain future economic benefits. Furthermore, it will be possible to determine whether the distribution of the intellectual capital drivers does depend on the region.
4.2 Investigation paradigm
The study conducted follows a positivist research approach, which comprehends the existence of an autonomous reality that is separated from the investigator and is independent from the researcher’s perspective or belief. This methodology permits to validate the knowledge through empirical confirmation by formulating the investigation hypotheses and analyzing the obtained results in order to verify or dismiss the theory. Positivism is commonly associated with a quantitative nature, relying on statistical and mathematical techniques to obtain objective results.
This investigation paradigm is related to the positive theory of accounting which aims to predict the reaction of managers towards new accounting standards and to comprehend the reasons that justify their decisions (Scott, 2012).
4.3 Data
The sample was selected considering Forbes’ ranking ‘World’s 25 Biggest Tech Companies in 2016’. The financial information used for the research was collected from companies’ annual financial statements − specifically from their annual reports, corporate governance reports and proxy statements − which are publicly available on their websites. Those financial statements were obtained for the fiscal years ending in 2014, 2015, 2016 and 2017, with the exception of the enterprise EMC, which was purchased by Dell Technologies in 2016, thus does not present annual reports for 2016 and 2017. The information regarding EMC corresponds to its annual statements from 2012 to 2015.
24 The 25 companies included in the sample are exclusively from the technological sector and the study resulted in 97 observations considering the four years in question. It was not possible to access the financial information of two companies in 2014, and one company had not released its financial statements for 2017 at the moment of this research.
Of the 25 companies analyzed, 14 have their headquarters located in North America, 3 in Europe and 8 in Asia. The data was collected in U.S. dollars for all the companies. The ones that had their financial information presented in other currency had it converted at the exchange rate mentioned in the reports. For the companies that did not mention the exchange rate to U.S. dollars, the one utilized for the conversion corresponds to the rate in place at each company’s final fiscal day (commonly, December 31st), through the Oanda currency converter website.
The analysis was conducted using the IBM SPSS (Statistical Package for Social Sciences) Statistics program, version 23.
4.4 Variables
The information concerning the characteristics of the companies studied, which were used as independent, dependent and control variables, were directly obtained from companies’ annual statements or calculated from the information collected. Thus, having into consideration the literature review conducted, two dependent variables, ten independent variables and two control variables were selected and are summarized in the table that follows. The time effect was also considered in the models.
25 Table 1 – Variables’ description and framework.
Variable typology Variable Description
Dependent TUR
ROA
Logarithm of organization’s turnover Ratio of net income to total assets
Independent IA
GW
Logarithm of total intangible assets recognized in non-current assets
Logarithm of goodwill recognized in non-current assets LP Logarithm of licenses and patents recognized in
non-current assets
BTRAD Logarithm of brands, trade names and trademarks recognized in non-current assets
SRD ADV BDSIZE BDAC EMP REG
Logarithm of software and research and development expenses
Logarithm of advertising expenses Size of the board of directors
Logarithm of board of directors’ annual compensation Total number of organization’s employees
Region of the organization’s headquarters
Control LEV
SIZE
Ratio of total book debts to total assets Logarithm of total assets
Notes: TUR = Turnover; ROA = Return on Assets; IA = Intangible assets; GW = Goodwill; LP = Licenses and Patents; BTRAD = Brands, trade names and trademarks; SRD = Software and R&D expenses; ADV = Advertising expenses; BD = Board of directors; BDAC= Board of directors’ annual compensation; EMP = Employees; LEV = Leverage; REG = Region.
To measure the companies’ performance, the main dependent variable selected was turnover. According to IAS 38, intangible resources must be capitalized if they are controlled by the owner, if they are identifiable, and if future returns are expected to flow to the entity. Otherwise, their expenditure must be recognized as an expense when it is incurred. Thus, it is expected that the accounting treatment of intangible expenditures affects the companies’ future returns and, consequently, the performance indicators. Turnover is the indicator which is expected to be the most susceptible to significant effects of intangibles, as this measure directly represents the economic benefits obtained by a company. Another important key performance indicator commonly used to express economic returns is return on assets. This measure of