HAMMER IMPACT TEST APPLIED FOR FOULING DETECTION IN
PIPELINES
Jaidilson J´
o da Silva
∗Antonio Marcus Nogueira Lima
∗Franz Helmut Neff
∗Jos´
e S´
ergio da Rocha Neto
∗∗Universidade Federal de Campina Grande
Departamento de Engenharia El´etrica
Av. Aprigio Veloso 882 - CEP 58429-900, Campina Grande, Para´ıba, Brazil
RESUMO
Teste de Impacto do Martelo aplicado na Detec-¸
c˜ao de Incrusta¸c˜ao em Tubula¸c˜oes
A detec¸c˜ao da incrusta¸c˜ao em sistemas de dutos ´e um problema persistente e requer uma demanda pertinente para as ind´ustrias qu´ımicas, petrol´ıferas, aliment´ıcias e farmacˆeuticas. A incrusta¸c˜ao ´e um processo de deposi-¸c˜ao de materiais s´olidos dissolvidos orgˆanicos e outros materiais pesados nos fluidos transportados ou em sus-pens˜ao sobre as superf´ıcies das paredes internas em sis-temas de transporte de fluidos. Este trabalho apresenta resultados da pesquisa de excita¸c˜ao do teste do martelo para an´alise de vibra¸c˜oes utilizando testes n˜ao-invasivos para detec¸c˜ao de incrusta¸c˜ao em tubula¸c˜oes. Dados da vibra¸c˜ao foram analizados na presen¸ca de uma camada de incrusta¸c˜ao no interior dos tubos usando um acele-rometro e um microfone para detec¸c˜ao. Com a an´ a-lise dos resultados obtidos ´e poss´ıvel detectar o processo de incrusta¸c˜ao, nas tubula¸c˜oes monitoradas, com e sem condi¸c˜oes de carga, utilizando um microfone e um ace-lerˆometro como sensores.
PALAVRAS-CHAVE: An´alise de vibra¸c˜oes, Teste do
im-pacto do martelo e Detec¸c˜ao da incrusta¸c˜ao.
Artigo submetido em 10/03/2011 (Id.: 01295) Revisado em 06/07/2011, 09/08/2011, 29/09/2011
Aceito sob recomenda¸c˜ao do Editor Associado Prof. Carlos Roberto Minussi
ABSTRACT
The fouling detection in duct systems is a persistent problem and remains a relevant demand for the chem-ical, oil, food and pharmaceutical industries. The foul-ing is a deposition process of heavy organic and other dissolved solid materials in the transported fluids or sus-pensions onto inner wall surfaces in fluid transport sys-tems. This work presents research results of hammer test for vibration analysis using non-invasive tests to fouling detection in pipelines. Data were taken from the vibration in presence of an inner pipe fouling layer us-ing an accelerometer and a microphone for detection. With the analysis of the obtained results is possible to detect the fouling process, in the monitored pipelines, with and without load conditions, using a microphone and an accelerometer as sensors.
KEYWORDS: Vibrations analysis, Hammer impact test
and Fouling detection.
1
INTRODUCTION
technical difficulties which may appear in these pro-cesses (Rose, 1995), (Branco et al., 2001) and (Cam et al., 2002). Fouling in ducts causes several severe problems such as: the reduction of the internal diam-eter of the pipeline; the required increase of the ap-plied pressure to maintain through-put can cause crack formation and possibly catastrophic breakup, the asso-ciated increase of the energy consumption also comes along with higher operation and maintenance costs (Mansoori, 1997) and (Escobeto et al., 1997).
Large industrial crude oil refining/processing plants are designed as complex tubing structures, with up to sev-eral kilometers of interconnected tubes. It therefore is quite difficult and work intensive to quickly and safely identify, exactly localize, clean or replace critical tube sections, to avoid or reduce plant shut down times (Mansoori, 2001).
Several methods have been proposed for fouling de-tection, based on mass flow reduction, electric resis-tance sensors and ultrasonic techniques (Krisher, 2003), (Panchal, 1997), (Hay and Rose, 2002), (Gatts et al., 2004), (Barshinger and Rose, 2002) and (Lohr and Rose, 2002). Tests with hammer impact have been used before in numerous engineering areas to analyze fre-quency response functions (FRF), due to convenience and simplicity of the experiments, as well as the valid-ity of the analysis procedures (Castelline et al., 2004), (Roy and Ganesan, 1995), (Nahvi and Jabbari, 2005), (Shen and Pierre, 1994), (Carino, 2001) and (Silva et al., 2010a).
In (Silva et al., 2009a) are presented initial results with the hammer impact test, just using a microphone for acoustic analysis of the signals, for fouling detection. In (Silva et al., 2009b) are presented the result analysis of different layers of fouling, inside the tube, using acoustic and vibrations analysis for tests without load conditions, in other words, without liquid inside the tubes. In (Silva et al., 2010b) are presented results of tests with vibration analysis for fouling detection, emphasizing the use of finite elements and verification of the results for tests without load conditions.
In this work, we presented the results of the acoustic analysis, using a microphone as sensor, and vibration analysis using an accelerometer as sensor. These tests are performed under load conditions, in other words, with liquid inside the tubes, emphasizing the differences in the tests. Also, were performed the tests in a real pipe, used in the petroleum transport, for fouling detec-tion with acoustic and vibradetec-tion analysis.
2
PROPOSED METHOD
The physical principle is simple: when the tube is me-chanically excited by hammer impact, a relatively local-ized area of the tube section begins to vibrate at acoustic frequencies for a certain period of time at one or more resonance frequencies. The vibration propagates as a very fast acoustic wave within the duct wall, and as a surface wave. The latter couples to the environmental air and is detected by a closely mounted microphone and accelerometer. Due to internal damping, the ham-mer excited vibration attenuates rapidly. The temporal development and decay of the free vibration depends on the physical characteristics of the system/pipe ge-ometry, especially of the damping coefficient (Ahn and Jeong, 2005), which is determined by the wall thickness.
During the impact phase, the system is represented as a joining between the hammer and the structure. At the end of the impact, the hammer looses the contact with the structure, which now vibrates freely in agreement with their natural resonance frequencies (Champoux et al., 2003).
Based on ideas presented earlier, the acoustic hammer impact has been evaluated in this work towards sim-plified fouling detection in ducts and pipelines, used for crude oil transport. Here, we analyze variations in vibra-tion amplitude and frequency using accelerometer and microphone output signals in the presence of inner tube fouling layers.
A fouling detector has been exploited, using the hammer test to provoke mechanical vibrations in the pipe section under investigation. An excitation system is used to generate vibrations in the pipe section under test. A detection system for signal conditioning is used to record the vibration parameters. The signals are analyzed in time and frequency domain using an oscilloscope and a spectrum analyzer.
Figure 1: Sketch of the experimental set-up with microphone and accelerometer.
The electromagnetic displacement system is formed by a DC power supply and for a pulse generator, that excites a coil and it activate the hammer, making the hammer to hit the pipe. The hammer excitation signal frequency is controlled for the pulse generator. The sample rate of the data acquisition is 200M Hz and the force impact has a repeatability of 2 Hz, this frequency is used to control the repeatability of the hammer impact onto the tube. The applied force onto surface of the test tube was 0.4 N, as determined by a digital dynamometer, well maintaining the impact load magnitude.
The test tube comprises a wall thickness of 2.5mm, a diameter of 10 cm, a length of 60 cm (l2), made from galvanized iron.
In all tests the same pipes are used. Initially the tests are performed with the microphone and later with the accelerometer to avoid errors. The tests are performed with metal tubes, because the objective is the fouling detection in the petroleum transport.
The variation in temperature influences in the fouling process, but the microphone and accelerometer, which are used as sensors, can still detect the modifications in the acoustic and vibration signals. If the temper-ature decreases, the fouling process increases, because the present substances in the liquid will crystallize in a faster way. If the temperature increases, the foul-ing process decreases, because the thermal agitation of the molecules increases (Escobeto et al., 1997), (Mansoori, 1997), (Mansoori, 2001).
The methodology relies on observing the parameters: amplitude, decay time and frequency, in the monitored signals.
2.1
Tests with the accelerometer
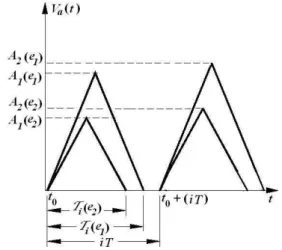
A sketch of the accelerometer output signal is presented in Figure 2, according to (Silva, 2008).
We can define the following expression for the maximum amplitude of the signalVa(t):
Ai=max(Va(t)), i= 1,2, ..., N (1)
where: ei is the fouling thickness (e2 > e1), Va(t) is
the output signal of the detection system using the ac-celerometer and Ai is the maximum amplitude of the
signal Va(t). T is the repetition rate in the tests.
The mean value (A) for the maximum amplitude of the signal Va(t) is:
A(e) = 1 N
N X
i=1
Ai(e) (2)
where: N is the number of tests used in each experiment.
The increase in the fouling thickness (e) provokes a re-duction in the amplitude maximum value in the output signal (Ai).
Figure 2: Representation of the signal in the accelerometer out-put.
2.2
Tests with the microphone in time
do-main
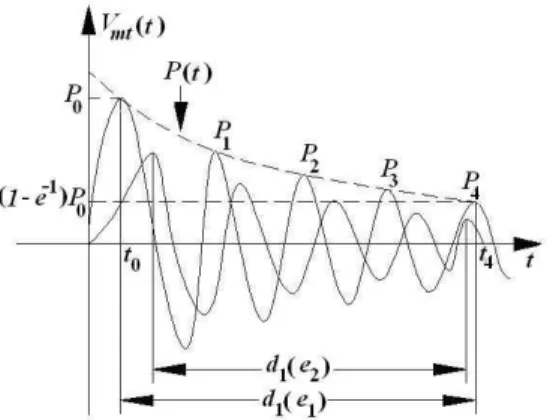
A sketch of the attenuated microphone output signal in the time domain is presented in Figure 3, according to (Silva, 2008).
We can define the following expression for the envelope of the signalVmt(t):
P(t) =P0(1−e−
t
where: ei is the fouling thickness (e2 > e1), Vmt(t) is
the output signal of the detection system using the mi-crophone, in time domain, P(t) is the envelope signal and di is the decay time of the signal Vmt(t), in other
words, the necessary time to reduce the maximum am-plitude (P0) of the signal Vmt(t) for 37% of its value
((1−e−1 )P0).
The mean value (D) for the decay time of the signal Vmt(t) is:
D(e) = 1 N
N X
i=1
di(e) (4)
where: N is the number of tests used in each experiment.
The increase in the fouling thickness (e) provokes a re-duction in the value of the decay time (di) of the signal
Vmt(t).
Figure 3: Representation of the signal in the microphone output, in time domain.
2.3
Tests with the microphone in frequency
domain
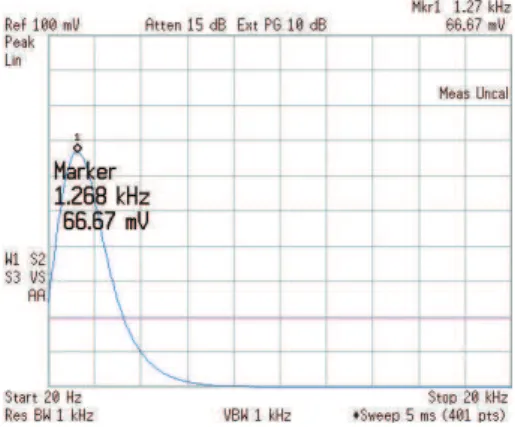
A sketch of the attenuated microphone output signal in the frequency domain is presented in Figure 4, according to (Silva, 2008).
We can define the following expression for the resonance frequency of the signalVmf(f):
fresi =argmax(Vmf(f)), f∈[f0, f1] (5)
where: ei is the fouling thickness (e2 > e1), Vmf(f)
is the output signal of the detection system using the microphone, in frequency domain, andfresi is the
res-onance frequency of the signal Vmf(f), in other words,
the frequency (f) where occur the maximum value (Vi)
of the signalVmf(f).
The mean value (F) for the resonance frequency of the signalVmf(f) is:
F(e) = 1 N
N X
i=1
fresi(e) (6)
where: N is the number of tests used in each experiment.
The increase in the fouling thickness (e) provokes a re-duction in the value of the resonance frequency (fresi)
of the signalVmf(f).
Figure 4: Representation of the signal in the microphone output, in frequency domain.
3
EXPERIMENTAL RESULTS
A calibration step to define the original acoustic tube signature is initially carried out in absence of a fouling layer. The received signal is monitored, and the acoustic features (amplitude, frequency) stored as reference.
The originally present asphaltic fouling layer has been replaced by a paraffin (resin) film with varying thickness up to 10mm, carefully deposited within the test tubes.
3.1
Tests with microphone (pipes without
water)
The obtained signals, in the frequency domain, for the pipes without water are presented in Figures 5, 6 and 7.
Associate signals, in time domain, for the pipes without water are presented in Figures 8, 9 and 10.
Figure 5: Representation of the microphone output signal for the tube without fouling.
Figure 6: Representation of the microphone output signal for the tube with 5mmof fouling.
Figure 7: Representation of the microphone output signal for the tube with 10mmof fouling.
Figure 8: Representation of the microphone output signal, in time domain, for the tube without fouling.
Figure 10: Representation of the microphone output signal, in time domain, for the tube with 10mmof fouling.
The decay time for the tube without fouling is 14 ms, for 5mmof fouling is 10 msand for 10 mm of fouling is 5ms.
Analysing the results, we can observe that the reduction in frequency and decay time, in relation to clean tube, are the indicative of presence and increase of fouling in the monitored pipelines.
The microphone records the acoustic tube signature, due to excitation and propagation of a longitudinal wave, as known from the ringing bell.
3.2
Tests with accelerometer (pipes
with-out water)
The monitored and stored accelerometer output signals, for the pipes without water, are illustrated in the upper traces of Figures 11, 12 and 13 in absence of fouling, for fouling layer thickness of 5mmand for fouling layer thickness of 10mm, respectively.
Figure 11: Accelerometer output signals in absence of fouling.
Figure 12: Accelerometer output signals with 5mmof fouling.
Figure 13: Accelerometer output signals with 10mmof fouling.
With increasing film thickness the signal magnitude are decreasing. Persistent low magnitude ringing, observ-able in all time signals, most likely originates from a resonance in the MEMS accelerometer itself, where its spring type cantilever design supports the oscillating (vi-bration) response characteristic.
We attribute the origin of the signature recorded by the accelerometer to the transversal deformation wave, which propagates along the tube surface, similar to spreading of a surface water wave. This explanation is supported by our simulation, where the hammer impact causes spatially distributed surface deformations.
3.3
Tests with microphone (pipes with
wa-ter)
Figure 14: Representation of the microphone output signal for the tube without fouling (pipe with water).
Figure 15: Representation of the microphone output signal for the tube with 5mmof fouling (pipe with water).
Figures 16 and 17 present the results (pipes with water), in time domain, for the tubes without fouling and with 5mmof fouling.
Figure 16: Representation of the microphone output signal, in time domain, for the tube without fouling (pipe with water).
Figure 17: Representation of the microphone output signal, in time domain, for the tube with 5 mm of fouling (pipe with
water).
The reduction of the resonance frequencies and decay times still allows fouling detection.
3.4
Tests with accelerometer (pipes with
water)
Tests under loading conditions, in presence of water, in the tubes were also carried out with accelerometer. Fig-ures 18 and 19 present the results, for the tubes without fouling and with 5mmof fouling.
Figure 18: Accelerometer output signals in absence of fouling (pipe with water).
Figure 19: Accelerometer output signals with 5mmof fouling
The reduction of the amplitudes still indicates fouling condition.
3.5
Comparisons between the results with
and without load conditions
In Tables 1, 2 and 3 are presented the obtained results in the tests with and without liquid (water) inside the tubes. Tables 1 and 2 present the obtained results with microphone, in frequency domain and time domain, re-spectively. Table 3 presents the obtained results with accelerometer.
Table 1: Obtained results with microphone, in frequency do-main.
Fouling layer Tests with Tests without
water water
0 mm 4.84 kHz 3.97 kHz 5 mm 3.74 kHz 2.62 kHz
Table 2: Obtained results with microphone, in time domain.
Fouling layer Tests with Tests without
water water
0 mm 14.0 ms 9.0 ms
5 mm 10.0 ms 4.0 ms
Table 3: Obtained results with accelerometer.
Fouling layer Tests with Tests without
water water
0 mm 900 mV 170 mV
5 mm 600 mV 100 mV
In load conditions (with water inside the tubes), the mass of the system is increased and the impact of the hammer provokes vibrations with smaller amplitudes and smaller acoustic levels which are detected by the accelerometer and microphone, respectively.
The hammer impact force should be determined accord-ing to the pipe dimension variations and the type of transported liquid, so that the levels of the monitored signals can indicate the fouling layers inside the tubes. Therefore, it is important to determine the pipe signa-ture to perform the tests.
The properties of the transported liquid, as density, in-fluence in the tests, because the force of the impact should be determined to guarantee the measurement of the parameters and their variations with the increase of the fouling.
3.6
Tests with different layer of fouling
In this case, tests were performed using the accelerom-eter and microphone, with signals in frequency domain, because the analysis of the results can be made directly starting from the observed signals.
Figure 20 presents a transverse view of the tube with three layer of fouling (0mm, 5mmand 10mm).
Measurements were performed with distances, between the hammer impact and the accelerometer and micro-phone, of 3 cm along the tube. The obtained results with the accelerometer are presented in Figure 21.
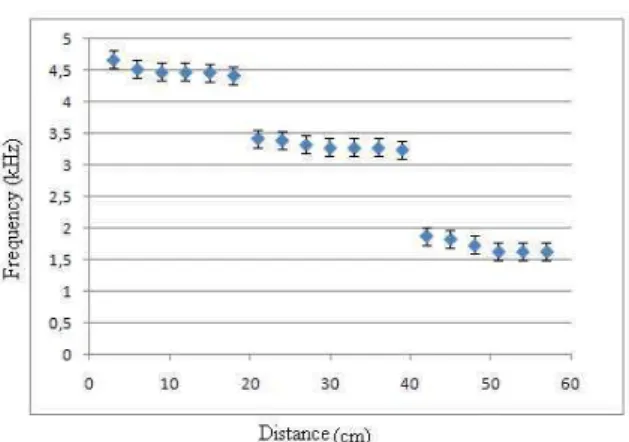
The obtained results with the microphone are presented in Figure 22.
Figure 20: Transverse view of the tube with three layer of fouling with: 0mm, 5mmand 10mmof resin.
Figure 22: Obtained results with the microphone in a tube with multi-layer fouling.
With the increase of the fouling, there is a reduction in the amplitude, in the tests with the accelerometer. It is also observed the different levels of signals along the tube, that make possible to distinguish the layers inside the tube, in other words, clean tube up to 20cm, tube with 5mmof fouling between 20 and 40cmand a layer of 10mm of fouling (resin) between 40 and 60 cm. In this way, it is possible to detected different fouling layers in the same tube.
Accelerometer based autonomous fouling detection sys-tems are relatively easy to design and should be preferably implemented at pre-determined duct sec-tions, which are otherwise difficult to access, or exhibit an increased probability for the appearance of fouling. Changes in the response signal can be monitored au-tomatically and continuously, and alarms provided, as soon as critical thickness levels are reached.
With the increase of the fouling, there is a reduction in the frequency values, in the tests with the microphone. It is also observed the different levels of signals along the tube, that make possible to distinguish the layers inside the tube, in other words, clean tube up to 20cm, tube with 5mmof fouling between 20 and 40cmand a layer of 10mmof fouling (resin) between 40 and 60cm. In this way, it is possible to detected different fouling layers in the same tube.
3.7
Tests with a massive duct section
Supporting experiments have been carried out on a mas-sive duct section, originally mounted in an oil processing plant. Figure 23 presents photography of the experi-mental setup. The tube was made of carbon steel, with length of 2m, wall thickness approx. 1cm, and diame-ter of 22cm.
Figure 23: Photography of the experimental setup with a mas-sive duct section.
The obtained results with microphone, in frequency do-main, for the tubes without fouling and with 5 mm of fouling are presented in Figures 24 and 25.
The obtained results with accelerometer, for the tubes without fouling and with 5mmof fouling are presented in Figures 26 and 27.
We can observe, once more, a reduction in the frequen-cies and amplitudes in the monitored signals due the increasing of fouling layer.
In the test with the massive tube, there is no water inside the tube. The reductions in the values of the observed parameters are due to the larger dimensions of the pipe and the impact of the hammer which is the same used for the tests with the smaller tubes. But, the detection of the fouling in the massive tube is still possible in spite of the reduction in the observed parameters.
Figure 25: Representation of the microphone output signal for the tube with 5mmof fouling (massive duct section).
Figure 26: Accelerometer output signals in absence of fouling (massive duct section).
Figure 27: Accelerometer output signals with 5mmof fouling
(massive duct section).
The amount of fouling can be inferred from the change in frequency/amplitude in an unknown/real tube with fouling, if it is possible to determine the tube signature (tube without fouling). The method also works with joints in pipeline, in this case, once more is necessary to determine the signature in the joints and verify the modifications in the observed signals, as reduction in amplitude and frequency.
4
CONCLUSIONS
In this work, a hammer impact test has been employed for fouling detection via vibration tube signatures. This method relies on vibration amplitude and frequency de-termination using an accelerometer and a microphone.
Variations of amplitude and frequency signatures, re-sulting from the presence of inner tube fouling layers are easily observed. Absolute values of the output sig-nal can be compared and modifications, as reduction, are clear indications for presence of fouling. Thus, the vibration amplitude and frequency reduction provides important information on the amount of tube fouling.
The hammer impact points in each test have been main-tained to assure the same test conditions. The main advantage of the method is the simplicity of the mea-surements and determination of the parameters; a more sophisticated parameter estimation method was not re-quired, once the values have been determined.
Supporting experiments with a massive duct section of a crude oil plant confirm the practical application of the sensing method.
With the developed techniques, we can evaluate differ-ent points of the pipes and iddiffer-entify the places with larger or smaller fouling thickness, by analyzing the modifica-tions in the parameters (amplitude, frequency and decay time) in each test. As result, the costs with maintenance are reduced, and the monitoring processes in the pipe systems are improved.
ACKNOWLEDGMENTS
The authors would like to thanks CNPq and CAPES for financial support in this project.
REFERENCES
Ahn, S. J. and Jeong, W. B. (2005). Improvement of im-pulse response spectrum and its application, Jour-nal of Sound and Vibration.288(5): 1223–1239.
Barshinger, J. and Rose, J. L. (2002). Guided wave ressonance tuning for pipe inspection, Journal of Pressure Vessel Technology124(3): 303–310.
Cam, E., Lei, M., Kocaarslan, I. and Taplamacioglu, C. (2002). Defect detection in a cantilever beam from vibration data,Technical report, Kirikkale Univer-sity, Faculty of Engineering, Department of Elec-trical and Electronics, Kirikkale.
Carino, N. J. (2001). The impact-echo method: An overview, Proceedings of the Structures Congress and Exposition, Washington, USA.
Castelline, P., Revel, G. M. and Scalise, L. (2004). Measurement of vibrational modal parameters us-ing laser pulse excitation techniques,Measurement
35(2): 163–179.
Champoux, Y., Cotoni, V., Paillard, B. and Beslin., O. (2003). Moment excitation of structures using two synchronized impact hammers, Journal of Sound and Vibration263(3): 515–533.
Escobeto, J., Mansoori, G. A., Balderas-Joers, C., Carranza-Becerra, L. J. and Mendes-Garcia, M. A. (1997). Heavy organic deposition during oil pro-duction from a hot deep reservoir: A field expe-rience, Proceedings of the 5th Latin American and Caribbean Petroleum Engineering Conference and Exhibits, Rio de Janeiro, Brazil.
Gatts, C. E. N., Siqueira, M. H. S., da Silva, R. R. and Rebello, J. M. A. (2004). The use of ultrasonic guided waves and wavelets analysis in pipe inspec-tion,Ultrasonics41(10): 785–797.
Hay, T. R. and Rose, J. L. (2002). Fouling detection in the food industry using ultrasonic guided waves,
Journal of Food Control 14(7): 481–488.
Krisher, A. S. (2003). Technical information regarding coupon testing, Technical report, ASK Associates, St. Louis, Missouri.
Lohr, K. R. and Rose, J. L. (2002). Ultrasonic guided wave and acoustic impact methods for pipe foul-ing detection,Journal of food engineering, Elsevier Science56(4): 315–324.
Mansoori, G. A. (1997). Modeling of asphaltene and other heavy organics depositions, Journal of Petroleum Science and Engineering17: 101–111.
Mansoori, G. A. (2001). Deposition and fouling of heavy organic oils and other compounds, 9th Interna-tional Conference on Properties and Phase Equi-libria for Product and Process Design, Okayama, JAPAN.
Nahvi, H. and Jabbari, M. (2005). Crack detection in beams using experimental modal data and finite el-ement model, International Journal of Mechanical Sciences47(10): 1477–1497.
Panchal, C. B. (1997). Fouling mitigation of industrial heat exchange equipment,Technical report, Bengell House, New York.
Rose, J. L. (1995). Recent advances in guided wave nde, Proceedings on IEEE Ultrasonic Symposium
1: 761–770.
Roy, P. K. and Ganesan, N. (1995). Transient response of a cantilever beam subject to on impulse load,
Journal of Sound and Vibration183(5): 873–880.
Shen, M. H. H. and Pierre, C. (1994). Free vibrations of beams with a single-edge crack, Journal of Sound and Vibration170(2): 237–259.
Silva, J. J. (2008). Development of Foulinng Detection Techniques Using Non-invasive Methods, PhD the-sis, (In portuguese), Federal University of Campina Grande, Campina Grande, Brazil.
Silva, J. J., Lima, A. M. N., Neff, F. H. and Neto, J. S. R. (2009a). Non-invasive fast detection of inter-nal fouling layers in tubes and ducts by acoustic vibration analysis, IEEE Transactions on Instru-mentation and Measurement58(1): 108–114.
Silva, J. J., Lima, A. M. N., Neff, F. H. and Neto, J. S. R. (2009b). Vibration analysis based on hammer impact test for multilayer fouling detection, XIX IMEKO World Congress Fundamental and Applied Metrology, OLisbon, Portugal.
Silva, J. J., Lima, A. M. N., Neff, F. H. and Neto, J. S. R. (2010a). Aplica¸c˜ao do teste de impacto do martelo para detec¸c˜ao de incrusta¸c˜ao em tubula¸c˜oes,XVIII Congresso Brasileiro de Autom´atica, Mato Grosso, Brasil.