www.bjorl.org
Brazilian
Journal
of
OTORHINOLARYNGOLOGY
ORIGINAL
ARTICLE
High
levels
of
sound
pressure:
acoustic
reflex
thresholds
and
auditory
complaints
of
workers
with
noise
exposure
夽
,
夽夽
Alexandre
Scalli
Mathias
Duarte
∗,
Ronny
Tah
Yen
Ng,
Guilherme
Machado
de
Carvalho,
Alexandre
Caixeta
Guimarães,
Laiza
Araujo
Mohana
Pinheiro,
Everardo
Andrade
da
Costa,
Reinaldo
Jordão
Gusmão
MedicalSciencesSchool,UniversidadeEstadualdeCampinas(UNICAMP),Campinas,SP,Brazil
Received27January2014;accepted22July2014 Availableonline9June2015
KEYWORDS Noise,occupational; Hearingloss, noise-induced; Reflex,acoustic
Abstract
Introduction:Theclinicalevaluationofsubjectswithoccupationalnoise exposurehasbeen difficultduetothediscrepancy betweenauditorycomplaintsandauditorytestresults.This studyaimedtoevaluatethecontralateralacousticreflexthresholdsofworkersexposedtohigh levelsofnoise,andtocomparetheseresultstothesubjects’auditorycomplaints.
Methods:Thisclinicalretrospectivestudyevaluated364workersbetween1998and2005;their contralateralacousticreflexeswerecomparedtoauditorycomplaints,age,andnoiseexposure timebychi-squared,Fisher’s,andSpearman’stests.
Results:Theworkers’agerangedfrom18to50years(mean=39.6),andnoiseexposuretime fromone to38 years(mean=17.3).We found that15.1% (55)oftheworkershad bilateral hearingloss,38.5%(140) hadbilateraltinnitus,52.8%(192)hadabnormalsensitivitytoloud sounds,and47.2%(172)hadspeechrecognitionimpairment.Thevariableshearingloss,speech recognitionimpairment,tinnitus,agegroup,andnoiseexposuretimedidnotshowrelationship withacousticreflexthresholds;however,allcomplaintsdemonstratedastatisticallysignificant relationshipwithMetzrecruitmentat3000and4000Hzbilaterally.
Conclusion:Therewasnosignificancerelationshipbetweenauditorycomplaintsandacoustic reflexes.
© 2015Associac¸ãoBrasileira de Otorrinolaringologiae CirurgiaCérvico-Facial. Publishedby ElsevierEditoraLtda.Allrightsreserved.
夽
Pleasecitethisarticleas:DuarteASM,NgRTY,deCarvalhoGM,GuimarãesAC,PinheiroLAM,daCostaEA,etal.Highlevelsofsound pressure:acousticreflexthresholdsandauditorycomplaintsofworkerswithnoiseexposure.BrazJOtorhinolaryngol.2015;81:374---83.
夽夽Institution:DepartmentofOtorhinolaryngology,HeadandNeck,MedicalSciencesSchool,UniversidadeEstadualdeCampinas
(FCM-UNICAMP),Campinas,SP,Brazil.
∗Correspondingauthor.
E-mail:[email protected](A.S.M.Duarte).
http://dx.doi.org/10.1016/j.bjorl.2014.07.017
PALAVRAS-CHAVE Perdaauditiva provocadaporruído; Ruídoocupacional; Reflexoacústico
Níveiselevadosdepressãosonora:limiaresdosreflexosestapedianosequeixas auditivasdetrabalhadoresexpostos
Resumo
Introduc¸ão: A avaliac¸ão clínico-ocupacionalde trabalhadoresexpostos aruído é dificultada pela discrepânciaentrequeixasauditivaseresultados dosexamesaudiológicos.Esteestudo pretendeavaliarlimiaresdosreflexosestapedianoscontralateraisemsujeitosexpostosaníveis elevadosdepressãosonora,relacionando-oscomqueixasauditivas.
Método: Estudo clínico retrospectivo que analisou 364 trabalhadores e seus limiares de reflexosestapedianoscontralaterais,relacionado-oscomqueixasauditivas,idadesetempos deexposic¸ãoaoruído.
Resultados: Dostrabalhadoresavaliados,comidadesde18a50anos(média39,6)etempos deexposic¸ãoentreum e38anos(média17,3);15,1% (55)tinhamqueixadeperdaauditiva bilateral,38,5%(140)zumbidosbilaterais,52,8%(192)irritac¸ãoaoouvirsonsintensose47,2% (172)dificuldadesparareconhecerafala.Asvariáveis:perdaauditiva,dificuldadepara recon-hecimentodafala,zumbidos,faixaetáriaetempodeexposic¸ãoaoruídonãoserelacionaram significativamentecomlimiaresdosreflexosestapedianos,mastodasasqueixasapresentaram relac¸ãoestatisticamentesignificantecomorecrutamentodeMetznasfrequênciasde3000e 4000Hz,bilateralmente.
Conclusão:Nãohouverelac¸õessignificativasentrelimiaresdosreflexosestapedianosequeixas auditivas.
©2015Associac¸ãoBrasileiradeOtorrinolaringologiaeCirurgiaCérvico-Facial.Publicado por ElsevierEditoraLtda.Todososdireitosreservados.
Introduction
Noise-induced hearing loss (NIHL) is characterized by a graduallossof hearingacuity,resultingfroma continuous exposuretohighsoundpressurelevels.
TheprincipalcharacteristicofNIHLisanirreversible sen-sorineuralhearinglossthatisusuallybilateral.Initially,the clinicalpictureinvolvesauditorythresholdsofoneormore frequencies between3000and 6000Hz, forminga charac-teristicnotch.Thehighestandlowestfrequenciesmaytake longertobeaffected.Thereisvariabilityinpatternof evolu-tionfortheNIHLduetoindividualsusceptibility,thatismore pronouncedinthefirst10---15yearsofexposure,decreasing andtendingtostabilizethereafter.1
Histologicalstudiesinhumanshaveshownthatthemore damagedcochlearsensorycellsinpatientswithNIHL corre-spondtothefrequencyrangeof3000---6000Hzinthebasal turnofthecochlea,about8---14mmfromtheovalwindow. The changes caused by noise exposure vary, from minor changesinhaircellstothecompleteabsenceofthespiral organ.1,2
Because this is a predominantly cochlear disorder, the individual affected by NIHL may exhibit reduced hear-ing, oversensitivity to loud sounds and tinnitus, as well asimpairmentofspeechintelligibility,especiallyin situa-tions with competing noise. It is important to remember that retrocochleardiseases most commonly affect speech intelligibility.3
However,exposuretonoisealsocancauseimportant psy-chosocialchangesinworkers,affectingtheirqualityoflife, suchasstress,anxiety,andimpairmentinsocialrelations, aswellasactivitiesofdailyliving.2
ThediagnosisofNIHLcanonlybeestablishedthrougha setofevaluationsthatincludeclinicalhistory,occupational history,physicalexamination,audiological assessmentand supplementarytestswhennecessary.4
The audiological evaluation is conducted primarily throughpuretoneaudiometry,logoaudiometry,and immit-tance testing. The latter is a test of great clinical importance, which quickly and objectively evaluates the eardrum-ossicularsystemandtheacousticreflex.
Immittance testing can evaluate tympanic membrane mobilityandmiddleearconditions,tubalfunction,andthe stapedialreflex.
The stapedial reflex indicates that contraction of the stapediusmuscleoccurred,whenthesystem isstimulated withasuddenandintensesound.Theanalysisofthisreflex candocumentthepresenceofMetzrecruitmentincochlear diseases, and of pathological adaptation in retrocochlear disorders.5,6
Theacousticreflexmeasurementisusuallyperformedat 500,1000,2000,and4000Hz;accordingtoseveralauthors, theintensity necessary totrigger the reflexin individuals withnormalhearingisintherangeof70---100dBSL.7
Inroutineaudiologicaltesting,reflexesat3000Hzarenot usuallyevaluated,althoughthereisnoexplanationforthis omission,giventheimportanceofthisfrequencyinspeech perceptionandinaudiometrictestsinpatientsexposedto loudnoises.Animportantapplicationofacousticreflex mea-surementisintheevaluationofthecochlearphenomenon ofabnormalgrowthofloudness(recruitment).5---8
recruitmentisconductedbymeasuringthesensitivitylevel (SL);thatis, bycomparingtheleveloftheacousticreflex thresholdand the level of audiometric thresholdat each frequency.5---8
The interpretation of the stapedial reflex is of great importanceinclinicaldiagnosis.However,theliteraturehas notyetestablishedwhatitsvaluesrepresentinrelationto hearingcomplaintssuchashearingloss,oversensitivity to loudsounds,tinnitus,andspeechperceptiondifficulties.
Thisstudyaimedtoassesscontralateralstapedialreflex thresholdsat500,1000,2000,3000,and4000Hzinsubjects exposedtohighsoundpressurelevels,relatingtheseresults withthehearingcomplaintscitedbythesepatients. Com-parisonsweremadewithboththeabsolutevaluesofreflex thresholds and with the occurrence of Metz recruitment, measuredby theirrespectivesensitivitylevels(difference between reflexand audiometric thresholds) for each fre-quency.
Methods
Medical records of workers exposed to high sound pres-sure levels were examined, and their socio-demographic data,hearingcomplaints,andaudiometricandimmittance testswerecollected.Next,therelationshipbetween hear-ing complaints, age, duration of noise exposure, and the resultsofconventionalimmittancetestswereanalyzed.
Sincethedecreaseinhearingthresholdscausedbynoise exposuretendstostabilizeafter15yearsofexposure,we categorizedtheparticipantsintotwogroups:<16yearsof exposuretonoiseand≥16yearsofexposure.1
In the comparative analyses, the stapedial reflex thresholds were categorized into three groups: ≤100dB, 105---120dB,andabsentreflexes.Thedifferencesbetween reflexandpuretonethresholdswerecategorizedintotwo ranges:≤60dB(suggestiveofMetzrecruitment)and>60dB (norecruitment).
A search was alsoperformed onPubMed/MEDLINE and Scopusdatabases, withthe MeSH terms: ‘‘Perda Auditiva ProvocadaporRuído;Ruído Ocupacional;TestesAuditivos; Testes de Impedância Acústica; Detecc¸ão de Recruta-mento Audiológico; Hearing Loss; Noise-Induced; Noise Occupational; Hearing Tests; Acoustic Impedance Tests; RecruitmentDetection,Audiologic’’,inthePortugueseand Englishlanguages,withnotimelimit.
Participants---inclusionandexclusioncriteria
Medicalrecordsof364workersattendedtoatthe Occupa-tionalOtorhinolaryngologyOutpatientClinicofauniversity hospitalbetween 1998 and 2005, withages ranging from 18 to 50 years, of both genders, pertaining to multiple professionalcategoriesandwithdifferenttimesof occupa-tionalnoise exposure, withnormal audiometric exams or withexamssuggestiveofhearinglossinducedbynoise, nor-maltympanograms(typeA),andpresenceofcontralateral stapedialreflexeswereanalyzed.
Medicalrecordsofworkerswithcurrentorprevious occu-pationalexposuretochemicals,withahistoryofmiddleear disorder,withcurrentorprevioususeofototoxicdrugs,with previous acoustic, face, neck, and cervical spine trauma,
and with traumatic brain injury, as well as those with diabetes, high blood pressure,kidney failure,and thyroid disorders,wereexcludedfromthestudy.
Procedures
For this analysis, the following complaints were consid-ered:bilateralhearingloss;speechperceptiondifficultiesin adverselisteningsituations;oversensitivitytoloudsounds, andpresenceofbilateraltinnitus.
The results of contralateral stapedial reflexes with immittancetestingwererelatedtohearingcomplaintsand workers’ age and exposure times, both by their absolute values(hearinglevels)andbythedifferencesbetweentheir thresholdsandpuretoneaudiometricthresholds(sensitivity levels).TheoccurrenceofMetzrecruitmentwasconsidered whenthesensitivitylevelwaslowerthan60dB.5---8
In the comparative analysis, the thresholds of stape-dialreflexes werecategorizedintothreegroups:≤100dB, 105---120dB,andabsentreflexes. Thedifferencesbetween reflexthresholdsandpuretoneaudiometricthresholdswere categorized into two groups: ≤60dB (suggestive of Metz recruitment)and>60dB(norecruitment).
Wechosetodescribethefulltableofanalysesonlyfor situationsinwhichtherewasastatisticallysignificant rela-tionshipintheanalyzeddata.
Statisticalanalysis
Theprofileofthesamplewasdescribedbyfrequencytables for categorical variables (professional category and hear-ingcomplaints) andby descriptivestatisticsof continuous variables (age, noise exposure time, and stapedial reflex thresholds).
Toexaminetherelationship betweencategorical varia-bles, the chi-squared test and Fisher’s exact test were used(forexpectedvalues<5).Toexaminetherelationship betweencontinuousvariables,Spearman’scorrelation coef-ficientwasused.
The significance level for statistical tests was 5% (p<0.05).
Inthe statistical analysis,the SASSystem for Windows 8.02(SASInstituteInc.,1999---2001,Cary,NC,UnitedStates) wasused.
Ethicalaspects
ThisresearchwasapprovedbytheResearchEthics Commit-teeoftheinstitution,underNo.794/2005.
Results
Medicalrecordsof364workersofboth genderswere ana-lyzed.316 belongedtothemetallurgicalcategory (86.8%) andthe remainingparticipants(13.2%)came fromseveral otherprofessionalcategories(food,oilrefinery,electronics, chemistry,laundry,cosmetics,andtelephony).
Table1 Distributionofworkersbyageandlengthof expo-sure(n=364).
Age Frequency Rate
Age <40 163 44.8%
≥40 201 55.2%
Lengthofexposure <16 136 37.4%
≥16 228 62.6%
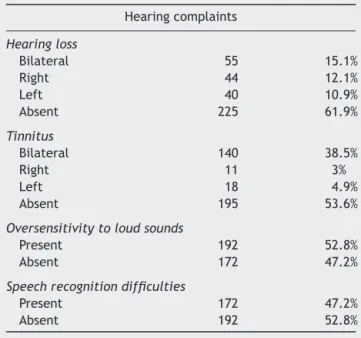
Table 2 Distribution of workers by hearing complaints (n=364).
Hearingcomplaints
Hearingloss
Bilateral 55 15.1%
Right 44 12.1%
Left 40 10.9%
Absent 225 61.9%
Tinnitus
Bilateral 140 38.5%
Right 11 3%
Left 18 4.9%
Absent 195 53.6%
Oversensitivitytoloudsounds
Present 192 52.8%
Absent 172 47.2%
Speechrecognitiondifficulties
Present 172 47.2%
Absent 192 52.8%
theparticipantswerecategorizedintotwogroups:<40years and≥40years(Table1).
All workers wereexposed tooccupational noise during atleastoneyear,uptoamaximumof38years(median18 years,mean17.3±8.1years)(Table1).
We found that only 15.1% of workers (55) had bilat-eralhearing losscomplaints. Forthis analysis,complaints ofunilateral hearinglosswerenotconsidered.Itwasalso found that 38.5% of workers (140) complained of bilat-eraltinnitus.Forthis analysis,unilateral tinnitus wasnot considered.Morethanhalfoftheworkersexperienced over-sensitivitywhenhearingloudsounds(52.8%)andalmosthalf reportedspeechrecognitiondifficultiesinday-to-day situa-tions(47.2%[AG1])(Table2).
Contralateral stapedial reflex thresholds ranged from 75dB to 120dB in the right afferent and from 65dB to 120dB in the leftafferent pathways. The means for con-tralateralstapedialreflexthresholdsrangedfrom91.3dBat 500Hzto97.0dBat4000Hzintherightafferent,andfrom 91.2dBat500Hzto97.5dBat4000Hzintheleftafferent. A tendency of increase in absolute values and variability with an increase of the frequencies’ value wasobserved (Table3).
Thedifferencesbetweenreflexthresholdsandpuretone thresholdsranged from30to120dB onthe rightside and from 30 to 115dB on the left side. The means of differ-encesbetween reflexthresholdsandpure tonethresholds
decreased,from81.2dBat500Hzto69.5dBat4000Hzin therightafferent;andfrom81.4dBat500Hzto67.4dBat 4000Hzintheleftafferent.Atrendofadecreasein differ-encesandofanincrease invariabilitywasobserved,with anincreaseoffrequencyvalue(Table3).
Therewasasignificantrelationshipbetweenhearingloss complaintsand reflexthresholds only for the frequencies of4000Hz in the right earand of 2000Hz in the left ear (Table4).
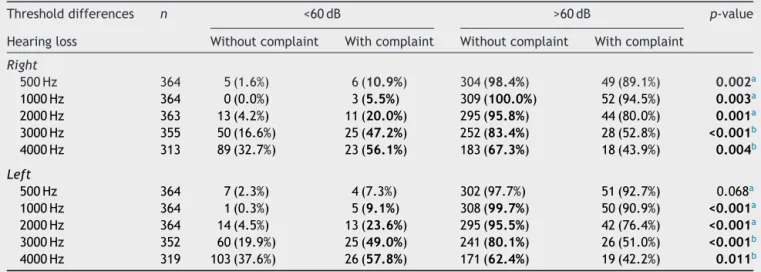
Therelationshipbetweenhearinglosscomplaintsandthe presenceofMetzrecruitmentwassignificantatall frequen-cies,exceptat500Hzintheleftafferent(Table5).
Arelationshipwasnotedbetweenspeechrecognition dif-ficultiesinunfavorablelisteningplacesandthepresenceof Metzrecruitment(Table6).
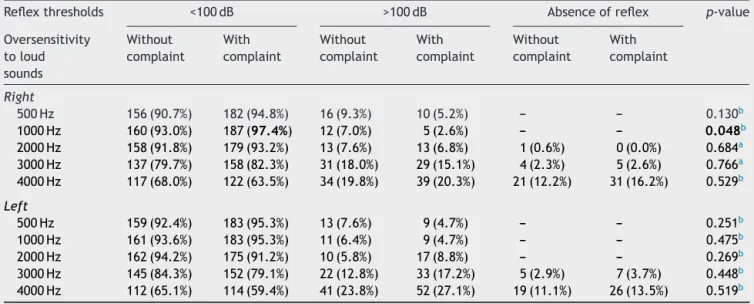
Thecomparisonbetweenirritationwithloudsoundsand theabsolutevaluesofcontralateralstapedialreflex thresh-oldsshowednosignificanceinallpresentations,exceptat 1000Hzintherightafferent(p=0.048)(Table7).
The comparisonbetween oversensitivitytoloudsounds and the occurrence of Metz recruitment showed signif-icance, with reflexes at 3000 and 4000Hz bilaterally (Table8).
The comparison between bilateral tinnitus complaints and the absolute values of contralateral stapedial reflex thresholdsshowednosignificantrelationshipforall frequen-ciesbilaterally.
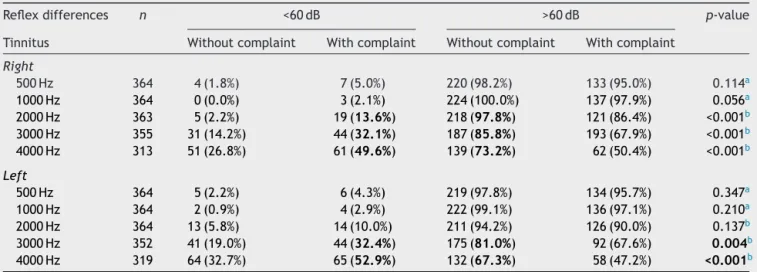
The comparison between tinnitus complaints and the presence of Metz recruitment showed a significant rela-tionshipatthefrequenciesof3000and4000Hzbilaterally (Table9).
Nosignificantrelationshipwasobservedbetweenageand contralateral stapedial reflex thresholds, or between age andabsenceofstapedialreflex.
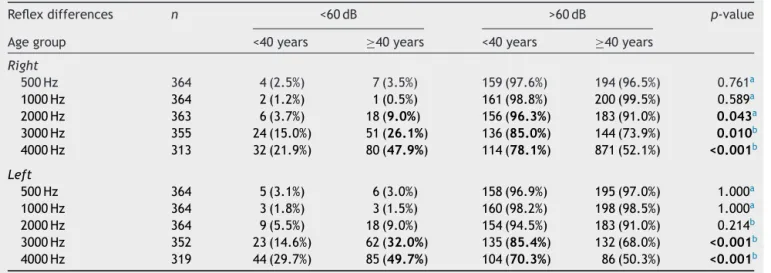
TherelationshipbetweenageandthepresenceofMetz recruitmentshowedsignificancewithreflexes at3000and 4000Hzbilaterally(Table10).
There wasa significant relationship between stapedial reflexesat4000Hzandthedurationofnoiseexposure, bilat-erally(Table11).
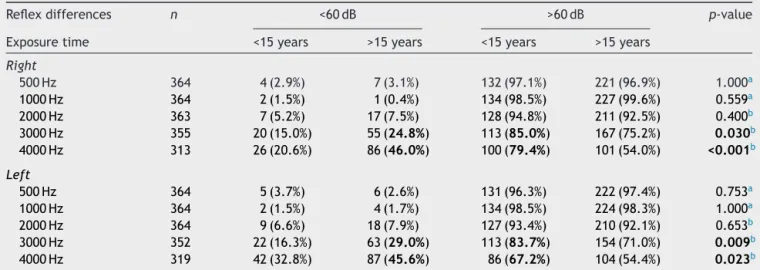
There was a significant relationship between Metz recruitment and over 15 years of exposure, as well as betweenabsenceofrecruitmentand15 orfeweryearsof exposureat3000and4000Hz,bilaterally(Table12).
Ananalysisofcorrelationsbetweenagegroupsand expo-suretimeswasperformed;theresultsweresignificantatall frequenciesandmeans(Spearman’scorrelationcoefficient,
p<0.05;n=188).
Discussion
The WorldHealth Organization (WHO) estimates that 10% oftheworldpopulationisexposedtosoundpressurelevels thatcanpotentially leadtohearinglossinducedbynoise. TheWHOconsidersthissituationasapublichealthproblem, andintheUnitedStates,thereisevidencethatNIHListhe mostprevalentoccupationaldisease.9
Table3 Distributionofmeansofcontralateralstapedialreflexthresholds.
Frequencies Rightafferent Leftafferent
n Means(dB) SD n Means(dB) SD
Reflex thresholds
500 364 91.3 7.6 364 91.2 7.3
1000 364 91.7 6.5 364 91.9 7.0
2000 363 92.0 7.0 364 92.2 7.4
3000 355 94.0 8.9 352 93.9 8.6
4000 312 97.0 9.9 319 97.5 10.1
Reflex differences
500 364 81.2 8.9 364 81.4 9.1
1000 364 82.5 8.9 364 83.0 9.5
2000 363 80.4 11.7 364 80.0 11.3
3000 355 74.5 14.7 352 72.2 14.3
4000 312 69.5 15.9 319 67.4 15.3
Table4 Comparisonbetweenhearinglosscomplaintsandcontralateralstapedialreflexthresholds(n=364).
Reflexthresholds <100dB >100dB Absenceofreflex p-value
Hearingloss Without complaint
With complaint
Without complaint
With complaint
Without complaint
With complaint
Right
500Hz 285(92.2%) 53(96.4%) 24(7.8%) 2(3.6%) --- --- 0.397a
1000Hz 294(95.1%) 53(96.4%) 15(4.9%) 2(3.6%) --- --- 1.000a
2000Hz 286(92.6%) 51(92.7%) 22(7.1%) 4(7.3%) 1(0.3%) --- 1.000a
3000Hz 254(82.2%) 41(74.6%) 48(15.5%) 12(21.8%) 7(2.3%) 2(3.6%) 0.404b
4000Hz 209(67.6%) 30(54.5%) 62(20.1%) 11(20.0%) 38(12.3%) 14(25.5%) 0.032b
Left
500Hz 289(93.5%) 53(96.3%) 20(6.5%) 2(3.7%) --- --- 0.551a
1000Hz 292(94.5%) 52(94.5%) 17(5.5%) 3(5.5%) --- --- 1.000a
2000Hz 290(93.8%) 47(85.4%) 19(6.2%) 8(14.6%) --- --- 0.045a
3000Hz 255(82.5%) 42(76.3%) 46(14.9%) 9(16.4%) 8(2.6%) 4(7.3%) 0.184b 4000Hz 199(64.4%) 27(49.1%) 75(24.3%) 18(32.7%) 35(11.3%) 10(18.2%) 0.089b aFisher’sexacttest.
b Chi-squaredtest.Significantvaluesarehighlightedinbold.
Table5 ComparisonbetweenhearinglosscomplaintsandoccurrenceofMetzrecruitment.
Thresholddifferences n <60dB >60dB p-value
Hearingloss Withoutcomplaint Withcomplaint Withoutcomplaint Withcomplaint
Right
500Hz 364 5(1.6%) 6(10.9%) 304(98.4%) 49(89.1%) 0.002a
1000Hz 364 0(0.0%) 3(5.5%) 309(100.0%) 52(94.5%) 0.003a
2000Hz 363 13(4.2%) 11(20.0%) 295(95.8%) 44(80.0%) 0.001a
3000Hz 355 50(16.6%) 25(47.2%) 252(83.4%) 28(52.8%) <0.001b
4000Hz 313 89(32.7%) 23(56.1%) 183(67.3%) 18(43.9%) 0.004b
Left
500Hz 364 7(2.3%) 4(7.3%) 302(97.7%) 51(92.7%) 0.068a
1000Hz 364 1(0.3%) 5(9.1%) 308(99.7%) 50(90.9%) <0.001a
2000Hz 364 14(4.5%) 13(23.6%) 295(95.5%) 42(76.4%) <0.001a
3000Hz 352 60(19.9%) 25(49.0%) 241(80.1%) 26(51.0%) <0.001b
4000Hz 319 103(37.6%) 26(57.8%) 171(62.4%) 19(42.2%) 0.011b
aFisher’sexacttest.
Table6 ComparisonbetweenspeechrecognitionandoccurrenceofMetzrecruitment.
Reflexdifferences n <60dB >60dB p-value
Speechrecognition Withoutcomplaint Withcomplaint Withoutcomplaint Withcomplaint
Right
500Hz 364 2(1.0%) 9(5.2%) 190(99.0%) 163(94.8%) 0.020b
1000Hz 364 0(0.0%) 3(1.7%) 192(100.0%) 169(98.3%) 0.105a
2000Hz 363 2(1.1%) 22(12.8%) 189(98.9%) 150(87.2%) <0.001b
3000Hz 355 23(12.1%) 52(31.5%) 167(87.9%) 113(68.5%) <0.001b
4000Hz 313 44(25.3%) 68(48.9%) 130(74.7%) 71(51.1%) <0.001b
Left
500Hz 364 4(2.1%) 7(4.1%) 188(97.9%) 165(95.9%) 0.269b
1000Hz 364 1(0.5%) 5(2.9%) 191(99.5%) 167(97.1%) 0.105a
2000Hz 364 4(2.1%) 23(13.4%) 188(97.9%) 149(86.6%) <0.001b
3000Hz 352 25(13.2%) 60(36.8%) 164(86.8%) 103(63.2%) <0.001b
4000Hz 319 60(34.3%) 69(47.9%) 115(65.7%) 75(52.1%) 0.014b
a Fisher’sexacttest.
b Chi-squaredtest.Significantvaluesarehighlightedinbold.
Table7 Comparisonbetweenoversensitivitytoloudsoundsandcontralateralstapedialreflexthresholds(n=364).
Reflexthresholds <100dB >100dB Absenceofreflex p-value
Oversensitivity toloud sounds
Without complaint
With complaint
Without complaint
With complaint
Without complaint
With complaint
Right
500Hz 156(90.7%) 182(94.8%) 16(9.3%) 10(5.2%) --- --- 0.130b
1000Hz 160(93.0%) 187(97.4%) 12(7.0%) 5(2.6%) --- --- 0.048b
2000Hz 158(91.8%) 179(93.2%) 13(7.6%) 13(6.8%) 1(0.6%) 0(0.0%) 0.684a 3000Hz 137(79.7%) 158(82.3%) 31(18.0%) 29(15.1%) 4(2.3%) 5(2.6%) 0.766a 4000Hz 117(68.0%) 122(63.5%) 34(19.8%) 39(20.3%) 21(12.2%) 31(16.2%) 0.529b
Left
500Hz 159(92.4%) 183(95.3%) 13(7.6%) 9(4.7%) --- --- 0.251b
1000Hz 161(93.6%) 183(95.3%) 11(6.4%) 9(4.7%) --- --- 0.475b
2000Hz 162(94.2%) 175(91.2%) 10(5.8%) 17(8.8%) --- --- 0.269b
3000Hz 145(84.3%) 152(79.1%) 22(12.8%) 33(17.2%) 5(2.9%) 7(3.7%) 0.448b 4000Hz 112(65.1%) 114(59.4%) 41(23.8%) 52(27.1%) 19(11.1%) 26(13.5%) 0.519b a Fisher’sexacttest.
b Chi-squaredtest.Significantvaluesarehighlightedinbold.
Althoughtheimportanceofourdatais evident,itis diffi-culttoestablishacomparisonofthisinformationwiththe medicalliterature.
Thecomparativeanalysisbetweencomplaintsofspeech recognitiondifficultiesandthedifferencesbetween stape-dial reflex and audiometric tonal thresholds showed that the presenceof Metzrecruitment (difference<65dB) was significant among the complainants at 2000Hz, 3000Hz, and4000Hzbilaterally,andintherightafferentat500Hz (Table 6). According to Costa et al., speech recognition difficultiesin patientswithnoise-inducedhearing lossare moreconsistent andpronouncedwhenspeechaudiometry formonosyllablewordsistestedwithmaskingby competi-tivespeech.10
The relationship between hearing loss complaints and stapedial reflex thresholds was only significant for the
absenceof complaintsandreflexes≤100dBat 4000Hz on therightsideandat2000Hzontheleftside.
Asignificantrelationshipbetweenabsenceofhearingloss complaintsandreflexthresholds≤100dBonlywasnotedat 4000Hzontherightside(p=0.032)andat2000Hzonthe leftside(p=0.045).
Asignificantrelationshipbetweenthepresenceof hear-inglosscomplaintsand reflexthresholds >100dBonly was observed at 2000Hz on the left side, and between the presenceofcomplaintsandabsenceof stapedialreflexat 4000Hzontherightside(p=0.032).
Table8 ComparisonbetweenirritationwithloudsoundsandoccurrenceofMetzrecruitment.
Reflexdifferences n <60dB >60dB p-value
Oversensitivitytoloudsounds Withoutcomplaint Withcomplaint Withoutcomplaint Withcomplaint
Right
500Hz 364 3(1.7%) 8(4.2%) 169(98.3%) 184(95.8%) 0.178b 1000Hz 364 0(0.0%) 3(1.6%) 172(100.0%) 189(98.4%) 0.250a 2000Hz 363 7(4.1%) 17(8.8%) 164(95.9%) 175(91.2%) 0.068b
3000Hz 355 27(16.1%) 48(25.7%) 141(83.9%) 139(74.3%) 0.027b 4000Hz 313 39(25.8%) 73(45.1%) 112(74.2%) 89(54.9%) <0.001b
Left
500Hz 364 4(2.3%) 7(3.7%) 168(97.7%) 185(96.3%) 0.463b
1000Hz 364 2(1.2%) 4(2.1%) 170(98.8%) 188(97.9%) 0.688a
2000Hz 364 11(6.4%) 16(8.3%) 161(93.6%) 176(91.7%) 0.481b
3000Hz 352 29(17.4%) 56(30.3%) 138(82.6%) 129(69.7%) 0.005b
4000Hz 319 51(33.3%) 78(47.0%) 102(66.7%) 88(53.0%) 0.013b
aFisher’sexacttest.
b Chi-squaredtest.Significantvaluesarehighlightedinbold.
Table9 ComparisonbetweenlateraltinnitusandoccurrenceofMetzrecruitment(n=364).
Reflexdifferences n <60dB >60dB p-value
Tinnitus Withoutcomplaint Withcomplaint Withoutcomplaint Withcomplaint
Right
500Hz 364 4(1.8%) 7(5.0%) 220(98.2%) 133(95.0%) 0.114a
1000Hz 364 0(0.0%) 3(2.1%) 224(100.0%) 137(97.9%) 0.056a
2000Hz 363 5(2.2%) 19(13.6%) 218(97.8%) 121(86.4%) <0.001b 3000Hz 355 31(14.2%) 44(32.1%) 187(85.8%) 193(67.9%) <0.001b 4000Hz 313 51(26.8%) 61(49.6%) 139(73.2%) 62(50.4%) <0.001b
Left
500Hz 364 5(2.2%) 6(4.3%) 219(97.8%) 134(95.7%) 0.347a
1000Hz 364 2(0.9%) 4(2.9%) 222(99.1%) 136(97.1%) 0.210a
2000Hz 364 13(5.8%) 14(10.0%) 211(94.2%) 126(90.0%) 0.137b
3000Hz 352 41(19.0%) 44(32.4%) 175(81.0%) 92(67.6%) 0.004b
4000Hz 319 64(32.7%) 65(52.9%) 132(67.3%) 58(47.2%) <0.001b
aFisher’sexacttest.
b Chi-squaredtest.Significantvaluesarehighlightedinbold.
Therelationshipbetweenhearinglosscomplaintsandthe presenceofMetzrecruitmentwassignificantinall presenta-tions,exceptat500Hzontheleftafferent,yetwithaslight trend(p=0.068) (Table 5). Metz recruitment was related alsowithageover40yearsandwithexposuretimeover16 years.
Examining the results, it can be noted that there was a significant relationship between hearing loss com-plaints, speech recognition difficulties, oversensitivity to loudsounds,tinnitus,agegroup,durationofexposure,and the occurrence of Metz recruitment at 3000 and 4000Hz bilaterally.Despitethe significant relationship,no conclu-sionscanbedrawnregardingtherelationshipofcauseand effectbetweenthesevariables.
The comparisonbetween oversensitivitytoloudsounds andthe absolute valuesfor contralateral stapedial reflex thresholds showed no significance in all presentations, exceptat1000Hzintherightafferent(p=0.048)(Table7).
The comparison between sensitivity to loud sounds and the occurrence of Metz recruitment showed sig-nificance with reflexes at 3000 and 4000Hz bilaterally (Table8).
The comparison between bilateral tinnitus complaints and the absolute values for contralateral stapedial reflex thresholdsshowednosignificantrelationshipatall frequen-cies applied,onboth sides. Also,therewasnosignificant relationship between tinnitus complaints and absence of stapedialreflexes.
The comparisonbetween tinnituscomplaintsand pres-enceofMetzrecruitmentshowedasignificantassociationat frequenciesof3000and4000Hzbilaterally,andat2000Hz intherightafferent(Table9).
Table10 ComparisonbetweenagegroupofworkersandoccurrenceofMetzrecruitment.
Reflexdifferences n <60dB >60dB p-value
Agegroup <40years ≥40years <40years ≥40years
Right
500Hz 364 4(2.5%) 7(3.5%) 159(97.6%) 194(96.5%) 0.761a
1000Hz 364 2(1.2%) 1(0.5%) 161(98.8%) 200(99.5%) 0.589a
2000Hz 363 6(3.7%) 18(9.0%) 156(96.3%) 183(91.0%) 0.043a
3000Hz 355 24(15.0%) 51(26.1%) 136(85.0%) 144(73.9%) 0.010b
4000Hz 313 32(21.9%) 80(47.9%) 114(78.1%) 871(52.1%) <0.001b
Left
500Hz 364 5(3.1%) 6(3.0%) 158(96.9%) 195(97.0%) 1.000a
1000Hz 364 3(1.8%) 3(1.5%) 160(98.2%) 198(98.5%) 1.000a
2000Hz 364 9(5.5%) 18(9.0%) 154(94.5%) 183(91.0%) 0.214b
3000Hz 352 23(14.6%) 62(32.0%) 135(85.4%) 132(68.0%) <0.001b 4000Hz 319 44(29.7%) 85(49.7%) 104(70.3%) 86(50.3%) <0.001b a Fisher’sexacttest.
b Chi-squaredtest.Significantvaluesarehighlightedinbold.
Table11 Comparisonbetweennoiseexposuretimeandcontralateralstapedialreflexthresholds(n=364).
Reflexthresholds <100dB >100dB Absenceofreflex p-value
Exposuretime <15years >15years <15years >15years <15years >15years
Right
500Hz 123(90.4%) 215(94.3%) 13(9.6%) 13(5.7%) --- --- 0.167b
1000Hz 126(92.7%) 221(96.9%) 10(7.3%) 7(3.1%) --- --- 0.061b
2000Hz 127(93.4%) 210(92.1%) 8(5.9%) 18(7.9%) 1(0.7%) 0(0.0%) 0.330a 3000Hz 117(86.0%) 178(78.1%) 16(11.8%) 44(19.3%) 3(2.2%) 6(2.6%) 0.160b 4000Hz 99(72.8%) 140(61.4%) 27(19.9%) 46(20.2%) 10(7.3%) 42(18.4%) 0.011b
Left
500Hz 125(91.9%) 217(95.2%) 11(8.1%) 11(4.8%) --- --- 0.206b
1000Hz 126(92.7%) 218(95.6%) 10(7.3%) 10(4.4%) --- --- 0.230b
2000Hz 129(94.9%) 208(91.2%) 7(5.1%) 20(8.8%) --- --- 0.202b
3000Hz 118(86.8%) 179(78.5%) 17(12.5%) 38(16.7%) 1(0.7%) 11(4.8%) 0.049b
4000Hz 93(68.4%) 133(58.3%) 35(25.7%) 58(25.5%) 8(5.9%) 37(16.2%) 0.013b
a Fisher’sexacttest.
b Chi-squaredtest.Significantvaluesarehighlightedinbold.
relationshipbetweenthesubjects’agegroupandabsence ofstapedialreflex.
TherelationshipbetweenagegroupandpresenceofMetz recruitmentwassignificantwithreflexesat2000,3000,and 4000Hzintherightafferent,andat3000and4000Hzinthe leftafferent(Table10).
There was a significant relationship between reflexes
≤100dB and subjects with 15 or fewer years of expo-sure at 4000Hz bilaterally. Also, there was a significant relationship between the absence of stapedial reflex and over 15 years of exposure at 4000Hz bilaterally (Table11).
There was a significant relationship between Metz recruitment and over 15 years of exposure, as well as betweenabsenceofrecruitment and15or feweryearsof exposureat3000and4000Hzbilaterally(Table12).
Evolutionhasprogrammedhumanstobeawareofsounds as possible sources of danger.13 Noise can be considered
asan undesirable sound that, if at high levels and after prolongedexposure,canleadtoauditoryandnon-auditory healthproblems.
Hearing loss induced by noise continues to be highly prevalentintheworkplace,butthisconditionisincreasingly causedbyexposuretosocialnoisespresentineverydaylife, e.g.,theuseofdigitalsoundplayers.9,14
The exposuretonoise,whetheror notoccupational,is increasingly related to auditory health problems (hearing loss, tinnitus, speechperception difficulties, and hypera-cusis)and non-auditory health problems (irritation, sleep disorders,cardiovasculardisease,andcognitiveimpairment inchildren).15---19
Table12 ComparisonofnoiseexposuretimeofworkersandoccurrenceofMetzrecruitment.
Reflexdifferences n <60dB >60dB p-value
Exposuretime <15years >15years <15years >15years
Right
500Hz 364 4(2.9%) 7(3.1%) 132(97.1%) 221(96.9%) 1.000a
1000Hz 364 2(1.5%) 1(0.4%) 134(98.5%) 227(99.6%) 0.559a
2000Hz 363 7(5.2%) 17(7.5%) 128(94.8%) 211(92.5%) 0.400b
3000Hz 355 20(15.0%) 55(24.8%) 113(85.0%) 167(75.2%) 0.030b
4000Hz 313 26(20.6%) 86(46.0%) 100(79.4%) 101(54.0%) <0.001b
Left
500Hz 364 5(3.7%) 6(2.6%) 131(96.3%) 222(97.4%) 0.753a
1000Hz 364 2(1.5%) 4(1.7%) 134(98.5%) 224(98.3%) 1.000a
2000Hz 364 9(6.6%) 18(7.9%) 127(93.4%) 210(92.1%) 0.653b
3000Hz 352 22(16.3%) 63(29.0%) 113(83.7%) 154(71.0%) 0.009b
4000Hz 319 42(32.8%) 87(45.6%) 86(67.2%) 104(54.4%) 0.023b
aFisher’sexacttest.
b Chi-squaredtest.Significantvaluesarehighlightedinbold.
The understanding of the pathophysiological mecha-nisms involving hair cells and auditory nervedamage has increasedsubstantially,andseveraltherapeutic guidelines haverecently been explored.Oral medicationstoprotect againstnoise-inducedhearinglossareexpectedtobecome availableinthecomingyears.9,22---24
Conclusions
There was no significant relationship between absolute valuesofstapedialreflexthresholdsandhearingloss com-plaints, oversensitivity to loud sounds, tinnitus, and age group.
The significant relationship among hearing loss com-plaints, speech recognition difficulties, oversensitivity to loudsounds,tinnitus,agegroup(over40 years),exposure time(greaterthan 15 years),andtheoccurrence of Metz recruitment at 3000 and 4000Hz bilaterally are notewor-thy.However,acause-and-effectrelationshipamongthese variablescannotbedetermined.
Conflicts
of
interest
Theauthorsdeclarenoconflictsofinterest.
References
1.PerdaAuditivaInduzidaporRuídorelacionadoaoTrabalho.In: Boletimn◦ 1.ComitêNacionaldeRuídoeConservac¸ão
Audi-tiva. 1999. Available from: http://bvsms.saude.gov.br/bvs/ publicacoes/protocoloperdaauditiva.pdf
2.CostaEA,Ibá˜nezRN,NudelmannAA,SeligmanJ.Aperda audi-tivainduzidapeloruído(PAIR)relacionadaaotrabalho.In:Costa SS,CruzOLM,OliveiraJAA,editors.Otorrinolaringologia: princí-pioseprática.2aed.PortoAlegre:Artmed;2006.p.410---2.
3.HongO,KerrMJ,PolingGL,DharS.Understandingand preven-tingnoise-inducedhearingloss.DisMon.2013;59:110---8.
4.Diretrizes eParâmetros Mínimos paraAvaliac¸ão e Acompan-hamento da Audic¸ão em TrabalhadoresExpostos a Níveisde Pressão Sonora Elevados, da NR-7 --- Programa de Controle
MédicodeSaúdeOcupacional---Portarian◦.19;09deabrilde
1998;MinistériodoTrabalho---(DOU22/04/98).Brasil,Brasília; 1998. Available from: http://portal.mte.gov.br/data/files/ FF8080812BE914E6012BEEB7F30751E6/p1998040919.pdf
5.Thomsen KA. The origin of impedance audiometry. Acta Otolaryngol.1999;119:163---5.
6.ThomsenKA.TheMetzrecruitmenttestandacomparisonwith thefowlermethod.ActaOtolaryngol.1955;45:544---52.
7.BlockMG,WileyTL.VisãoGeralePrincípiosBásicosdaImitância Acústica.In:KatzJ,editor.Tratadodeaudiologiaclínica.3rd ed.SãoPaulo:Manole;1989.p.512---9.
8.GuimarãesAC,deCarvalhoGM,VoltoliniMM,ZappeliniCE, Mez-zaliraR,StolerG,etal.Studyoftherelationshipbetweenthe degreeoftinnitusannoyanceandthepresenceofhyperacusis. BrazJOtorhinolaryngol.2014;80:24---8.
9.Oishi N, Hacht JSC. Emerging treatments for noise-induced hearing loss. Expert Opin Emerg Drugs. 2011;16: 235---45.
10.CostaEA [Dissertac¸ão,Mestrado]EstudodaCorrelac¸ãoentre aaudiometríatonaleoreconhecimentodemonossílabos mas-caradosprofalacompetitivanasperdasauditivasinduzidaspelo ruído.SãoPaulo:PontifíciaUniversidadeCatólicadeSãoPaulo (PUCSP);1992.
11.Mordini CA, Almeida K. Limiar do reflexo acústico e lim-iar de desconforto: estudo comparativo.Rev Cefac. 2000;2: 32---9.
12.NorthernJL,GabbardSA.Reflexoacústico.In:KatzJ,editor. TratadodeAudiologiaClínica.3rded.SãoPaulo:Manole;1989. p.221---34.
13.Hughes RW, Jones DM. Indispensable benefits and unavoid-ablecostsofunattendedsoundforcognitivefunctioning.Noise Health.2003;6:63---76.
14.BasnerM,BabischW,DavisA,BrinkM,ClarkC,JanssenS,etal. Auditoryandnon-auditoryeffectsofnoiseonhealth.Lancet. 2014;383:1325---32.
15.Mied HME, Oudshoorn CGM. Annoyance from transportation noise: relationships with exposure metrics DNL and DENL and their confidence intervals. Environ Health Perspect. 2001;109:409---16.
16.MuzeTA.Environmentalnoise,sleepandhealth.SleepMedRev. 2007;11:135---42.
18.SorensenM,AndersenZJ,NordsborgRB,JensenSS,LilelundKG, BelenR,etal.Roadtrafficnoiseandincidentmyocardial infarc-tion:aprospectivecohortstudy.PLoSONE.2012;7:e39283.
19.StansfeldSA,MathesonMP.Noisepollution:non-auditoryeffects onhealth.BrMedBull.2003;68:243---57.
20.FechterL,ChenG,RaoD.Chemicalasphyxiantsandnoise.Noise Health.2002;14:49---61.
21.Sliwinska-KowalskaM.Contributionofgeneticfactorsto noise-inducedhearingloss.In:GriefahnB,editor.10thinternational congressonnoiseasapublichealthproblemoftheinternational commissiononbiologicaleffectsofnoise.2011.Availablefrom:
http://www.icben.org/proceedings.html
22.Chen W, Jongkamonwiwat N, Abbas L, Eshtan AJ, Johnson SL, Kuhn S, et al. Restoration ofauditory evoked responses
byhumanES-cell-derivedoticprogenitors.Nature.2012;490: 278---82.
23.Campo P,MaguinK,Gabriel S,MollerA, GomezMDS,Topilla E, et al. Combined exposure to noise and ototoxic sub-stances: European Agency for Safety and Health at Work (EU-OSHA);2009.Availablefrom:https://osha.europa.eu/en/ publications/literature reviews/combined-exposure-to-noise-and-ototoxic-substances