Are parents aware of their children’s hearing complaints?
Abstract
Keila Alessandra Baraldi Knobel1, Maria Cecília Marconi Pinheiro Lima2
1 PhD; Researcher; Post-Doctoral Student - School of Medical Sciences - State University of Campinas.
2 PhD; Assistant Professor - Graduate Program in Speech and Hearing Therapy - Medical School of the State University of Campinas.
Send correspondence to: Keila Alessandra Baraldi Knobel. Rua Tessália Vieira de Camargo, nº 126, Cidade Universitária “Zeferino Vaz”. Campinas - SP. Brazil. CEP: 13083-887. E-mail: [email protected]
Fundação de Amparo à Pesquisa de São Paulo (Fapesp 2009/15825-0).
Paper submited to the BJORL-SGP (Publishing Management System - Brazilian Journal of Otorhinolaryngology) on December 17, 2011; and accepted on January 15, 2012. cod. 8938.
T
he accuracy of parents’ impressions about their child’s hearing status is variable and may not correspond to the child’s complaints.Aim: To investigate children’s self-reported hearing symptoms and parents’ impressions about it.
Methods: 477 children (2nd to 5th grades of elementary schools) were interviewed and parents an-swered a survey at home. There were 393 matches between the children’s interview and the par-ent’s survey.
Results: 29% of the children reported trouble in understanding what people said, 36.1% had history of 1-3 ear infections, 12.7% had four or more ear infections, 21.7% had continuous tinnitus (positive association with history of exposure to loud sounds, p = 0.0007), 3.8% had pulsatile tinnitus and 2.9% had auditory hallucinations. 28.5% of the children were annoyed by loud sounds (associated with tinnitus, p = 0.0142, and gender, p = 0.0029) 10.4% had had audiological tests, and the determinant factors were history of ear infections (p < 0.001) and parents’ concern about their child’s hearing (p = 0.043). Parents and their own child’s responses were significantly different.
Conclusions: Children’s auditory complaints were prevalent and relevant, but most of them had never had an audiological evaluation and most parents were not aware of their child’s complaints. Sound intolerances and auditory hallucinations should be considered in clinical and audiological examinations.
ORIGINAL ARTICLE Braz J Otorhinolaryngol.
2012;78(5):27-37.
BJORL
Keywords: child, hearing, hyperacusis, parents, tinnitus.
INTRODUCTION
Communication occurs in many ways, but oral communication is the main mode of the educational system. For this reason, early identification of any type or level of hearing loss gives students the opportunity of an early intervention to prevent negative effects of the hearing loss on the child’s speech, language, learning, and academic outcomes1,2.
The prevalence of hearing impairment in children depends on how rigorous the criteria are to define it1,3,4
and on living conditions and access to health care2,5.
According to the World Health Organization3, the
prevalence of hearing impairment among school aged children ranges from 0.05% to 7.7%, but more recent studies found prevalence of 14%6, 14.9%7, 18.4%8,
19.5%9 and 24%10. In summary, a considerable number
of children face hearing difficulties and need to be identified and receive proper assistance. In countries where hearing screening for school-aged children is not a routine, children can only count on adults’ attention. However, studies have shown that parental concern for their child’s hearing has low sensitivity and very low positive predictive values for detecting hearing loss, especially minimal or mild ones4,11,12.
Another auditory symptom that is common among children is tinnitus13. Tinnitus is a phantom auditory
perception, since it is a perception that is not related to an external source14-16. The prevalence of tinnitus among
children varies from 6% to 59%6. Despite the disclosed
prevalence data, attributed to important differences in methods of data collection, diagnostic criteria, and age groups6, there is a consensus that it is higher among
children with otological disorders or history of exposures to loud sounds4,6,17-20. Children seem to be less distressed
by tinnitus than adults, but children who complain of tinnitus should be taken seriously, since it may be a sign of an otological condition and can affect children’s lives as it is reported to have on adults18.
Auditory hallucination (AH) is a different kind of phantom auditory perception. When the perception has the same qualities as a real one, meaning that the person does not recognize it as a distorted perception, it is called auditory hallucination (AH)21. The prevalence
of AH in population based studies with adolescents from the general population is around 6%22,23, although the
number of parents who reported hallucinations in their children was less than 1%22. In a follow-up research,
Dhossche et al.22 reported that, eight years after they
found 6% of adolescents (out of 914) from the general population with self-reported hallucination, no subject
was diagnosed with schizophrenia. However, AH were associated with non-psychotic psychiatric problems, such as specific phobias, depressive disorders, sub-stance use disorders, post-traumatic stress disorder and social phobia. Similar development was found in 16 (out of 90) non-psychotic children (5-12 years old) that reported AH in psychiatric clinics24.
Hyperacusis is defined as a decreased sound tolerance to ordinary sounds, even in low intensities25.
Annoyance or feeling of displeasure with specific sounds can be called phonophobia (fear of sound) or misophonia (dislike of sound)26. There is scarce
pub-lished information on the prevalence, possible associ-ated causes and prognosis of decreased sound tolerance in childhood. A link between hyperacusis and tinnitus has been described in adults25-27 and in children28.
Ac-cording to Coelho et al.28 50% of the children who had
hyperacusis also reported tinnitus, and of those who did not have hyperacusis, 17.8% reported tinnitus.
In summary, population studies show that a sig-nificant number of children have at least one hearing complaint that can potentially cause negative effects on the child’s communication, academic outcomes and emotional well-being. The aims of the present study were to evaluate the parents’ impressions about their child’s hearing, the prevalence of self-reported hearing impairment, tinnitus, AHs and decreased sound toler-ance among children attending the 2nd to 5th grades of
elementary school and to investigate possible risk fac-tors for the complaints. The present study is part of a larger one that also sought information about children’s knowledge, habits, preferences and protective behaviors regarding loud sound exposures29.
METHOD
Design
A prospective cross-sectional study was carried out in elementary schools in Campinas, a southeastern Brazilian town with 1.1 million inhabitants. Data were collected between April 2010 and November 2010.
The survey started after a pilot test with 60 chil-dren and their parents. We selected the questions of questionnaire with the children and the questions of the survey to the parents that were most suitable for the research.
Selection criteria
In Campinas there are 72,326 students from 2nd to
5th grades30. Sixty per cent of them are distributed in 98
15% in approximately 180 Private Schools. It is important to explain that in Brazil there are free municipal and state public schools and private schools. With few exceptions, public schools have limited educational resources and, for this reason, families with higher incomes usually send their children to private school. Children go to school either during the morning or afternoon. Children from 2nd to 5th grades are 6 to 10 years-old.
The city is divided into five regions. The selec-tion of the schools was made in alphabetical order for each region. After a telephone contact, many school directors refused to receive us. So, the next school in alphabetical order in the same region was contacted. Using these criteria we selected 13 schools: seven State public, three Municipal public schools and three private. In large schools, with more than one class per year, the class was chosen also by letter (2nd, 3rd, 4th and 5th
years C, for example). In small schools students either from the morning or from the afternoon period were interviewed.
With these procedures we had a selected sample of 753 children. Children with medical records of mental or psychiatric disabilities were excluded. Parents (moth-er, father or caretaker) received the informed consent form and a survey (described in assessments) to be
filled out at home. Teachers collected the returned forms and questionnaires and gave them to the researcher, who went to the school to make the assessments. The number of interviewed children was 477. Considering the number of the selected sample and the number of interviewed children, the drop-out range was 36.8%. Withdrawals were due to no returns of the informed consent form (71.4%), parental refusals (23.2%), and children’s non attendances at school at the day of the interview (5.4%). Because some parents’ surveys were returned in blank, there were 393 matches between child’s interview and his/her own parent’s survey.
Procedure
The interviews with the children were conducted during school-time. All children gave verbal consent and were individually and privately interviewed by the first author in the most silent room available in the school. Care was taken to ensure that children understood the questions and had plenty time to respond. The inter-viewer did not express either approval or disapproval to the child’s answer at any time.
Assessments
The parents’ survey sought information on parental impressions of their child’s auditory be-havior and complaints, history of exposures to loud
sounds, the number of episodes of otitis media and background information (8 items, Appendix A). The children’s interview consisted of an open-ended ques-tionnaire, with guideline questions presented orally by the interviewer about demographic information, self-reported trouble hearing in quiet, phantom audi-tory perceptions, sound annoyance and information about previous hearing tests (5 items, see Appendix B). Many children and adults described their tinni-tus as sounds of insects, such as a bee or mosquito, tones and noises. But, to be considered tinnitus, these phantom auditory perceptions must be recognized by the person as “sounds” produced by their own ears or head. On the contrary, if the person does not recog-nize it as a distorted perception, it is called AHs21. For
this reason, children that reported they hear insects, tones or noises around them, but could identify where it came from, believing it to come from somewhere outside themselves, were considered to have AHs. We had not planned a question about the level of annoyance with phantom auditory perceptions, but a discussion of partial results showed its importance. For this reason, only a sub-group of the participants (239 children from state public schools) were answered to this question.
Statistical analysis
There was a content analysis for the questions that included descriptions. Those responses were coded prior to statistical analysis. Statistical analysis was per-formed by using SAS (version 9.1) and the significance level was 5%.
Homogeneity and other exposure factors were analyzed by using Chi-square Test for percentage differences and Fischer’s Exact Test for absolute frequencies (n < 5). Analysis of agreement in measure-ment comparing children’s and parents’ questionnaires was accomplished by using the Symmetric Test. It analyses how different the answers were.
Ethics
The present study was approved by the ethics committee of research (number 940/2009). Written con-sent was obtained from all parents and verbal concon-sent from all children.
RESULTS
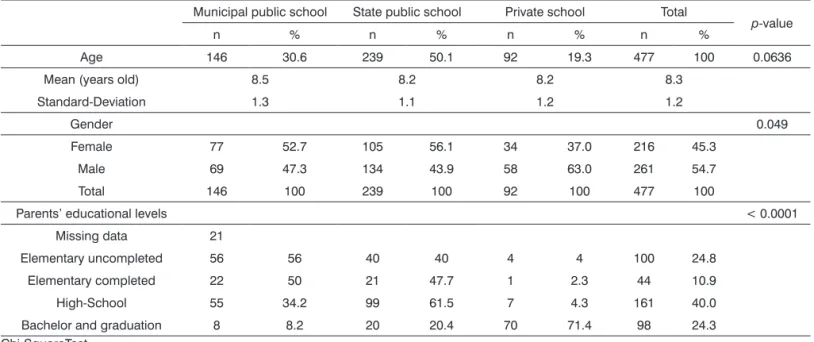
Table 1. Age, gender and parents’ educational level according to public and private schools.
Municipal public school State public school Private school Total
p-value
n % n % n % n %
Age 146 30.6 239 50.1 92 19.3 477 100 0.0636
Mean (years old) 8.5 8.2 8.2 8.3
Standard-Deviation 1.3 1.1 1.2 1.2
Gender 0.049
Female 77 52.7 105 56.1 34 37.0 216 45.3
Male 69 47.3 134 43.9 58 63.0 261 54.7
Total 146 100 239 100 92 100 477 100
Parents’ educational levels < 0.0001
Missing data 21
Elementary uncompleted 56 56 40 40 4 4 100 24.8
Elementary completed 22 50 21 47.7 1 2.3 44 10.9
High-School 55 34.2 99 61.5 7 4.3 161 40.0
Bachelor and graduation 8 8.2 20 20.4 70 71.4 98 24.3
Chi-SquareTest.
Twenty nine percent of the children reported some trouble understanding what people say, 0.6% said they always had some trouble. According to parents’ information, 36.1% of the children had his-tory of one to three ear infections, 12.7% had had four or more ear infections and 2.5% did not know. The number of previous ear infections was not asso-ciated with parent’s educational level (p = 0.639, Chi Square Test).
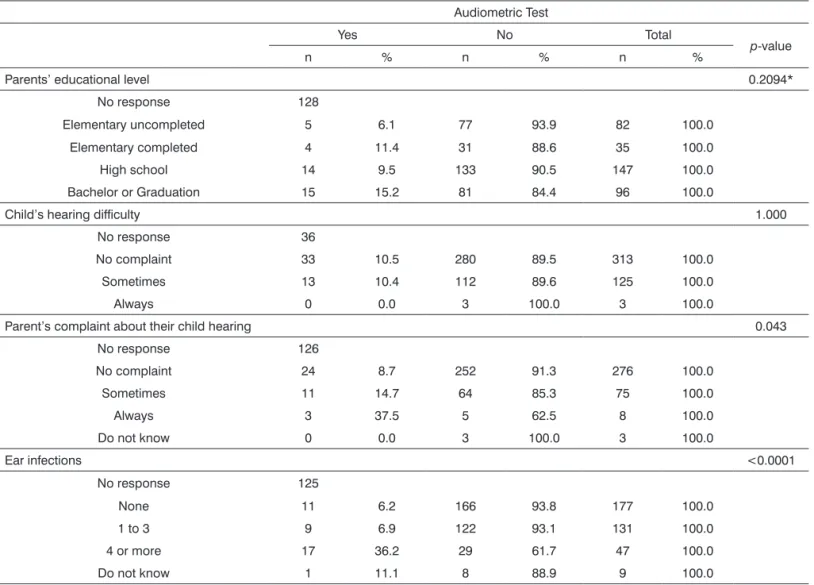
Despite the prevalence of self-reported hearing complaints and history of ear infections, only 10.4% had had an audiometric test, and almost 2/3 of them were from private schools. Table 2 displays the association of the audiometric test taken with parent’s educational level, children’s and parents’ complaints and history of ear infections.
Excluding missing data from 13 children, the number of children with phantom auditory perception was 135 (28.4%). After classifying the perceptions, three categories were found: continuous tinnitus, such as a continuous ring or hum (n = 103/21.7%), pulsatile tin-nitus (n = 18/3.8%) and AHs (n = 14/2.9%).
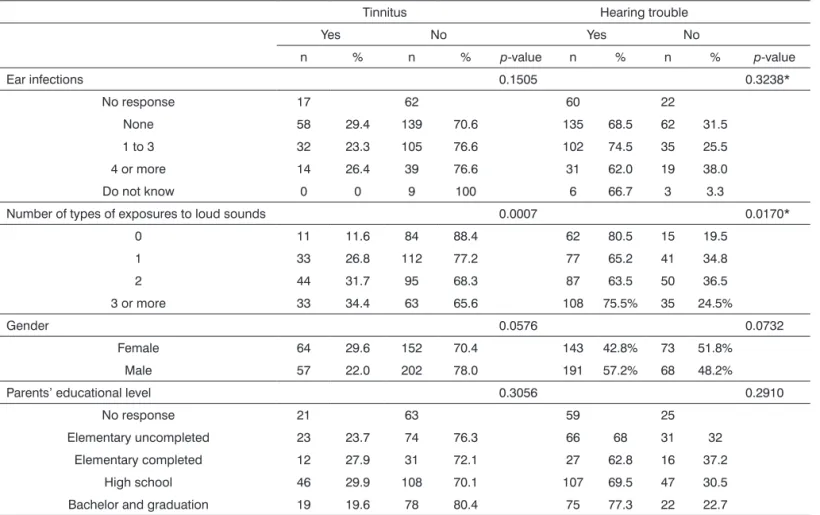
Table 3 provides the number and gender of children and the descriptions of their AHs. Owing to the small number of subjects with AHs, parametric tests were not performed. History of previous ear infections and previous exposure to loud sounds, gender and parents’ educational level were examined with a view to investigating their association with complaints of trouble hearing and tinnitus (continuous and pulsatile) (Table 4).
Regarding the question about sounds that both-ered the child, 59.4% denied any annoyance with sounds, 28.5% were annoyed by loud sounds (noise or music), 2.9% high pitch sounds, 1.0% body sounds produced by others (snoring, cleaning accumulated mu-cus in the throat, swallowing), 3.5% scratching sounds (on iron, black-board, polystyrene…) and 4.7% referred to other sounds, such as a broom sweeping, a plastic cup being squeezed, a chair being dragged across the floor, sand-paper, etc.
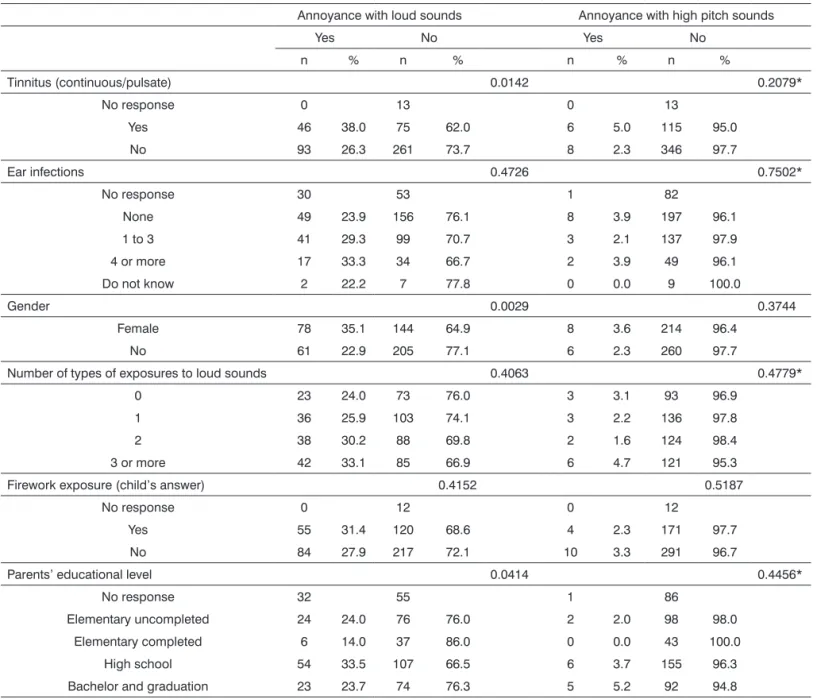
The study of the associations of previous ear infections, previous exposure to loud sounds, tinnitus, gender and parents’ educational level with sound an-noyance with loud and high pitch sounds is shown in Table 5. Agreements among children’s and their own parents’ answers are shown in Table 6. Dashed cells refer to agreement among parent and child answers. A symmetric test analyses how different they were.
DISCUSSION
The present study investigated self-reported hear-ing complaints among Brazilian children attendhear-ing the 2nd, 3rd, 4th and 5th grades of elementary schools and
parents’ perceptions about this.
Table 3. Number of descripted auditory hallucinations, gender and level of annoyance.
Description Gender n Level of annoyance
Not bothered at all A little annoyed Very annoyed
Insects M/F 2 x
Tones F 1 x
Noises M 1 x
Doorbell F 1 x
Paces F 1 x
A voice screaming M 1 x
Sounds of somebody at home moving things around and horns M 1 x
Voices Conversing Together F 1 x
Music And Cat F 1 x
Music and weird sounds F 1 x
Own name been called by a voice M/M 2 x
A voice giving orders F 1 x
M: male, F: female.
Table 2. Audiometric test according to parent’s educational level, children’s and parents complaints and history of ear infections.
Audiometric Test
Yes No Total
p-value
n % n % n %
Parents’ educational level 0.2094*
No response 128
Elementary uncompleted 5 6.1 77 93.9 82 100.0
Elementary completed 4 11.4 31 88.6 35 100.0
High school 14 9.5 133 90.5 147 100.0
Bachelor or Graduation 15 15.2 81 84.4 96 100.0
Child’s hearing dificulty 1.000
No response 36
No complaint 33 10.5 280 89.5 313 100.0
Sometimes 13 10.4 112 89.6 125 100.0
Always 0 0.0 3 100.0 3 100.0
Parent’s complaint about their child hearing 0.043
No response 126
No complaint 24 8.7 252 91.3 276 100.0
Sometimes 11 14.7 64 85.3 75 100.0
Always 3 37.5 5 62.5 8 100.0
Do not know 0 0.0 3 100.0 3 100.0
Ear infections <0.0001
No response 125
None 11 6.2 166 93.8 177 100.0
1 to 3 9 6.9 122 93.1 131 100.0
4 or more 17 36.2 29 61.7 47 100.0
Do not know 1 11.1 8 88.9 9 100.0
Table 4. Association of continuous and pulsatile tinnitus and trouble hearing complaints with previous ear infections, previous exposure to loud sounds, gender and parents educational level.
Tinnitus Hearing trouble
Yes No Yes No
n % n % p-value n % n % p-value
Ear infections 0.1505 0.3238*
No response 17 62 60 22
None 58 29.4 139 70.6 135 68.5 62 31.5
1 to 3 32 23.3 105 76.6 102 74.5 35 25.5
4 or more 14 26.4 39 76.6 31 62.0 19 38.0
Do not know 0 0 9 100 6 66.7 3 3.3
Number of types of exposures to loud sounds 0.0007 0.0170*
0 11 11.6 84 88.4 62 80.5 15 19.5
1 33 26.8 112 77.2 77 65.2 41 34.8
2 44 31.7 95 68.3 87 63.5 50 36.5
3 or more 33 34.4 63 65.6 108 75.5% 35 24.5%
Gender 0.0576 0.0732
Female 64 29.6 152 70.4 143 42.8% 73 51.8%
Male 57 22.0 202 78.0 191 57.2% 68 48.2%
Parents’ educational level 0.3056 0.2910
No response 21 63 59 25
Elementary uncompleted 23 23.7 74 76.3 66 68 31 32
Elementary completed 12 27.9 31 72.1 27 62.8 16 37.2
High school 46 29.9 108 70.1 107 69.5 47 30.5
Bachelor and graduation 19 19.6 78 80.4 75 77.3 22 22.7
Chi-Square Test / *Fisher’s Exact Test.
health care, housing, nutrition, etc. For this reason, we decided to analyze the variable parents’ educational level across self-reported hearing complaints and not the school “type”. Children’s age was similar among schools, but there were more boys than girls (p = 0.049), which correspond to the gender distribution in the city for this age range30.
Hearing difficulties
Previous researches associated hearing difficul-ties to ear infections and lower incomes2,31. Although
the majority of the Brazilian children who go to private schools are wealthier than the others, history of previous ear infections was not significantly different between public and private schools (p = 0.2000, Fisher’s Exact Test). Contrary to other studies2,32, we did not find an
association between children’s hearing difficulties and history of ear infections, probably because of differ-ences in methodology. In our study we investigated the self-reported hearing difficulty, not the hearing impairment, evaluated by both studies2,32 using
pure-tone audiometry, tympanometry and otoscopy. Also,
we gathered the total number of ear infections the child had in his/her life, while they looked for specific data, such as “otitis media treated with antibiotics”, “more than three episodes of otitis media in a year”2 and
“otor-rhea”2,32. Holgers & Pettersson33 found that the risk of
subjective hearing loss increases with increasing noise exposure. Although there was an association between hearing difficulties and history of loud sound exposure in our study, it seems that there is a confounding vari-able affecting the hearing difficulty, since any number of exposures to loud sounds (from none to more than four) resulted in a higher percentage of children with complaints of hearing trouble.
Annoyance with loud sounds Annoyance with high pitch sounds
Yes No Yes No
n % n % n % n %
Tinnitus (continuous/pulsate) 0.0142 0.2079*
No response 0 13 0 13
Yes 46 38.0 75 62.0 6 5.0 115 95.0
No 93 26.3 261 73.7 8 2.3 346 97.7
Ear infections 0.4726 0.7502*
No response 30 53 1 82
None 49 23.9 156 76.1 8 3.9 197 96.1
1 to 3 41 29.3 99 70.7 3 2.1 137 97.9
4 or more 17 33.3 34 66.7 2 3.9 49 96.1
Do not know 2 22.2 7 77.8 0 0.0 9 100.0
Gender 0.0029 0.3744
Female 78 35.1 144 64.9 8 3.6 214 96.4
No 61 22.9 205 77.1 6 2.3 260 97.7
Number of types of exposures to loud sounds 0.4063 0.4779*
0 23 24.0 73 76.0 3 3.1 93 96.9
1 36 25.9 103 74.1 3 2.2 136 97.8
2 38 30.2 88 69.8 2 1.6 124 98.4
3 or more 42 33.1 85 66.9 6 4.7 121 95.3
Firework exposure (child’s answer) 0.4152 0.5187
No response 0 12 0 12
Yes 55 31.4 120 68.6 4 2.3 171 97.7
No 84 27.9 217 72.1 10 3.3 291 96.7
Parents’ educational level 0.0414 0.4456*
No response 32 55 1 86
Elementary uncompleted 24 24.0 76 76.0 2 2.0 98 98.0
Elementary completed 6 14.0 37 86.0 0 0.0 43 100.0
High school 54 33.5 107 66.5 6 3.7 155 96.3
Bachelor and graduation 23 23.7 74 76.3 5 5.2 92 94.8
Table 5. Annoyance with loud and high pitch sounds according to studied variables.
Chi-Square Test / * Fisher’s Exact Test.
parents about why they did or did not take their child for a hearing evaluation. Thus, we cannot say if parents took their child to have a hearing test because they were really worried about their child’s auditory behavior or if they expressed their concern with their child’s hearing because the child (maybe) failed in a hearing test that was ordered by a health care professional.
The symmetric test pointed to a significant dif-ference between the parents and their own child’s answers. In Table 5 we verify that, among the 116 children who had trouble hearing in silence, only 45 (38.8%) had parents that were aware of their difficulty. Though we found 29.6% of children with some hearing complaints (0.6% with more evident trouble) we cannot
directly transpose it into actual hearing losses, since we did not evaluate their hearing and predictive values of parental suspicion of hearing impairment are yet to be discussed4,34-36. Despite those weak points, we totally
agree with Cone et al.4 that a caregiver’s concern with
regards a child’s hearing development is enough reason to prompt a formal hearing assessment.
Tinnitus and AHs
Table 6. Agreements between children’s and parents’ answers.
Child considers his/herself to have trouble hearing Parent consider child to have trouble hearing
No Sometimes Always Do not know Total Agreement p-value
No 230 40 2 2 271
70.2% 0.0140
Sometimes 65 45 5 1 116
Always 3 0 3 0 3
Do not know 2 0 0 0 0
Total 297 85 10 3 395
Child says he/she has tinnitus Parent says the child complained about tinnitus
Yes No Do not know Total Agreement p-value
Yes 25 73 2 100
70.1% <0.0001
No 26 247 15 288
Do not know 0 0 0 0
Total 51 320 17 388
Child says he/she is annoyed by loud sounds Parent says the child covers the ears when exposed to loud sounds Yes Sometimes No Do not know Total Agreement p-value
Yes 28 34 27 3 92
68.2% <0.0001
Sometimes 0 0 0 0 0
No 52 76 159 24 311
Do not know 0 0 0 0 0
Total 80 110 186 27 403
Symmetric Test.
sound annoyances and then we classified them. Tinnitus was reported by 28.4% of the children and was similar to the findings of Mills et al. (29%)19 and Raj-Koziak et
al. (33%)37, but much higher than the findings of 9.2%
from Holgers17 (12%) study and lower than Coelho et
al. (37.5%)6 for the same age group.
We observed a significant association between tinnitus and the history of loud sound exposures6,17,38,
which is worrying, since there is evidence that tinnitus may be an early warning sign of noise induced hear-ing loss20.
Only 51% of the parents reported that their child had tinnitus. So, despite the fact that half of the children did not talk to their parents about their tinnitus, we consider that our findings cast doubt on the assumption that it is rare for children to complain spontaneously of tinnitus to their parents19,37,39.
In our sample, 13 children (2.7%) reported auditory phantom perceptions that were compat-ible with AHs (Table 3). It is less than reported by other studies22-24, but it still shows that the symptom
is not uncommon in childhood. Only one child had verbal hostile AHs, in which she told that she heard “her dead uncle giving orders to her”. Another child reported that she heard voices conversing together, but she said it was not possible to understand anything; it
was more like a bubble noise. So, except for one child, the other AHs in this sample were predominantly non-threatening24,40.
Sound annoyance
We identified almost half of the children with some annoyance with sounds. Of course, our data is not enough to diagnose children with hyperacusis nor pho-nophobia, but our results are generally the same as those obtained by Coelho et al.28, who evaluated the Loudness
Discomfort Level (LDL) of children within the same age group. Their study indicated that, among the children with LDL in the lowest 5th percentile (lower than 90 dB
HL), 42% were bothered by sounds, 3.2% had hyperacusis and 9% had phonophobia. Our study also supports that there is an association between tinnitus and annoyance with sounds (p = 0.0142) and that there is a higher oc-currence of the complaint among girls (p = 0.0029), both found previously in studies with children28 and adults41.
Limitations
The attempt to find possible relations between hearing complaints and the number of types of noise exposures may have been limited because children self-reported noise exposures and we have no data about how frequent or infrequent those exposures were. It is also possible that some children did not remember taking an audiometric test.
Future directions
Parental and teacher vigilance over children’s hearing behavior and sensitive hearing screening pro-grams are essential to identify children that should take a complete ear and hearing evaluation. Besides, we need to encourage children to talk about themselves or, at least, we have to start listening to their complaints and it follows that if the child has a hearing complaint, tinnitus, AHs or annoyance with sounds, something has to be done.
We also support the urgent need of hearing screening programs and pediatric ear health assistance for school-aged children. Ideally, hearing and audiologi-cal examinations should be incorporated into routine pediatric visits, especially for children of literacy age.
CONCLUSION
Difficulties in understanding what peo-ple say, decreased sound tolerance, tinnitus and hearing hallucinations are common complaints among children. Despite the relevance of those auditory complaints, the majority of the parents were not aware of their child’s complaint, and even when they were, most of the children did not take an audiological evaluation. Sound intolerances and AHs should be considered in clinical and audiological ex-aminations.
ACKNOWLEDGEMENTS
This work was supported by the Fundação de Amparo à Pesquisa de São Paulo (Fapesp 2009/15825-0). The funding organization had no role in the design and conduct of the study; in the collection, analysis, and interpretation of the data; or in the prepara-tion, review, or approval of the manuscript. Statis-tical analysis performed by Sirlei Moraes was much appreciated.
Child’s name: __________________________________________________________________ Child’s age: ___________ Child’s educational level: _____________________ School: __________________________________________________
1) Educational level of respondent:
( ) Elementary uncompleted ( ) Elementary completed ( ) High school ( ) Graduation ( ) Post-graduation
2) Does your child understand speech in silent environments?
( ) Yes, always ( ) Sometimes he/she seems not to hear ( ) He/she always has some dificulty ( ) I don’t know
3) Has your child ever complained of ringing in the ears or other sounds in the ear or inside the head? ( ) Yes ( ) No ( ) I don’t know
4) Does your child get annoyed by any sound that doesn’t bother others? ( ) Yes ( ) Sometimes ( ) No ( ) I don’t know
5) How many ear infections has you child had? ( ) None ( ) 1 to 3 ( ) More than 4 ( ) I don’t know
6) Does your child go to noisy places, where it is dificult to talk because the sound is too loud?
( ) Yes ( ) No ( ) I don’t know
7) Does your child cover his/her ears or complain where there are loud sounds around? ( ) Yes ( ) Sometimes ( ) No ( ) I don’t know
8) Has your child ever been close to ireworks, gun shots or explosions?
( ) Yes ( ) No ( ) I don’t know
Appendix B. Interview with the child (performed in Portuguese).
Date: __/__/____ Register # __________________
Name: _____________________________________________________________________________ Age: _____________ School: ____________________________________________________________________________ Grade: ___________
1) Do you always understand what people say to you?
( ) Yes ( ) Sometimes it is dificult ( ) It is always dificult ( ) I don’t know
2) Do you hear any kind of noise in your ears or head?
( ) Yes. Description:__________________________ ( ) No ( ) I don’t know
3) Are you bothered by it? ( ) Not at all ( ) A little ( ) A lot
4) Are you bothered by any sound?
( ) Yes. Description:__________________________ ( ) No ( ) I don’t know
5) Have you ever done any of these: ( ) Gone to carnival parties
( ) Gone to shows or parties with very loud music (you have to yell to be heard)
( ) Played with ireworks or were close (6 feet) to someone playing with them
( ) Join an adult in a noisy job (woodwork, car repair facility, factories) ( ) Been in noisy vehicles (quadricycles, jet sky, kart, tractor) ( ) Listened to loud music at home or in the car. Who put it on?
( ) Listened to loud music using headphones or ear buds. Who put it on?
6) Have you ever had your hearing tested? Describe it.
___________________________________________________________________
REFERENCES
1. Bess FH, Dodd-Murphy J, Parker RA. Children with minimal sensorineural hearing loss: prevalence, educational performance, and functional status. Ear Hear. 1998;19(5):339-54.
2. Czechowicz JA, Messner AH, Alarcon-Matutti E, Alarcon J, Quinones-Calderon G, Montano S, et al. Hearing impairment and poverty: the epidemiology of ear disease in Peruvian scho-olchildren. Otolaryngol Head Neck Surg J. 2010;142(2):272-7. 3. Mathers C, Smith A, Concha M. Global burden of hearing loss
in the year 20002003: Available from: http://www.who.int/heal-thinfo/statistics/bod_hearingloss.pdf
4. Cone BK, Wake M, Tobin S, Poulakis Z, Rickards FW. Slight-mild sensorineural hearing loss in children: audiometric, clinical, and risk factor profiles. Ear Hear J. 2010;31(2):202-12.
5. Evans GW, Marcynyszyn LA. Environmental justice, cumula-tive environmental risk, and health among low- and middle--income children in upstate New York. Am J Public Health. 2004;94(11):1942-4.
6. Coelho CB, Sanchez TG, Tyler R. Tinnitus in children and asso-ciated risk factors. Progr Brain Res. 2007;166:179-91.
7. Niskar AS, Kieszak SM, Holmes AE, Esteban E, Rubin C, Brody DJ. Estimated prevalence of noise-induced hearing threshold shifts among children 6 to 19 years of age: the Third National Health and Nutrition Examination Survey, 1988-1994, United States. Pediatrics. 2001;108(1):40-3.
8. Olusanya BO, Okolo AA, Aderami AA. Predictors of hearing loss in school entrants in a developing country. J Postgrad Med. 2004;50(3):173-8.
9. Shargorodsky J, Curhan SG, Curhan GC, Eavey R. Change in preva-lence of hearing loss in US adolescents. JAMA. 2010;304(7):772-8.
10. Araújo SA, Moura JR, Camargo LA, Alves W. Avaliação auditiva em escolares. Rev Bras Otorrinolaringol. 2002;68(2):263-6. 11. Marini ALS, Halpern R, Aerts D. Sensibilidade,
especificida-de e valor preditivo da queixa auditiva. Rev Saúespecificida-de Pública. 2005;39(6):982-4.
12. Watkin PM, Baldwin M, Laoide S. Parental suspicion and identifi-cation of hearing impairment. Arch Dis Child. 1990;65(8):846-50. 13. Bartnik G, Stepień A, Raj-Koziak D, Fabijańska A, Niedzialek I,
Skarżyński H. Troublesome tinnitus in children: epidemiology, audiological profile, and preliminary results of treatment. Int J Pediatr. 2012. Epub 2011 Jul 19.
14. Weisz N, Müller S, Schlee W, Dohrmann K, Hartmann T, Elbert T. The neural code of auditory phantom perception. J Neurosci. 2007;27(6):1479-84.
15. Harris KD. Hallucinations and nonsensory correlates of neural activity. Behav Brain Sci. 2004;27(6):796.
16. Nam EC. Is it necessary to differentiate tinnitus from audi-tory hallucination in schizophrenic patients? J Laryngol Otol. 2005;119(5):352-5.
17. Holgers KM. Tinnitus in 7-year-old children. Eur J Pediatr. 2003;162(4):276-8.
18. Kentish RC, Crocker SR, McKenna L. Children’s experience of tinnitus: a preliminary survey of children presenting to a psycho-logy department. Br J Audiol. 2000;34(6):335-40.
19. Mills RP, Albert DM, Brain CE. Tinnitus in childhood. Clin Oto-laryngol Allied Sci. 1986;11(6):431-4.
20. Griest SE, Bishop PM. Tinnitus as an early indicator of perma-nent hearing loss. A 15 year longitudinal study of noise exposed workers. AAOHN J. 1998;46(7):325-9.
22. Dhossche D, Ferdinand R, Van Der Ende J, Hofstra MB, Verhulst F. Diagnostic outcome of self-reported hallucinations in a com-munity sample of adolescents. Psychol Med. 2002;32(4):619-27. 23. Kelleher I, Harley M, Lynch F, Arseneault L, Fitzpatrick C, Can-non M. Associations between childhood trauma, bullying and psychotic symptoms among a school-based adolescent sample. Br J Psychiatry. 2008;193(5):378-82.
24. Askenazy FL, Lestideau K, Meynadier A, Dor E, Myquel M, Lecrubier Y. Auditory hallucinations in pre-pubertal children. A one-year follow-up, preliminary findings. Eur Child Adolesc Psychiatry. 2007;16(6):411-5.
25. Baguley DM. Hyperacusis. J R Soc Med. 2003;96(12):582-5. 26. Jastreboff PJ, Jastreboff MM. Decreased sound tolerance. In:
Snow JB, editor. Tinnitus: theory and management. Hamilton: BC Decker; 2004. p.8-15.
27. Anari M, Axelsson A, Eliasson A, Magnusson L. Hypersensitivity to sound--questionnaire data, audiometry and classification. Scand Audiol. 1999;28(4):219-30.
28. Coelho CB, Sanchez TG, Tyler RS. Hyperacusis, sound annoyan-ce, and loudness hypersensitivity in children. Prog Brain Res. 2007;166:169-78.
29. Knobel KA, Lima MC. Knowledge, habits, preferences and protective behavior in relation to loud sound exposures among Brazilian children. Int J Audiol. 2012;51(Suppl 1):S12-9. 30. Anuário Estatístico do Estado de São Paulo. São Paulo: Fundação
SEADE; 2003.
31. Béria JU, Raymann BC, Gigante LP, Figueiredo AC, Jotz G, Roi-thman R, et al. Hearing impairment and socioeconomic factors: a population-based survey of an urban locality in southern Brazil. Rev Panam Salud Publica. 2007;21(6):381-7.
32. Seely DR, Gloyds SS, Wright AD, Norton SJ. Hearing loss pre-valence and risk factors among Sierra Leonean children. Arch Otolaryngol Head Neck Surg. 1995;121(8):853-8.
33. Holgers KM, Pettersson B. Noise exposure and subjective hea-ring symptoms among school children in Sweden. Noise Health. 2005;7(27):27-37.
34. Borgstein BM, Raglan E. Parental awareness and the detection of hearing loss. Pediatr Rehabil. 1998;2(4):165-72.
35. Lo PS, Tong MC, Wong EM, van Hasselt CA. Parental suspicion of hearing loss in children with otitis media with effusion. Eur J Pediatr. 2006;165(12):851-7.
36. Taha AA, Pratt SR, Farahat TM, Abdel-Rasoul GM, Albtanony MA, Elrashiedy AL, et al. Prevalence and risk factors of hearing impairment among primary-school children in Shebin El-kom District, Egypt. Am J Audiol. 2010;19(1):46-60.
37. Raj-Koziak D, Piłka A, Bartnik G, Fabijańska A, Kochanek K, Skarzyński H. The prevalence of tinnitus in 7-year-old children in the eastern of Poland. Otolaryngol Pol. 2011;65(2):106-9. 38. Hoffman HJ, Reed GW. Epidemiology of tinnitus. In: Snow JB, editor.
Tinnitus Theory and Management. London: Decker; 2004. p.16-41. 39. Baguley DM, McFerran DJ. Tinnitus in childhood. Int J Pediatr
Otorhinolaryngol. 1999;49(2):99-105.
40. Choong C, Hunter MD, Woodruff PW. Auditory hallucinations in those populations that do not suffer from schizophrenia. Curr Psychiatry Rep. 2007;9(3):206-12.