www.ann-geophys.net/33/845/2015/ doi:10.5194/angeo-33-845-2015
© Author(s) 2015. CC Attribution 3.0 License.
Solar-wind control of plasma sheet dynamics
M. Myllys1, E. Kilpua1, and T. Pulkkinen2
1Department of Physics, University of Helsinki, Helsinki, P.O. Box 64, Finland
2Aalto University School of Electrical Engineering, P.O. Box 1100, 00076 Aalto, Finland
Correspondence to:M. Myllys ([email protected])
Received: 24 February 2015 – Revised: 21 May 2015 – Accepted: 22 May 2015 – Published: 21 July 2015
Abstract.The purpose of this study is to quantify how solar-wind conditions affect the energy and plasma transport in the geomagnetic tail and its large-scale configuration. To iden-tify the role of various effects, the magnetospheric data were sorted according to different solar-wind plasma and inter-planetary magnetic field (IMF) parameters: speed, dynamic pressure, IMF north–south component, epsilon parameter, Auroral Electrojet (AE) index and IMF ultra low-frequency (ULF) fluctuation power. We study variations in the average flow speed pattern and the occurrence rate of fast flow bursts in the magnetotail during different solar-wind conditions us-ing magnetospheric data from five Time History of Events and Macroscale Interactions during Substorms (THEMIS) mission spacecraft and solar-wind data from NASA’s OM-NIWeb. The time interval covers the years from 2008 to 2011 during the deep solar minimum between cycles 23 and 24 and the relatively quiet rising phase of cycle 24. Hence, we investigate magnetospheric processes and solar-wind– magnetospheric coupling during a relatively quiet state of the magnetosphere. We show that the occurrence rate of the fast (|Vtail|>100 km s−1) sunward flows varies under different solar-wind conditions more than the occurrence of the fast tailward flows. The occurrence frequency of the fast tailward flows does not change much with the solar-wind conditions. We also note that the sign of the IMFBZhas the most visible
effect on the occurrence rate and pattern of the fast sunward flows. High-speed flow bursts are more common during the slow than fast solar-wind conditions.
Keywords. Magnetospheric physics (plasma sheet)
1 Introduction
The coupling of the solar wind to the magnetosphere has long been a subject of active research. In particular, the mech-anisms of the energy transfer from the solar wind to the magnetosphere have been of great interest. According to the open model of the magnetosphere (Dungey, 1961), the mag-netospheric magnetic field reconnects with the interplane-tary magnetic field (IMF) on the dayside magnetopause. The opened geomagnetic field lines are transported to the magne-totail, where they are reconnected again. The resulting closed and stretched field lines migrate back to the dayside magne-topause. This motion generates the large-scale plasma con-vection in the magnetosphere.
The energy transfer efficiency from the solar wind to the Earth’s magnetosphere is often studied by comparing vari-ous coupling functions (combinations of solar-wind param-eters), as well as individual solar-wind parameters, with the geomagnetic indices (Meng et al., 1973; Stamper et al., 1999; Finch and Lockwood, 2007). For example, Akasofu’s epsilon parameter (Perreault and Akasofu, 1978; Akasofu, 1981) is a commonly used coupling function to estimate the efficiency of the energy transfer to the inner magnetosphere. The day-side reconnection rate depends strongly on the sign of the IMF north–south component (BZ component). In addition,
the solar-wind speed has been found to correlate well with monthly and annual geomagnetic activity levels (Crooker et al., 1977; Finch et al., 2008).
to be 400 km s−1. The bursty bulk flow events (BBF) (An-gelopoulos et al., 1992, 1993) are defined as periods when the flow speed average exceeds 100 km s−1 and is above 400 km s−1(Baumjohann et al., 1990; Angelopoulos et al., 1992) for at least two samples during the 1 min period.
High-speed (> 250 km s−1) flows have also been classified into two distinct categories based on their ion distributions: bulk flows and field-aligned beams (Nakamura et al., 1991; Raj et al., 2002). Bulk flows are perpendicular to the mag-netic field at the neutral sheet but have a large field-aligned component at higher magnetic latitudes. Field-aligned beams are mainly detected away from the neutral sheet. The occur-rence of BBF shows a dawn–dusk asymmetry in contrast to field-aligned beams (Raj et al., 2002).
In recent studies, the average bulk flow pattern and the characteristics of the plasma sheet flows with speed have been studied during the different IMFBZconditions and
sub-storm phases (Juusola et al., 2011a, b). However, there are only few studies of the large-scale magnetospheric flow pat-tern under different solar-wind conditions. One such study was recently published by Pulkkinen et al. (2013), who stud-ied plasma sheet flows during steady magnetospheric con-vection events.
Previous studies of plasma sheet convection have shown that (1) the average ion bulk flow speed in the central plasma sheet has been found to be low, below 100 km s−1 (Baumjo-hann et al., 1990; Juusola et al., 2011b); (2) high-speed flows (> 400 km s−1) occur in bursts mostly less than 10 s in du-ration (Baumjohann et al., 1990); (3) the slow flow pat-tern (|v⊥|<200 km s−1) is not significantly different
dur-ing northward and southward IMF conditions, but the over-all flow speed is higher during southward IMF (Wang et al., 2006); (4) the largest occurrence rates of high-speed bursts (> 400 km s−1) are found near the midnight merid-ian, and their occurrence peaks strongly in the sunward di-rection (Baumjohann et al., 1990); (5) high-speed bursts (> 400 km s−1) are almost always directed earthward in-side −20RE (Earth radius=6372 km), indicating that their source is beyond X (GSM)<−19RE (Shiokawa et al., 1997); (6) the occurrence rate of the high-speed burst de-creases closer the Earth in the region fromX= −19 to−9RE (Shiokawa et al., 1997); (7) the tailward BBFs are rare and in-frequent but the ratio of tailward to earthward BBFs increases with distance from the Earth (Angelopoulus et al., 1994); (8) BBF events occur in only 10 % of crossings (Angelopoulus et al., 1994).
Although on average the plasma flows are directed sun-ward in the plasma sheet, there are also tailsun-ward flows. The tailward flows can be classified depending on theirBZ
ori-entation. Tailward flows with southward BZ are rare and
are usually considered to be caused by reconnection tak-ing place earthward of the observation point. The tailward flows with northward BZ are often found in the region −8> X >−15RE (|Y|<5RE), while most of the strong (<−500 km s−1) southwardB
Z flows occur in the range of
−15> X >−30RE(Ohtani et al., 2009). The dominance of tailward flows with northwardBZindicates that reconnection
is not the primary cause of the flows. Ohtani et al. (2009) sug-gest that the sources of tailward flows could be the balloon instability and rebound of fast sunward flows near the Earth. The latter mechanism is supported by the fact that tailward flows are normally preceded by fast sunward flows and also by global Magnetohydrodynamics (MHD) simulations (Wilt-berger et al., 2000).
The purpose of this study is to quantify how solar-wind conditions affect the energy and plasma transport in the geomagnetic tail. We use tail observations from the five THEMIS spacecraft during the years 2008–2011. During this period the THEMIS spacecraft spend a considerable time in the geomagnetic tail allowing us to compile statistical maps of plasma flow properties and to study the tail energy trans-port. In addition, this time period corresponds to the ex-tended and prolonged solar activity minimum between solar cycle 23 and 24 and the relatively quiet rising phase of cycle 24. This allows us to investigate magnetospheric processes and solar-wind–magnetospheric coupling during a relatively quiet state of the magnetosphere. To uniquely identify the role of various effects, the magnetospheric data were sorted according to different solar-wind plasma parameters and by the Auroral Electrojet (AE) index. We study the variations in the average bulk flow speed pattern and the occurrence of the flow bursts exceeding 50 and 100 km s−1and their preferred direction during different solar-wind conditions.
In this paper the first section describes the data sources and methods used in this study. The second section analyses the results. We end with discussion and conclusions.
2 Data and methods 2.1 Data sources
The solar wind and AE index data with 1 min resolution have been extracted from NASA Goddard Space Flight Cen-ter’s OMNI data set through the OMNIWeb interface (http: //omniweb.gsfc.nasa.gov/). The data have been propagated to the nose of the Earth’s bow shock. The parameters used are the solar-wind flow speed, IMF components in the GSM (geocentric solar magnetospheric coordinate system) coordi-nates, dynamic pressure and AE index.
2.2 Methods
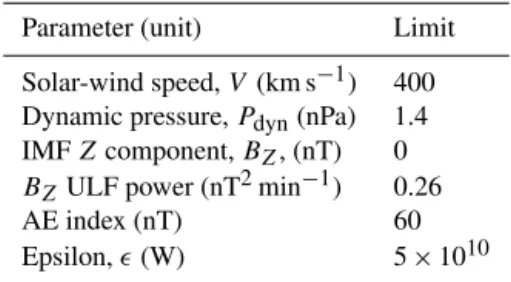
The magnetospheric data used to create the statistical maps were binned depending upon particular solar-wind or AE ac-tivity conditions. The median values of the distribution for each parameter were used to divide the magnetospheric data set into two parts to study the effect of each parameter on the magnetotail plasma flows and flow burst characteristics. The limit (median) values and the used solar-wind parame-ters are also listed in Table 1. A few exceptions were made to using the median values: for the IMF Z component, we used the limit value of 0 nT. The median value for the AE index (60 nT) does not delimit geomagnetically quiet and ac-tive times, but the data coverage turned out to be poor when we tried to use the upper quartile of the AE index distribu-tion.
A 1 h sliding average time series for each solar-wind pa-rameter was computed preceding the tail measurement. In the case of the AE index, the 1 h sliding average time series was computed following the tail measurement. We chose a 1 h av-erage since it roughly corresponds to the time it takes for the solar-wind plasma to be transported to the magnetotail. Time steps were connected directly with the THEMIS observation at the same time. The average plasma sheet flow in the GSM XY plane were computed using the THEMIS ion VX and
VY velocity components (Vtail2 =VX2+VY2). We excluded the
Zcomponent of the velocity because the component mainly consists of the vertical movement of the plasma sheet and is not part of the plasma convection. The flow speed was multi-plied by the sign of the flowVXcomponent in order to
differ-entiate predominantly sunward (VX>0) and tailward (VX<0)
flows.
We cover the region−30<X<0REand−10<Y <10RE, whereX andY are coordinates in the GSM coordinate sys-tem. THEMIS observations were removed if the|Z| compo-nent was greater than 5RE. To distinguish the plasma sheet periods from the lobe periods, we used the criterion ion β >0.5 (Raj et al., 2002; Juusola et al., 2011b) for the plasma sheet. The velocity vectors contain both the perpendicular and parallel components. The magnetospheric data set may include some field-aligned beam samples, but according to Raj et al. (2002) the criterion β >0.5 should remove 45 % of these undesired high-speed (> 250 km s−1) samples. Even if the results are shown in the area−30<X<0RE, we note that the data quality may decrease whenX >−10REbecause the rising temperatures may cause a significant part of the ion distribution functions to be above the high-energy threshold of the ESA ion instruments.
The magnetotail region was divided into 1RE×1REbins and the average of the observations inside each bin were cal-culated. To smooth the data and increase the statistics, the bin size was increased by taking observations from the bin center to±1RE, both inXandY directions, resulting in an average bin size of 2×2RE2. At least 25 measurement points were required for each 2×2RE2bin when the flow averages
Table 1.Solar-wind parameters and their limit values.
Parameter (unit) Limit
Solar-wind speed,V (km s−1) 400 Dynamic pressure,Pdyn(nPa) 1.4 IMFZcomponent,BZ, (nT) 0 BZULF power (nT2min−1) 0.26
AE index (nT) 60
Epsilon,ǫ(W) 5×10¹⁰
and the occurrence rate of the high-speed bursts were com-puted. The flow averages were calculated separately for flow speeds < 50 km s−1(convection-related effects) and for flow speeds > 50 km s−1(bursts created by dynamic events in the tail). Previous studies (Baumjohann et al., 1990) have shown that the mean central plasma sheet velocity is typically below 50 km s−1. Hence, we decided to choose 50 km s−1 as the limit value. Because we use 1 min averages, our plasma flow values are lower than in previous studies. Consequently our flow amplitudes cannot be directly compared with the previ-ous results examining data at higher time resolution. We have divided all the measurement points into four bins according to speed and direction to study the properties of each veloc-ity bin separately:Vtail<−50 km s−1;−50 km s−1<Vtail< 0; 0 <Vtail< 50 km s−1andVtail>50 km s−1.
3 Results
3.1 Plasma sheet flow, all data
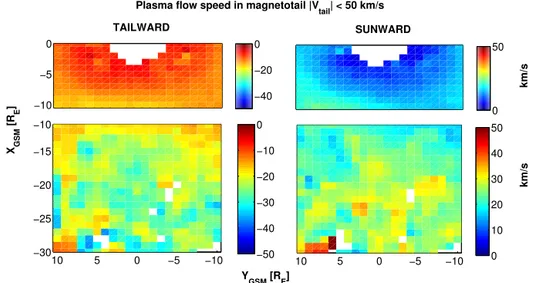
We first investigate plasma flow patterns for all data during 2008–2011 and then proceed to separate the data according to solar-wind and geomagnetic conditions. Figures 1 and 2 show the averages of the plasma flow speed for sunward (right panels) and tailward (left panels) flows of less than 50 km s−1and greater than 50 km s−1. The flows have been divided according to the sign of theVXcomponent. The left
panels show the sunward flows and the right panels the tail-ward flows.
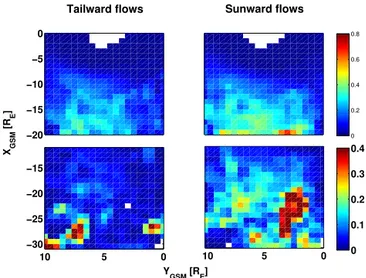
Figure 3 shows the occurrence rate of fast flow bursts. Since flow bursts slow down considerably when they ap-proach the Earth, we have used a different threshold for flow bursts in the regions−20<X<0REand−30<X<−10RE (separated by a small gap in the figure). In the near-Earth tail the threshold for a flow burst is 50 km s−1, while in the mid-tail we used the limit 100 km s−1.
−10 −5 0
km/s
10 5 0 −5 −10
XGSM
[R
E
]
YGSM [RE]
10 5 0 −5 −10
−30 −25 −20 −15 −10
km/s
−40 −20 0
−50 −40 −30 −20 −10 0
0 50
0 10 20 30 40 50
Plasma flow speed in magnetotail |Vtail| < 50 km/s
SUNWARD TAILWARD
Figure 1.Average plasma flow pattern for slows flows (|Vtail|<50 km s−1) in 2008–2011. The colors show the average speed of the bin.
−10 −5 0
km/s
10 5 0 −5 −10
XGSM
[R
E
]
YGSM [RE]
10 5 0 −5 −10
−30 −25 −20 −15 −10
km/s
−100 −80 −60
−120 −100 −80 −60
60 80 100
60 80 100 120 140 160 180
SUNWARD TAILWARD
Plasma flow speed in magnetotail |Vtail| > 50 km/s
Figure 2.Average plasma flow pattern for fast flows (|Vtail|>50 km s−1) in 2008–2011. The colors show the average speed of the bin.
starting point of the majority of tailward flows. In the case of bursts > 50 km s−1, the difference between the occurrence of the sunward and tailward bursts is not as clear as in the case bursts > 100 km s−1, but it is still visible. The bursts >|50|km s−1seem to cease whenX >−10R
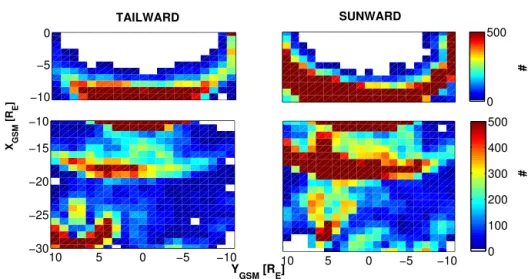
E. The lack of measurement points (Fig. 5) for both fast (Fig. 4) and slow flows (not shown here) on the dawnside whenXis between −20 to−30RE may be the reason for the high occurrence rate of fast bursts inside the region (Fig. 3).
The average plasma flow maps (|Vtail|>50 km s−1, Fig. 2) show a dawn–dusk asymmetry of the sunward and tailward flow speed. The clear asymmetry of the flows is probably due to the asymmetry of the observations (Figs. 4 and 5). Such an asymmetry is not visible in the case of small flows (|Vtail|<50 km s−1, Fig. 1). The local maximum of the oc-currence rate of tailward flows atX≈ −20−15RE(Fig. 4)
may be due to the sporadic appearance of a near-Earth neu-tral line (NENL).
3.2 Average plasma sheet flow during different solar-wind conditions
−20 −15 −10 −5 0 XGSM [R E ]
10 5 0
−30 −25 −20 −15
10 5 0
YGSM [RE]
0 0.2 0.4 0.6 0.8 0 0.1 0.2 0.3 0.4
Tailward flows Sunward flows
Figure 3.Percentage of observations during which 1 min averaged flow speed exceeds 50 km s−1(upper panels) or 100 km s−1(lower panels) during studied time interval. The data set is divided into two groups based on the sign of theVXcomponent.
X<−20RE; (4) the occurrence rate of the tailward flow bursts over 100 km s−1 does not significantly vary with the solar wind conditions; (5) the average slow flow pattern is not affected by the solar-wind conditions.
The occurrence maps showing the high-speed bursts (the bottom panels in Figs. 6, 7 and 8) demonstrate that the most visible changes in the flow pattern during different solar-wind conditions are caused by the decrease in fast sunward flows rather than by a significant increase in tailward bursts. The flow pattern of the tailward bursts seems to be steadier than the pattern of sunward flows.
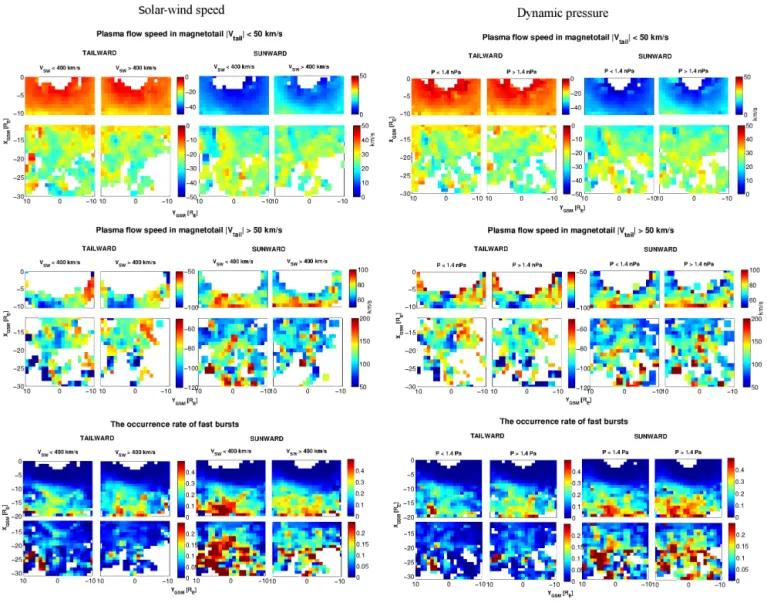
3.2.1 Solar-wind speed
The top and middle right-hand panels of Fig. 6 show the av-erage tail plasma flow for sunward and tailward flows when |Vtail|<50 km s−1and|Vtail|>50 km s−1, respectively, using the division according to the solar-wind speed (see Table 1).
The occurrence rates of tailward and sunward flow bursts which exceed 50 km s−1 (X >−20R
E) and 100 km s−1 (X<−10) during the high and slow solar-wind periods (the bottom-right panels) are shown in Fig. 6. It can be seen that the occurrence rate of sunward bursts exceeding 100 km s−1 varies significantly with changing solar-wind speed condi-tions. The occurrence rate is much higher during the slow wind than during the fast wind. The high occurrence rate re-gion is also more concentrated on the dusk side during the slower solar wind compared to fast solar-wind times. The number of fast bursts decreases drastically whenX >−20RE during the slower solar wind, while for the faster wind the de-crease starts already atX >−15RE. The occurrence range of the tailward bursts are not appreciably affected by the
solar-wind speed but the tailward bursts exceeding 100 km s−1are a bit more common between−15> X >−20RE.
3.2.2 Solar-wind dynamic pressure
The left-hand top and middle panels of Fig. 6 show the aver-ages of fast (|Vtail|>50 km s−1) and slow (|Vtail|<50 km s−1) tail plasma flows during two different solar-wind dynamic pressure levels (see limiting value from Table 1). During low Pdyn, the average fast plasma sheet flows are higher at the midnight meridian when−20<X<−15RE.
The bottom-left panels of Fig. 6 show the occurrence rate of fast (|Vtail|>50 km s−1and|Vtail|>100 km s−1) sunward and tailward bursts during the same pressure conditions. It can be seen from the figures that the occurrence rate of high-speed bursts increases during high solar-wind pressure condi-tions. Especially inside the area−20<X<−15REthe sun-ward bursts exceeding 100 and 50 km s−1 have a wider oc-currence range during high-Pdynconditions than during the low-Pdynconditions. During the low-pressure periods the fast flows are clearly focused on the narrow channel at the mid-night meridian. The occurrence range of fast tailward bursts is slightly expanded during higher-Pdynperiods. In the case of tailward bursts, the bursts exceeding 50 km s−1occur more often betweenX >−15 andX <−10REthan during lower-Pdynconditions.
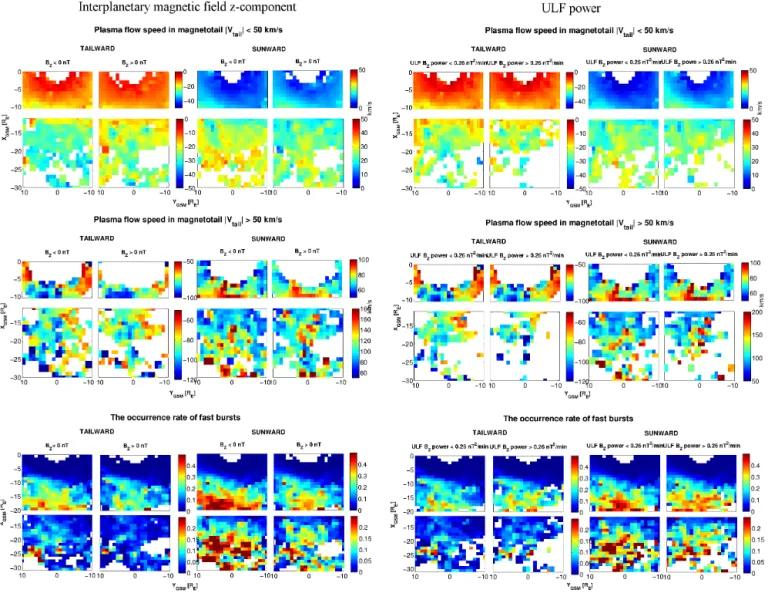
3.2.3 Interplanetary magnetic field direction
The bottom-right panels of Fig. 7 show the occurrence rate of high-speed tail and sunward bursts during the southward and northward IMF component conditions. In turn, Fig. 7 (right-hand top and middle panels) shows the net plasma flow dur-ing the sameBZcriteria for sunward and tailward flows with |Vtail|>50 km s−1and|Vtail|<50 km s−1.
It can be seen that IMFBZ has a clear effect on the
oc-currence rate of high-speed bursts. In particular,BZseems to
have the largest effect on the occurrence rate of fast tailward bursts (|Vtail|>50 and 100 km s−1) among all investigated solar-wind parameters. The number of > 50 km s−1tailward bursts increases significantly during negative (southern)BZ
conditions. Also, the number of sunward bursts increases whenBZ<0, and the bursts are spread over a larger area. In
turn, for northward IMF conditions, the sunward bursts are focused inside a narrow channel near the magnetic midnight. The sunward net flow maps (Fig. 7, the middle right-hand panels) show that during periods in whichBZ<0 nT
the average sunward plasma flow intensifies in the region −20<X<−12REnear the midnight meridian. The sunward net flow is also intensified whenX<−20RE, and the fast flows are spread into a wider region than during the north-ward BZ. However, the poorer data coverage during the
northward BZ limits the observations. There is an area at
SUNWARD
−10 −5 0
#
TAILWARD
10 5 0 −5 −10
XGSM
[R
E
]
10 5 0 −5 −10
−30 −25 −20 −15 −10
Y
GSM [RE]
#
0 100 200 300 400 500 0 500 Plasma flow speed in magnetotail |V
tail| > 50 km/s
Figure 4.Number of 1 min averaged data points (|Vtail|>50 km s−1) in 2008–2011.
Figure 5.Number of all 1 min averaged data points in 2008–2011.
around it. This area also features weaker net plasma flow in the maps of an average flow speed of > 50 km s−1. The weakening of the sunward flows in the area may be related to the formation of the reconnection line. The tailward net flow does not show large changes during differentBZconditions,
but this may also be because of the limited data set during the positiveBZ. Instead, the tailward net flow pattern for slow
flows (|Vtail|<50 km s−1) shows clear differences during dif-ferent IMFBZtimes (Fig. 7, the top-right panels). The
aver-age flow is slower whenBZis positive.
3.2.4 Ultra low-frequency power
We also investigated the effect of ultra low-frequency (ULF) BZ power on the tail plasma flow pattern and burst
occur-rence. The 2–12 min frequency range was used to calculate the ULF powers. The results are presented in the left panels of Fig. 7.
The convection pattern stayed almost constant regard-less of the ULF BZ power level. The data coverage is
poor, but according to the existing data, the sunward flow (|Vtail|>50 km s−1) is slightly intensified in the range of −20<X<−10RE during the high ULF power conditions, but otherwise the flow patterns remain relatively similar. The occurrence rate of tailward (> 50 and > 100 km s−1) bursts does not show any significant difference between the two ULFBZpower levels. In the case of sunward bursts, the only
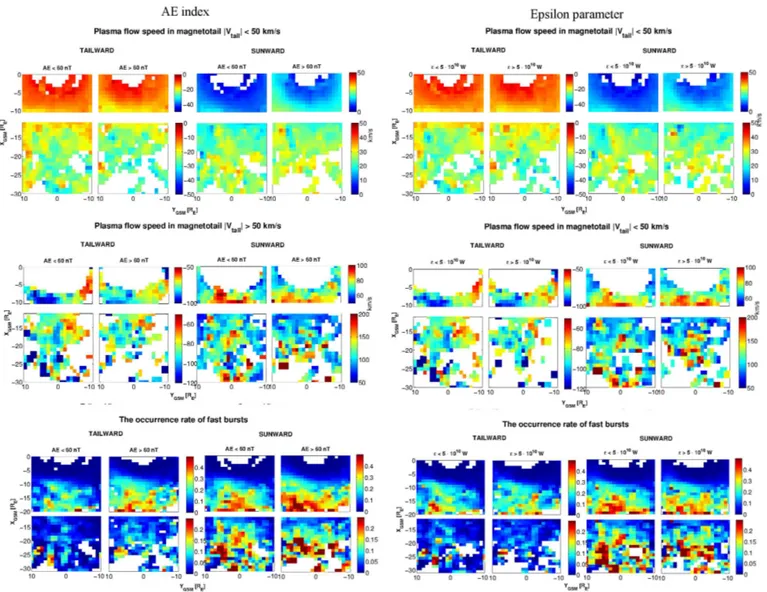
visible difference occurs when−20< X <−15RE. 3.2.5 AE index
-Figure 6.Average plasma flow pattern for slow (|Vtail|<50 km s−1, top panels) and fast flows (|Vtail|>50 km s−1, middle panels), ratio
between the time steps when tail flow bursts exceeded 50 km s−1(bottom panels, region 0> X >−20R
E) or 100 km s−1(bottom panels,
region−20> X >−30RE), and all time steps when the data points are divided into groups based on the solar-wind speed and dynamic pressure. The limit for the 1 h sliding average solar-wind speed and pressure values are written above the maps. The tailward and sunward flows are shown separately.
3.2.6 Epsilon parameter
One coupling function was chosen for this study: Akasofu’s epsilon parameter which is given in SI units as
ǫ=4π µ0
V B2sin4(θ 2)l
2
0. (1)
In the formula, l0 is an empirically determined scale length, set to 7RE, B is the magnitude of the IMF, V is the solar-wind speed, andθis the “clock angle” between the Z axis and the projection of the IMF onto theY Zplane in the GSM coordinates. The epsilon parameter is usually used to estimate the energy transfer to the inner magnetosphere. This parameter depends on the interplanetary magnetic field
Figure 7.Average plasma flow pattern for slow (|Vtail|<50 km s−1, top panels) and fast flows (|V
tail|>50 km s−1, middle panels), ratio
between the time steps when tail flow bursts exceeded 50 km s−1(bottom panels, region 0> X >−20RE) or 100 km s−1(bottom panels, region−20> X >−30RE), and all time steps when the data points are divided into groups based on the interplanetary magnetic fieldz
component and ULFBZpower. The limit for the 1 h sliding averageBZand ULF power values are written above the maps. The tailward and sunward flows are shown separately.
4 Discussion and conclusions
We have studied the large-scale plasma transport in the mag-netotail during different solar-wind conditions in 2008–2011. To find out the role of different solar-wind parameters and their levels in relation to the average sunward and tailward plasma flows and the occurrence rate of fast plasma bursts, the magnetospheric data were sorted according to the solar-wind measurements. The results are shown in statistical maps (Figs. 6, 7, and 8). This study highlights the active energy flow in the plasma sheet in the primarily weakly driven mag-netosphere.
The statistical maps confirm some of the features that have been observed in earlier studies. Most of the time the plasma flow is less than 100 km s−1, as can be seen in Fig. 3 as well
Figure 8.Average plasma flow pattern for slow (|Vtail|<50 km s−1, top panels) and fast flows (|Vtail|>50 km s−1, middle panels), ratio
between the time steps when tail flow bursts exceeded 50 km s−1(bottom panels, region 0> X >−20R
E) or 100 km s−1(bottom panels,
region−20> X >−30RE), and all time steps when the data points are divided into groups based on the AE index and epsilon parameter.
The limit for the 1 h sliding average AE index and epsilon parameter values are written above the maps. The tailward and sunward flows are shown separately.
to the occurrence maps of fast bursts (Figs. 6, 7 and 8, the bottom panels), the tailward bursts > 100 km s−1are mainly located beyond−20REregardless of the solar-wind condi-tions.
Variations in the plasma flow pattern in the magnetotail during the northern and southern IMF periods are likely to reflect differences in the energy transfer from the solar wind to the magnetosphere by viscous interaction (Tsurutani and Gonzalez, 1995) and reconnection processes (Dungey, 1961). The efficiency of solar-wind energy injection into the magnetosphere is less efficient via viscous interaction than reconnection (Tsurutani and Gonzalez, 1995), which can be seen in this study as a weaker net plasma flow in the magne-totail in the northward IMF in Fig. 7.
Figure 2, which includes all the 4-year data, reveals an area of fast tailward flows at midnight meridian when −25RE< X <−20RE. The previous studies have estimated the location of NENL to be at −20RE< XGSM<−30RE (Nagai et al., 1998). The tailward net flow whenX<−20RE is likely caused by the formation of an NENL. The loca-tion of NENL is also visible in some of the average plasma flow maps (Figs. 6, 7 and 8), which are sorted based on the solar-wind plasma parameters. For example, the southern BZ, the upper limit of epsilon, dynamic pressure and
solar-wind speed also show the NENL whenX≈ −20RE. In summary, we found that the occurrence rate of the fast (|Vtail|>100 km s−1) sunward flows varies in different solar-wind conditions more than the occurrence of the fast tail-ward flows. In general, the number of fast tailtail-ward flows does not change much with the solar wind. We also noted that the sign of the IMFBzhas the most visible effect on the
occurrence rate and pattern of fast sunward flows. The flow bursts exceeding 50 and 100 km s−1are also more common during slow wind than high solar wind; to our knowledge, these bursts have not been reported previously. This result still needs further investigations; in particular, the effects of the result should be studied. Also, the possible mechanisms which may cause the increased occurrence rate of the bursts during slow solar wind should be a topic of future studies.
Acknowledgements. The work of E. Kilpua and M. Myllys is
funded by Academy of Finland projects 1218152 and 1267087. The topical editor L. Blomberg thanks the two anonymous referees for help in evaluating this paper.
References
Akasofu, S.-I.: Energy coupling between the solar wind and the magnetosphere, Space Sci. Rev., 28, 121–190, 1981.
Angelopoulos, V., Baumjohann, W., Kennel, C. F., Coroniti, F. V., Kivelson, M. G., Pellat, R., Walker, R. J., Lühr, H., and Paschmann, G.: Bursty bulk flows in the inner central plasma sheet, J. Geophys. Res.-Space, 97, 4027–4039, 1992.
Angelopoulos, V., Kennel, C. F., Coroniti, F. V., Pellat, R., Kivelson, M. G., Walker, R. J., Russell, C. T., Spence, H. E., Baumjohann, W., and Feldman, W. C.: Characteristics of ion flow in the quiet state of the inner plasma sheet, Geophys. Res. Lett., 20, 1711– 1714, 1993.
Angelopoulos, V., Kennel, C. F., Coroniti, F. V., Pellat, R., Kivelson, M. G., Walker, R. J., Russell, C. T., Baumjohann, W., Feldman, W. C., and Gosling, J. T.: Statistical characteristics of bursty bulk flow events, J. Geophys. Res.-Space, 99, 21257–21280, 1994. Auster, H.U., Glassmeier, K.H., Magnes, W., Aydogar, O.,
Baumjo-hann, W., Constantinescu, D., Fischer, D., Fornacon, K. H., Georgescu, E., Harvey, P., Hillenmaier, O., Kroth, R., Ludlam, M., Narita, Y., Nakamura, R., Okrafka, K., Plaschke, F., Richter, I., Schwarzl, H., Stoll, B., Valavanoglou, A., and Wiedemann, M.: The THEMIS fluxgate magnetometer, The THEMIS Mis-sion, Springer, New York, 235–264, 2009.
Baumjohann, W., Paschmann, G., and Lühr, H.: Characteristics of high-speed ion flows in the plasma sheet, J. Geophys. Res.-Space, 95, 3801–3809, 1990.
Crooker, N. U., Feynman, J., and Gosling, J. T.: On the high corre-lation between long-term averages of solar wind speed and geo-magnetic activity, J. Geophys. Res., 82, 1933–1937, 1977. Dungey, J. W.: Interplanetary magnetic field and the auroral zones,
Phys. Rev. Lett., 6, 47–48, 1961.
Finch, I. and Lockwood, M.: Solar wind-magnetosphere coupling functions on timescales of 1 day to 1 year, Ann. Geophys., 25, 495–506, doi:10.5194/angeo-25-495-2007, 2007.
Finch, I. D., Lockwood, M. L., and Rouillard, A. P.: Effects of solar wind magnetosphere coupling recorded at differ-ent geomagnetic latitudes: Separation of directly-driven and storage/release systems, Geophys. Res. Lett., 35, L21105, doi:10.1029/2008GL035399, 2008.
Juusola, L., Østgaard, N., Tanskanen, E., Partamies, N., and Snekvik, K.: Earthward plasma sheet flows during substorm phases, J. Geophys. Res.-Space, 116, A10228, doi:10.1029/2011JA016852, 2011a.
Juusola, L., Østgaard, N., and Tanskanen, E.: Statistics of plasma sheet convection, J. Geophys. Res.-Space, 116, A08201, doi:10.1029/2011JA016479, 2011b.
McFadden, J. P., Carson, C. W., Larson, D., Ludlam, M., Abiad, R., Elliott, B., Turin, P., Marckwordt, M., and Angelopous V.: The THEMIS ESA Plasma Instrument and In-flight Calibration, Space Sci. Rev., 141, 277–302, 2008.
Meng, C-I., Tsurutani, B., Kawasaki, K., and Akasofu, S.-I.: Cross-correlation analysis of the AE index and the interplanetary mag-netic field Bzcomponent, J. Geophys. Res., 78, 617–629, 1973. Nagai, T., Fujimoto, M., Saito, Y., Machida, S., Terasawa, T.,
Naka-mura, R., Yamamoto, T., Mukai, T., Nishida, A., and Kokubun, S.: Structure and dynamics of magnetic reconnection for sub-storm onsets with Geotail observations, J. Geophys. Res.-Space, 103, 4419–4440, 1998.
Nakamura, M., Paschmann, G.,Baumjohann, W., and Sckopke, N.: Ion distributions and flows near the neutral sheet, J. Geophys. Res., 96, 5631–5649, 1991.
Ohtani, S., Miyashita, Y., Singer, H., and Mukai, T.: Tailward flows with positiveBZ in the near-Earth plasma sheet, J. Geophys. Res.-Space, 114, A06218, doi:10.1029/2009JA014159, 2009. Perreault, P. and Akasofu, S. I.: A study of geomagnetic storms,
Geophys. J. Int., 54, 547–573, 1978.
Pulkkinen, T. I., Partamies, N., Kissinger, J., McPherron, R. L., Glassmeier, K.-H., and Carlson, C.: Plasma sheet magnetic fields and flows during steady magnetospheric convection events, J. Geophys. Res.-Space, 118, 6136–6144, 2013.
Raj, A., Phan, T., Lin, R. P., and Angelopoulos, V.: Wind survey of high-speed bulk flows and field-aligned beams in the near-Earth plasma sheet, J. Geophys. Res., 107, 1419, 2002.
Shiokawa, K., Baumjohann, W., and Haerendel, G.: Braking of high-speed flows in the near-Earth tail, Geophys. Res. Lett., 24, 1179–1182, 1997.
Stamper, R., Lockwood, M., Wild, M. N., and Clark, T. D. G.: So-lar causes of the long-term increase in geomagnetic activity, J. Geophys. Res.-Space, 104, 28325–28342, 1999.
intense northward IMF events, Geophys. Res. Lett., 22, 663–666, 1995.
Wang, C.-P., Lyons, L., Weygand, J., Nagai, T., and McEntire, R.: Equatorial distributions of the plasma sheet ions, their electric and magnetic drifts, and magnetic fields under different inter-planetary magnetic field Bzconditions, J. Geophys. Res.-Space, 111, A04215 doi:10.1029/2005JA011545, 2006.