www.e-afr.org
Litter fall and nutrient status of green leaves and leaf
litter at various compound ratios of fertilizer in
saw-tooth oak stands, Korea
C. Kim, J.-K. Byun, J.-H. Park, H.-S. Ma
Kim C., Byun J.-K., Park J.-H., Ma H.-S., 2013. Litter fall and nutrient status of green leaves and leaf litter at various compound ratios of fertilizer in sawtooth oak stands, Korea, Ann. For. Res. 56(2): 339-350, 2013.
Abstract. This study was conducted to evaluate the litter fall and nutrient status of green leaves and leaf litter at various compound ratios of fertilizer in 28-year-old sawtooth oak (Quercus acutissima Carruth.) stands. The compound ratios of the fer-tilizer were N3P4K1 (100 kg N ha-1, 133 kg P ha-1, and 33 kg K ha-1), N
6P4K1, N2P2K1,
N3P8K1, N3P4K2, and N0P0K0 (control). Varying ratios of NPK were applied for three years (2002 - 2004), and the litter fall and green leaves were collected for one year (May 2005 - May 2006) and at the end of growing season (September 2005). Leaf litter was signifi cantly higher (P < 0.05) in the N3P4K2 (3,423 kg ha-1 year-1) than in
the N3P8K1 (2,741 kg ha-1 year-1) and N
2P2K1 (2,891 kg ha
-1 year-1) treatments. The
N concentrations of the green leaves were signifi cantly higher in the compound ratios of fertilizer (N3P4K1,N6P4K1, N3P8K1) than in the N0P0K0 treatment, but the N concentrations of the leaf litter were not affected by the fertilizer. The P and K concentrations in the green leaves were signifi cantly higher in the highest dose (N3P8K1 and N3P4K2) of these nutrients than in the N0P0K0 treatment. The nutrient inputs by the leaf litter corresponded to the differences in the leaf litter mass or nu-trient concentrations rather than the various compound ratios of fertilizer. Nunu-trient use and resorption effi ciencies were only weakly controlled by various compound ratios of fertilizer. The results indicate that the nutrient status of green leaves may serve as an indicator of various compound ratios of fertilizer, whereas litter fall, nutrient use and resorption effi ciency can be attributed to inherent soil conditions or stand characteristics following fertilizer application in sawtooth oak stands.
Keywords forest fertilization, litter fall, nutrient cycling, oak, soil property.
Authors.Choonsig Kim ([email protected]), Jae-Hyun Park - Department of Forest Resources, Gyeongnam National University of Science and Technology, Jinju 660-758, Republic of Korea, Jae-Kyung Byun - Korea Forestry Promotion Institute, Seoul 121-914, Republic of Korea, Ho-Seop Ma - Department of For-est Environmental Resource, Gyeongsang National University, Jinju 660-701, Republic of Korea.
Introduction
The foliar nutrient concentrations of trees are an important parameter in the assessment of the nutritional status of forests after fertilizer application (Weetman & Wells 1990, Smith et al. 2000, Tausz et al. 2004) because the addi-tion of fertilizer to improve forest productivity can affect the quality and quantity of foliage. Generally, nutrient concentrations of foli-age have been accepted as good indicators of growth and soil fertility on site (Bauer et al. 1997), although the nutrient status in foliage could be attributed to many environmental fac-tors, such as soil properties, season length, and water supply (Weetman & Wells 1990).
Understanding the resultant change in the litter fall amounts at fertilizer application is important because annual litter fall production can be used to estimate the foliage biomass, which may be a factor in determining the re-sponse to fertilizer application. However, fer-tilizer application has been shown to increase (O’connell & Grove 1993, Laclau et al. 2009), decrease and exert no discernible effect (Smaill et al. 2008, Kim et al. 2011) on the litter fall production in forest ecosystems. Also, the nu-trient dynamic of litter fall following fertilizer application is likely to modify nutrient distri-bution on the forest fl oor (O’connell & Grove 1993, Smith et al. 2000), but litter nutrient pro-cesses have been shown to be affected by the type of fertilizer applied (Laclau et al. 2009) and the application rate (Nelson et al. 1995, Finér 1996).
Despite many studies on the nutrient status of forest stands following fertilizer application (Byun et al. 2006, Son et al. 2007, Park et al. 2008), there is still a lack of knowledge about the litter fall and nutrient responses of the foli-age involved in various compound ratios of the fertilizer in Korean forest stands. Furthermore, understanding more information that may be used to evaluate the effects of litter fall and nutrient inputs at various compound ratios of fertilizer is needed because of a myriad of
nu-tritional problems, such as nutrient defi ciency, in forest stands in Korea (Byun et al. 2006, Hwang et al. 2007, Son et al. 2007). In addi-tion, the application of the suitable fertilization ratio, considering the soil environmental con-ditions and tree growth characteristics, is one of the most effective ways to reduce cost and fertilizer waste and pollution.
The objectives of this study were: (i) to de-termine the amount of litter fall, (ii) to measure the nutrient status and associated parameters, such as resorption, concentration, and quantity of the nutrients in green leaves and in leaf lit-ter, at various compound ratios of fertilizer in mature oak stands which are the most wide-spread hardwood tree species throughout the country.
Materials and methods
The study was conducted in a national forest (127o 35’ 43” E, 36 o 35’ 40” N, elevation 250
m) in Choojeongri, Nangseong-myon, Cheon-gwon-gun, central Korea. The study sites were classifi ed as a slightly dry dark reddish brown forest soil (mostly Inceptisol, USDA soil clas-sifi cation system) originating from sandstone. The average annual precipitation at the study sites is 1,225 mm, and the average temperature is 12.3°C. The aspect of the site was north-fac-ing, and the slopes ranged from 25° to 30°. The mean age of the natural sawtooth oak stands was approximately 28 years. The dominant understory species in the site were Lindera erythrocarpa Makino, Q. aliena Blume, Ul-mus davidiana var. japonica Nakai, Prunus sargentii Rehder, Euonymus alatus Sieb., Rosa multifl ora Thunb., Philadelphus schrenckii
Rupr., Rhus trichocarpa Miq., Ligustrum ob-tusifolium Sieb. et Zucc., and Staphylea bum-alda DC.
m × 20 m plots (6 treatment plots [fi ve fertil-ized plots with one control] × 3 replicates) and were randomly assigned, with a 5 m buffer zone between each plot. The fertilizers were manually applied to the forest fl oor surface dur-ing the sprdur-ing for each of three years between 2002 and 2004. Urea, fused superphosphate, and potassium chloride fertilizers were used as sources of nitrogen (N), phosphorus (P), and potassium (K), respectively. The compound ratios of the fertilizers were N3P4K1 (100 kg N ha-1, 133 kg P ha-1 , and 33 kg K ha-1), N
3P8K1
(100 kg N ha-1, 266 kg P ha-1, and 33 kg K ha-1),
N3P4K2 (100 kg N ha-1, 133 kg P ha-1, and 66 kg
K ha-1), N
6P4K1 (200 kg N ha
-1, 133 kg P ha-1,
and 33 kg K ha-1), N
2P2K1 (66 kg N ha
-1, 67 kg
P ha-1, and 33 kg K ha-1), and N
0P0K0 (control).
The ratios of the N3P4K1 fertilizer were gen-erally recommended for the improvement of growth within mature forests in Korea (Joo et al. 1983). The mean diameter at breast height (DBH) was 22.8 cm in the N0P0K0 treatment and 20.1 - 22.8 cm in the fertilizer treatments, whereas the stand basal area was lower in the N3P8K1 (8.9 m2 ha-1) than in the N
2P2K1 (15.5
m2 ha-1) treatment (Table 1).
A soil pit was dug near the center of each plot before (2002) and after (2005) the ferti-lizer treatments. Soil samples were collected from each soil horizon (A and B). The soil samples were air dried, passed through a 2-mm sieve, and used for soil chemical analyses. Soil pH (1:5 soil : water suspension) was measured
by glass electrode. The soil samples were di-gested by the Kjeldahl procedure to determine the total N. Available P was determined by the Lancaster method (National Institute of Agri-cultural Science and Technology 2000). Cal-cium (Ca), magnesium (Mg), sodium (Na) and potassium (K) were determined by ICP (Jobin Yvon, Model Ultima-2). The soil chemical properties before and after the application of the fertilizer treatments are given in Table 2. Litter fall was collected by litter traps from three sampling points within each treatment plot. Litter traps using a 1.5 mm nylon net with a collective area of 0.25 m2 were placed
randomly within each treatment plot (a total of 54 traps: 6 treatment plots × 3 replication plots × 3 traps in each plot). Litter was collected at approximately monthly intervals for one year, from May 2005 to May 2006. Litter collected from each trap was transported to the labora-tory and oven-dried at 65°C for 48 h. All dried samples were separated into leaves, branches, bark, and miscellaneous components, and each portion was weighed. The collected litter was composited by two seasonal inputs. The litter of the growing season was defi ned as 15 May - 24 September 2005, and the litter of the later season was defi ned as 24 September 2005 - 12 May 2006. Leaf litter collected in the heavi-est litterfall season (November and early De-cember) was ground in a Wiley mill, using a 40-mesh stainless steel sieve for the chemical analysis. The nutrients (N, P, K, Ca, Mg) in
Stand characteristics of various compound ratios of fertilizer and control treatments in the saw-tooth oak stands (n = 3)
Table 1
Note. Values in parentheses are one stand error. Treatment Tree density
(trees ha-1)
Mean DBH (cm)
Mean height (m)
Basal area (m2 ha-1)
Soil characteristics of various compound ratios of fertilizer and control treatments in the sawtooth oak stands (n = 3)
Table 2
Note. Values in parentheses are one stand error Treatment Horizon Year Soil
pH Organic matter (%) Total nitrogen (%) Avail. phosphorus
(mg kg-1)
Exchangeable (cmolc kg-1)
K+ Na+ Ca2+ Mg2+
N0P0K0 A 2002 5.94 (0.27) 5.63 (0.35) 0.37 (0.04) 4.84 (1.04) 1.30 (0.10) 0.12 (0.01) 7.00 (2.55) 1.97 (0.25) 2005 5.79 (0.20) 5.31 (0.63) 0.33 (0.04) 12.58 (4.14) 0.94 (0.17) 0.11 (0.01) 7.73 (1.32) 1.97 (0.18) B 2002 5.67 (0.28) 4.58 (1.31) 0.28 (0.07) 4.19 (0.16) 0.99 (0.14) 0.12 (0.01) 6.89 (4.50) 1.19 (0.15) 2005 5.62 (0.21) 4.09 (0.80) 0.24 (0.04) 8.45 (4.40) 0.73 (0.14) 0.12 (0.01) 6.98 (2.23) 1.46 (0.20)
N3P4K1 A 2002 5.29 (0.01) 3.56 (0.70) 0.23 (0.04) 9.81 (2.35) 0.85 (0.14) 0.08 (0) 2.68 (0.66) 0.96 (0.12) 2005 5.25 (0.02) 4.50 (0.57) 0.21 (0.03) 58.92 (37.15) 0.82 (0.07) 0.07 (0.006) 3.98 (0.63) 1.14 (0.11) B 2002 5.37 (0.28) 3.52 (0.12) 0.21 (0.01) 8.83 (1.50) 0.69 (0.16) 0.09 (0.01) 2.69 (1.30) 1.42 (0.47) 2005 5.26 (0.14) 3.38 (0.24) 0.21 (0.02) 33.8 (16.6) 0.62 (0.08) 0.07 (0.01) 2.27 (0.61) 1.05 (0.27)
N6P4K1 A 2002 5.70 (0.25) 4.29 (0.62) 0.26 (0.04) 9.35 (2.40) 1.22 (0.10) 0.10 (0) 5.60 (2.02) 1.63 (0.25) 2005 5.52 (0.15) 4.49 (0.47) 0.26 (0.02) 79.6 (46.2) 1.06 (0.11) 0.07 (0.009) 5.18 (1.10) 1.52 (0.14) B 2002 5.39 (0.14) 2.95 (0.38) 0.19 (0.02) 4.91 (0.94) 0.87 (0.11) 0.09 (0.01) 2.82 (0.94) 1.06 (0.09) 2005 5.36 (0.07) 3.66 (0.37) 0.21 (0.02) 47.1 (27.1) 0.84 (0.06) 0.08 (0.007) 3.73 (0.63) 1.13 (0.07)
N2P2K1 A 2002 5.25 (0.10) 3.46 (0.34) 0.21 (0.02) 6.19 (0.51) 0.80 (0.03) 0.12 (0) 3.19 (0.95) 0.85 (0.09) 2005 5.18 (0.12) 3.77 (0.29) 0.22 (0.01) 7.00 (0.72) 0.83 (0.10) 0.11 (0.01) 4.60 (1.61) 1.24 (0.31) B 2002 5.31 (0.09) 1.92 (0.32) 0.13 (0.02) 4.05 (1.38) 0.64 (0.08) 0.13 (0.01) 1.46 (0.42) 0.52 (0.13) 2005 5.17 (0.10) 2.34 (0.29) 0.14 (0.01) 10.54 (4.11) 0.56 (0.06) 0.10 (0.01) 1.87 (0.38) 0.58 (0.08)
N3P8K1 A 2002 5.99 (0.17) 2.48 (1.65) 0.16 (0.08) 7.83 (2.58) 1.00 (0.02) 0.12 (0) 4.17 (1.50) 1.33 (0.16) 2005 5.97 (0.90) 5.61 (0.33) 0.33 (0.04) 159.1 (86.4) 1.17 (0.09) 0.09 (0.01) 8.65 (1.08) 2.01 (0.14) B 2002 5.99 (0.19) 2.48 (0.10) 0.16 (0.01) 7.83 (1.79) 1.00 (0.06) 0.12 (0.02) 4.17 (0.50) 1.33 (0.09) 2005 5.65 (0.17) 2.97 (0.30) 0.20 (0.02) 62.4 (26.6) 0.84 (0.08) 0.09 (0.02) 4.31 (0.31) 1.17 (0.09)
the leaf litter were analyzed by the method de-scribed by the National Institute of Agriculture Science and Technology (2000).
Fresh green leaf samples used to measure the nutrient response of the leaves at various com-pound ratios of fertilizer were collected at the end of the growing season (24th September, 2005). The leaf samples were collected from the mid-crown of two dominant trees in each treatment plot. The samples were transported to the laboratory and oven-dried at 65°C for 48 hours. The dried leaf samples were ground in a Wiley mill to pass through a 40-mesh stainless steel sieve for the chemical analysis. The sea-sonal nutrient concentrations were multiplied by the mass of the seasonal litter fall to provide the relevant total nutrient values. The nutrient use effi ciency was defi ned as the ratio of the dry matter to the nutrient content of the leaf litter (Vitousek 1982). The nutrient resorption effi ciency between the green leaves and leaf litter was calculated as:
Nutrient resorption effi ciency = Nutrientgreen
leaf – Nutrient leaf litter / Nutrient green leaf × 100 All data were evaluated by analysis of co-variance (Milliken & Johnson 2002) with the General Linear Models procedure in SAS (SAS Institute Inc. 2003). The basal area of each treatment plot was considered to be a possible covariate in the analysis. When signifi cant dif-ferences at P < 0.05 occurred, a comparison of the treatment means was performed using least squares means and P-values (Milliken & Johnson 2002).
Results
Litter fall
The litter fall production in the growing sea-son and late seasea-son varied signifi cantly (P < 0.05) among the various compound ratios of fertilizer. The leaf litter in the growing season
was signifi cantly higher in the N3P8K1 treat-ment than in the other ratios of fertilizer or N0P0K0 treatments (Table 3), but the leaf litter in the late season was signifi cantly lower in the N3P8K1 and N2P2K1 treatments than in the other ratios of fertilizer or N0P0K0 treatments. The total leaf litter showed a similar trend, with the lowest values occurring in the N3P8K1 treat-ment, which involved the lowest stand basal area or tree density compared with the other treatments (Table 1).
Nutrient concentration and content of green leaves and leaf litter
Nutrient concentrations within the green leaves and leaf litter differed signifi cantly (P < 0.05) with the application of varying amounts of fertilizer (Table 4). The N concentration of the green leaves was shown to be signifi -cantly higher in the fertilizer (N3P4K1,N6P4K1, N3P8K1) treatments than in the N0P0K0 treat-ment, but the N concentration did not differ signifi cantly among the various N ratios of the fertilization treatments, such as the N3P4K1, N6P4K1 and N2P2K1 treatments.
The P concentrations in the green leaves and leaf litter were signifi cantly different among the fertilizer treatments. The highest concentration of P was found in the highest dose (N3P8K1) of P fertilizer (Table 4). Similarly, the K con-centration in the green leaves was the highest concentration in the highest dose of K fertilizer (N3P4K2), whereas that of the leaf litter was the lowest concentration in the ratios of the fertil-izer.
The nutrient (N, P, K, Ca, Mg) content by the total leaf litter fall was signifi cantly differ-ent at the various compound ratios of fertilizer. The nutrient content by the leaf litter fall was
closely related to change in the leaf litter fall amounts rather than the various compound ra-tios of the fertilizer treatments (Table 5). Litter fall production in the growing and late seasons for various compound ratios of fertilizer and control treatments in the sawtooth oak stands (n = 9)
Table 3
Note. Values in parentheses are one stand error. Different letters in each column indicate a signifi cant difference at P < 0.05 among the treatments.
Season Treatment
Litter component (kg ha-1year-1)
Leaf Bark Branch Flower Acorn and cup Miscella-neous Total litter fall Growing season
N0P0K0 96.8 (9.7)b 4.3 (1.5)ab 270.2 (50.9)b 46.7 (9.7)b 3.5 (2.3)b 289.4 (21.4)bc 710.9 (63.9)bc
N3P4K1 91.8 (4.1)bc 0.0 (0.0)b 660.3 (84.0)a 113.7 (20.8)a 0.0 (0.0)b 337.0 (17.5)b 1,202.8 (111.6)a
N6P4K1 73.0 (4.4)bc 48.1 (18.4)a 240.8 (53.5)b 51.3 (2.8)b 0.0 (0.0)b 300.8 (11.4)bc 714.0 (65.2)b
N2P2K1 66.8 (3.4)c 12.1 (11.0)ab 380.4 (119.2)ab 43.9 (2.5)b 0.0 (0.0)b 330.8 (5.7)bc 834.0 (120.7)ab
N3P8K1 180.4 (32.1)a 33.6 (16.6)ab 189.6 (38.1)b 39.1 (4.0)b 9.0 (1.8)a 241.2 (13.3)c 692.8 (49.4)c
N3P4K2 84.8 (5.2)b 0.7 (0.3)b 459.6 (176.7)ab 149.1 (21.6)a 1.0 (1.0)b 514.5 (42.7)a 1,209.5 (195.7)a Late season
N0P0K0 3,120.8 (241.2)b 13.3 (5.8)a 573.9 (121.5)a 130.1 (22.8)a 136.6 (52.4)ab 491.3 (89.5)ab 4,466.0 (254.6)ab
N3P4K1 3,293.2 (165.7)ab 45.7 (34.2)a 269.6 (52.3)a 126.1 (9.3)a 120.8 (49.8)ab 362.5 (35.3)ab 4,218.0 (197.9)ab
N6P4K1 3,277.4 (117.1)ab 12.8 (5.7)a 610.1 (269.2)a 112.5 (9.3)a 79.2 (30.3)b 389.8 (28.3)ab 4,481.9 (304.4)ab
N2P2K1 2,823.7 (138.6)c 11.7 (6.3)a 350.5 (131.1)a 114.9 (11.6)a 97.8 (33.6)ab 548.4 (55.3)a 3,947.0 (257.0)b
N3P8K1 2,560.7 (66.0)c 76.4 (40.7)a 292.8 (108.7)a 119.7 (26.0)a 65.8 (17.7)b 358.7 (36.3)b 3,474.0 (158.7)b
N3P4K2 3,338.6 (142.6)a 10.9 (4.0)a 654.4 (280.3)a 143.6 (7.6)a 239.2 (67.2)b 407.5 (45.5)ab 4,794.4 (356.6)a Total
N0P0K0 3,217.6 (248.1)ab 17.6 (6.3)ab 844.1 (138.4)ab 176.8 (22.9)b 140.1 (52.3)ab 780.7 (102.9)ab 5,176.9 (280.6)b
N3P4K1 3,385.1 (168.8)ab 45.7 (34.2)ab 929.9 (97.0)ab 239.8 (17.4)ab 120.8 (49.79)ab 699.5 (38.4)bc 5,420.8 (224.8)ab
N6P4K1 3,350.4 (118.4)ab 60.9 (21.9)ab 850.9 (290.8)ab 163.9 (10.62)c 79.2 (30.3)b 690.5 (28.3)bc 5,195.8 (348.3)b
N2P2K1 2,890.6 (140.6)b 23.8 (11.3)ab 730.9 (157.5)ab 158.8 (11.67)c 97.8 (33.6)ab 879.2 (54.7)ab 4,781.1 (303.3)bc
N3P8K1 2,741.1 (78.1)b 109.9 (45.9)a 482.4 (129.4)b 158.8 (27.6)c 74.8 (17.0)b 600.0 (32.2)c 4,166.9 (182.8)c
Nutrient concentrations of the green leaves and leaf litters between various compound ratios of fertilizer and control treatments in the sawtooth oak stands (n = 9)
Table 4
Note. Values in parentheses are one stand error. Different letters in each column indicate a signifi cant difference at P < 0.05 among the treatments.
Leaf
component Treatment
Nutrient (%)
N P K Ca Mg
Green leaf
N0P0K0 1.50 (0.01)b 0.08 (0.01)b 1.02 (0.03)b 0.77 (0.03)a 0.19 (0.01)a
N3P4K1 2.13 (0.15)a 0.10 (0.01)ab 1.22 (0.05)ab 0.47 (0.01)b 0.19 (0.01)a
N6P4K1 1.98 (0.09)a 0.09 (0.01)b 1.17 (0.03)ab 0.66 (0.06)a 0.15 (0.01)a
N2P2K1 1.82 (0.08)ab 0.11 (0.01)ab 1.13 (0.03)b 0.69 (0.03)a 0.20 (0.01)a
N3P8K1 2.16 (0.13)a 0.13 (0.01)a 1.13 (0.03)b 0.77 (0.11)a 0.19 (0.05)a
N3P4K2 1.83 (0.20)ab 0.10 (0.01)ab 1.25 (0.08)a 0.62 (0.07)ab 0.12 (0.01)a
Leaf litter
N0P0K0 0.91 (0.01)a 0.04 (0.01)b 0.77 (0.03)a 1.20 (0.08)a 0.23 (0.01)a
N3P4K1 0.94 (0.02)a 0.06 (0.01)ab 0.63 (0.02)b 0.95 (0.01)b 0.22 (0.01)ab
N6P4K1 0.91 (0.05)a 0.05 (0.01)ab 0.69 (0.06)ab 1.00 (0.02)ab 0.21 (0.01)ab
N2P2K1 0.87 (0.03)a 0.05 (0.01)ab 0.67 (0.02)ab 1.10 (0.02)ab 0.23 (0.01)a
N3P8K1 0.99 (0.03)a 0.07 (0.01)a 0.67 (0.03)ab 1.00 (0.01)ab 0.19 (0.01)b
N3P4K2 0.94 (0.03)a 0.06 (0.01)ab 0.64 (0.02)b 1.20 (0.07)a 0.19 (0.01)b
Nutrient content by the leaf litter fall between the various compound ratios of the fertilizer and control treatments in the sawtooth oak stands (n = 9)
Table 5
Note. Values in parentheses are one stand error. Different letters in each column indicate a signifi cant difference at P < 0.05 among the treatments.
Season Treatment Nutrient (kg ha
-1year-1)
N P K Ca Mg
Growing season
N0P0K0 1.45 (0.21)b 0.08 (0.01)b 0.99 (0.17)a 0.74 (0.11)a 0.18 (0.03)a
N3P4K1 1.98 (0.27)ab 0.09 (0.01)b 1.12 (0.09)a 0.43 (0.04)a 0.18 (0.03)a
N6P4K1 1.47 (0.20)b 0.07 (0.02)b 0.85 (0.08)a 0.49 (0.08)a 0.11 (0.01)a
N2P2K1 1.21 (0.01)b 0.08 (0.01)b 0.75 (0.02)a 0.46 (0.01)a 0.14 (0.01)a
N3P8K1 3.77 (1.05)a 0.24 (0.07)a 2.08 (0.68)a 1.51 (0.61)a 0.39 (0.16)a
N3P4K2 1.53 (0.15)b 0.08 (0.01)b 1.06 (0.13)a 0.52 (0.07)a 0.10 (0.02)a
Late season
N0P0K0 28.21 (2.01)b 1.38 (0.04)b 23.70 (1.66)a 37.73 (4.76)ab 7.28 (0.23)a
N3P4K1 31.07 (2.76)ab 1.88 (0.20)ab 20.72 (1.28)ab 31.46 (1.91)ab 7.19 (0.43)a
N6P4K1 29.98 (2.71)ab 1.82 (0.17)ab 22.52 (1.45)ab 32.79 (0.70)ab 6.97 (0.14)a
N2P2K1 24.49 (0.74)b 1.43 (0.01)b 19.54 (1.29)ab 31.06 (1.45)ab 6.64 (0.54)a
N3P8K1 25.28 (0.76)ab 1.75 (0.08)ab 16.84 (0.62)b 25.46 (0.87)b 4.79 (0.47)b
N3P4K2 31.16 (0.69)a 2.00 (0.07)a 21.44 (1.00)ab 40.15 (3.96)a 6.30 (0.28)a
Total
N0P0K0 29.66 (2.20)ab 1.46 (0.06)ab 24.70 (1.84)a 38.48 (4.98)ab 7.47 (0.26)a
N3P4K1 33.05 (3.03)a 1.97 (0.21)a 21.84 (1.36)ab 31.88 (1.95)ab 7.37 (0.44)a
N6P4K1 31.44 (2.89)ab 1.89 (0.18)ab 23.37 (1.48)ab 33.28 (0.78)ab 7.08 (0.15)ab
N2P2K1 25.70 (0.75)b 1.51 (0.01)b 19.77 (1.35)ab 31.52 (1.45)ab 6.78 (0.55)ab
N3P8K1 29.05 (1.78)ab 1.99 (0.15)ab 18.92 (0.26)b 26.98 (1.08)b 5.18 (0.56)b
Nutrient use efficiency and nutrient resorp-tion efficiency of leaf litter
The nutrient use effi ciency of the leaf lit-ter could be lower in the fertilizer treatments than in the N0P0K0 treatment (Figure 1). For example, the fertilizer treatments had lower P use effi ciency (1,389 - 1,916) compared with the N0P0K0 (2,195) treatment (Figure 1). In contrast to P use effi ciency, the K and Mg use effi ciencies were higher in the fertilizer treat-ments than in the N0P0K0 treatment due to the low resorption effi ciency of this nutrient (Fig-ure 2). However, the N use effi ciency was not affected by the various compound ratios of the fertilizer treatments.
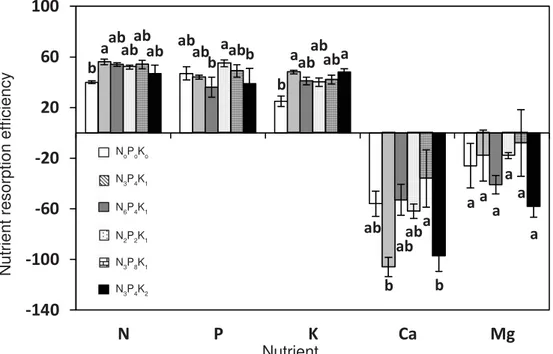
The nutrient resorption effi ciency between the green leaves and leaf litter was unaffected by the various compound ratios of fertilizer for all nutrients, except for P and K (Figure 2). However, the N and K resorption effi ciencies were generally higher in the fertilizer treat-ments than in the N0P0K0 treatment. The P re-sorption effi ciency was the highest in the low-dose P fertilization ratio (N2P2K2) compared with the other compound ratios of fertilizer. The Ca resorption effi ciency was signifi cantly different where different ratios of fertilizer were applied, whereas the Mg resorption effi -ciency was not signifi cantly different between the various compound ratios of the fertilizer and N0P0K0 treatments (Figure 2).
Discussion
Litter fall
As growth and development in foliage follow-ing fertilizer application could be regulated by physiological responses such as uptake and allocation of carbon and nutrient in tree components (Gough et al., 2004), fertilization response potential can be estimated from in-crease of foliage biomass in tree levels. How-ever, the application of high doses of fertilizers
had little infl uence on the leaf mass of saw-tooth oak stands. For example, the similar pro-ductions of leaf litter fall at the various com-pound ratios of fertilizer (e.g., N3P4K1, N6P4K1, N3P4K2) and the N0P0K0 treatment could be due to the similar basal area or tree density in the treatments (Table 1) or to factors relating to canopy closure during the 5 years after the last thinning (2000). In addition, there were no signifi cant correlations (P > 0.05) between the leaf litter and stand basal area or tree density in this oak stand (Kim et al. 2008). The lack of signifi cant relationships between the leaf litter fall amounts and the various compound ratios of fertilizer could be due to the closed canopy in this mature oak stand because the annual leaf litter fall has been shown to remain relatively constant after canopy closure (Bray & Gorham 1964, Berg & Laskowski 2006). In contrast to this result, the leaf litter fall increased follow-ing fertilizer application in a eucalyptus forest in Australia (O’connell & Grove 1993) and in a sweetgum forest in the USA (Nelson et al. 1995). Furthermore, the leaf litter inputs in the sweetgum were higher at higher rates of fertil-ization (400 kg N ha-1) than lower rates (100 kg
N ha-1) (Nelson et al. 1995).
The total woody litter consisting of branches and bark was not signifi cantly different be-tween the fertilizer treatments and the N0P0K0 treatment, which could be explained due to the fact that woody litter inputs may be affected by additional environmental factors, such as storms or strong winds (Kim et al. 2011). The total amount of litter fall in this study was com-parable with the 5,671 kg ha-1 year-1of
35-year-old sawtooth oak stands (Mun & Joo 1994). Nutrient concentration and content of green leaves and leaf litter
concentrations were not affected by the vari-ous compound ratios of the fertilizer applied. A high concentration of N in the green leaves
is likely due to increased N uptake after the fertilizer treatments (Berg & Laskowski 2006), as tree species with high N availability tend to Nutrient use effi ciency by the leaf litter fall between various compound ratios of the fertilizer and control treatments in the sawtooth oak stands (n = 9). Vertical bars are one stand error. Different letters in each bar indicate a signifi cant difference at P < 0.05 among the treatments
Figure 1
Nutrient resorption effi ciency by leaf litter fall between various compound ratios of the fertilizer and control treatments in the sawtooth oak stands (n = 9). Vertical bars are one stand error. Differ-ent letters in each bar indicate a signifi cant difference at P < 0.05 among the treatments
Figure 2
Nutrient use ef
fi ciency
Nutrient resorption ef
fi ciency
Nutrient
a
a
b c
b
a
bc
a a
ab
a
b
ab
a
a
a
ab
ab b
b
a
c
ab
a
a
a
bc
ab c
a
0 500 1000 1500 2000 2500 3000
N P K Ca Mg
N0P0K0
N3P4K1
N6P4K1
N2P2K1
N2P8K1
N3P4K2
b
ab
b
ab
a
a ab a
b
a ab
b ab
ab
a
ab a ab
ab
a ab
ab
ab
a
a
ab b a
b
a
‐140
‐100
‐60
‐20 20 60 100
N P K Ca Mg
N0P0K0
N3P4K1
N6P4K1
N2P2K1
N2P8K1
N3P4K2 NoPoKo
Nutrient N3P4K1
N6P4K1
N2P2K1
N3P8K1
N3P4K2
NoPoKo
N3P4K1
N6P4K1
N2P2K1
N3P8K1
produce green leaves with high N concentra-tions (Sariyildiz & Anderson 2005). In contrast to the N concentration of green leaves, the N concentration within the leaf litter did not ap-pear to be affected by the fertilizer treatments, most likely because the N concentration in the leaf litter was controlled by such factors as the combined effect of the soil available N status, tree growth, climate factors and N resorption rates. In addition, the nutrient concentrations in the green leaves or leaf litter could be affect-ed by the diluting effect of leaf growth with increased nutrient supply levels.
The P concentration in the green leaves and leaf litter was also signifi cantly different among the fertilizer treatments, with the con-centration signifi cantly higher in the applica-tion of high doses of P (N3P8K1) than in that of the N0P0K0 treatment (Table 3). Generally, the P concentration in the leaves of broad-leaf trees was increased after P fertilizer applica-tion (O’Connell & Grove 1993), which can be attributed to the enhanced uptake and mineral-ization in the rhizosphere. Similarly, the high-est K concentration in the N3P4K2 treatments of green leaves could be directly related to the rates of K used in the applied fertilizers, whereas the low K concentration in the fertil-izer treatments of the leaf litter could be more withdrawn prior to leaf senescence or leached by rain from the tree canopy. For example, higher fl uxes of K in the throughfall were found at more fertile sites compared with sites with a poorer nutrient status (Hagen-Thorn et al. 2006). The varying compound ratios of fer-tilizer had minor effects on the Ca concentra-tions within the green leaves or leaf litter (Ta-ble 4). However, the lowest Ca concentration was observed in the N3P4K1 treatment, which might be attributed to the lowest Ca in the soil horizons (Table 2) because the soil nutrients have been shown to be positively correlated with the nutrient concentrations of the leaf lit-ter (Gower & Son 1992, Kim et al. 2005). The nutrient content by leaf litter fall at the various compound ratios of fertilizer
treat-ments (Table 5) corresponded to differences in the leaf litter amount or nutrient concentra-tions. The low N content in the N2P2K1 treat-ment can be attributed to the lower N con-centration compared with the other fertilizer treatments. However, the Ca and Mg content was closely related to the change in the leaf litter mass rather than to the Ca and Mg con-centrations within the leaf litter (Table 4). Nutrient use efficiency and nutrient resorp-tion efficiency of leaf litter
Nutrient use effi ciency is an effective index of nutrient availability and soil fertility, as plants with a lower nutrient status have a high nutrient use effi ciency (Vitousek 1982). The nutrient use effi ciency of the leaf litter could be lower in the fertilizer than in the N0P0K0 treatments, as the leaf litter accumulated higher levels of nutrients through fertilizer application. In ad-dition, the lowest P use effi ciency was exhib-ited for the highest dose of fertilizer, such as the N3P8K1 treatment. In contrast to the P use effi ciency (Figure 1), the K use effi ciency was higher in the fertilizer treatments than in the N0P0K0 treatment due to the low resorption ef-fi ciency of this nutrient (Figure 2) and may be partially explained by the difference in the in-herent soil nutrients rather than the subsequent fertilizer applications.
in the fertilizer treatments was unaffected by varying the compound ratios of P. The Ca re-sorption effi ciency was generally related to the inherent soil chemical properties rather than to the application level of the fertilizer. For ex-ample, the N3P4K1 treatment showed the high-est Ca resorption effi ciency with the lowhigh-est soil Ca, whereas the N3P8K1 treatment showed the lowest Ca resorption effi ciency with the high-est soil Ca (Table 2). Similarly, the lowhigh-est re-sorption of Mg in the N3P8K1 treatment could be attributed to the highest Mg in the soil hori-zons.
Conclusions
Growth characteristics, such as leaf litter fall, were not affected by various compound ratios of fertilizer, whereas the fertilizers with high doses of N or P produced high N or P concen-trations in the green leaves of a sawtooth oak. However, the nutrient concentration and con-tent in the leaf litter were barely affected by the various compound ratios of fertilizer. Nu-trient use and resorption effi ciencies are only weakly controlled by various compound ratios of fertilizer application, except for the highest dose of P fertilizer. The results indicate that the status of nutrient in green leaves was depended on fertilizer doses, although there was no clear effect on the litter fall or nutrient status in leaf litter at various compound ratios of fertilizer application.
Acknowledgements
This study was carried out with the partial sup-port of "Forest Science & Technology Projects (Project No. S211212L030320)" provided by Korea Forest Service.
References
Bauer G., Schulze E.-D, Mund M., 1997. Nutrient contents and concentrations in relation to growth of Picea ab-ies and Fagus sylvatica along a European transect. Tree Physiology 17: 777-786.
Berg B., Laskowski R., 2006. Litter decomposition; A guide to carbon and nutrient turnover. Advances Eco-logical Research38: 20-71.
Bray J.R., Gorham E., 1964. Litter production in forests of the world. Advances in Ecological Research 2: 101-157.
Byun J.K., Kim Y.S., Yi M.J. Son Y. Kim C., Jeong J.H., Lee C.Y., Jeong Y.H., 2006. Growth characteristics of
Pinus densifl ora, Larix leptolepis, Quercus acutissima, and Betula platyphylla var. japonica seedlings on dif-ferent fertilizer types and amount. Korean Journal of Forest Measurement 9: 132-14. (In Korean with English abstracts).
Gough C.M., Seiler J.R., Maier C.A., 2004. Short-term ef-fects of fertilization on loblolly pine (Pinus taeda L.) physiology. Plant, Cell and Environment 27: 876-886. Gower S.T., Son Y., 1992. Differences in soil and leaf
lit-terfall nitrogen dynamics for fi ve forest plantations. Soil Science Society of America Journal 56: 1959-1966. Finér L., 1996. Variation in the amount and quality of
lit-terfall in a Pinus sylvestris L. stand growing on bog. Forest Ecology and Management 80: 1-11.
Hagon-Thorn A., Varnagiryte I., Nihlgard B., Armolaitis K., 2006. Autumn nutrient resorption and losses in four deciduous forest tree species. Forest Ecology and Man-agement 228: 33-39.
Hwang J., Son Y., Kim C. Yi M.J., Kim Z.S., Lee W.K., Hong S.K., 2007. Fine root dynamics in thinned and limed pitch pine and Japanese larch plantations. Journal of Plant Nutrition 30: 1821-1839.
Joo J.S., Lee W.K., Kim T.H., Lee C.Y. Jin I.S., Park S.K., 1983. Studies on fertilization in pruning and thinning stands. The Research Report of Forestry Research Insti-tute 30: 155-189. (In Korean with English abstracts). Kim C., Koo K.S., Byun J.K., 2005. Litterfall and nutrient
dynamics in pine (Pinus rigida) and larch (Larix lepto-lepis) plantations. Journal of Korean Forest Society 94: 302-306.
Kim C., Park J.Y., Byun J.K., Jeong J.H., Shin H.C., Lee S.T., 2008. Relationships between litterfall amounts and stand attributes in a Quercus accutissima stand. Korean Journal of Agriculture and Forest Meteorology 10: 102-106. (In Korean with English abstracts).
Kim C., Jeong J., Kim J.S., 2011. Carbon and nitrogen inputs by litter fall in fertilized and unfertilized larch plantations. Forest Science and Technology 7: 7-22. Laclau J.P., Almeida J.C.R., Gonçalves J.L.M.,
114-124.
Milliken G.A., Johnson D.E., 2002. Analysis of Messy Data, Volume III: Analysis of Covariance. Chapman & Hall/CRC, USA. 605 p.
Mun H.T., Joo H.T., 1994. Litter production and decompo-sition in the Quercus acutissima and Pinus rigida for-est. Korean Journal of Ecology 17: 345-353. (In Korean with English abstracts).
Nambiar E.K.S., Fife D.N., 1991. Nutrient retranslocation in temperate conifers. Tree Physiology 9: 185-207. National Institute of Agricultural Science and
Technol-ogy, 2000. Methods of Soil Chemical Analysis. Sammi Press, Suwon, Korea. 202 p. (In Korean).
Nelson L.E., Shelton, M.G., Switzer G.L., 1995. The infl u-ence of nitrogen applications on the resorption of foliar nutrients in sweetgum. Canadian Journal of Forest Re-search 25: 298-306.
O'connell A.M., Grove T.S. 1993. Infl uence of nitrogen and phosphorus fertilizers on amount and nutrient con-tent of litterfall in a regrowth eucalypt forest. New For-ests 7: 33-47.
Park J., Kim C., Jeong J, Byun J.K., Son Y., Yi M.J., 2008. Effect of fertilization on litterfall amounts in a Quercus acutissima stand. Journal of Korean Forest Society 97: 582-588. (In Korean with English abstracts).
Sariyildiz T., Anderson J.M., 2005. Variation in the chemi-cal composition of green leaves and leaf litters from three deciduous tree species growing on different soil
types. Forest Ecology and Management 210: 303-319. SAS Institute Inc., 2003. SAS/STAT Statistical Software.
Version 9.1. SAS publishing Cary, NC., USA.
Smaill S.J., Clinton P.W., Greenfi eld L.G., 2008. Nitrogen fertilizer effects on litter fall, FH layer and mineral soil characteristics in New Zealand Pinus radiata planta-tions. Forest Ecology and Management 256: 564-569. Smith C.T., Lowe A.T., Skinner M.F., Beets P.N.,
Schoen-holts S.H., Fang S., 2000. Response of radiata pine forests to residue management and fertilization across a fertility gradient in New Zealand. Forest Ecology and Management 138: 203-223.
Son Y., Lee M.H., Noh N.J., Kang B.O., Kim K.O., Yi M.J., Byun J.K., 2007. Fertilization effects on under-story vegetation biomass and structure in four differ-ent plantations. Journal of Korean Forest Society 96: 520-527.
Tausz M., Trummer W., Wonisch A., Goessler W., Grill D., Jiménez, M.S., Morales D., 2004. A survey of foliar mineral nutrient concentrations of Pinus canariensis at fi eld plots in Tenerife. Forest Ecology and Management 189: 49-55.
Vitousek P., 1982. Nutrient cycling and nutrient use ef-fi ciency. American Naturalist 119: 553-572.
Weetman G.F., Wells C.G., 1990. Plant analyses as an aid in fertilizing forests. In: Westerman R.L., (ed.), Soil Testing and Plant Analysis, 3rd ed. SSSA, USA. pp.