RESEARCH ARTICLE
Elevated Sodium and Dehydration Stimulate
Inflammatory Signaling in Endothelial Cells
and Promote Atherosclerosis
Natalia I. Dmitrieva*, Maurice B. Burg
National Heart, Lung, and Blood Institute, National Institutes of Health, Bethesda, Maryland, United States of America
Abstract
Cardiovascular diseases (CVDs) are a leading health problem worldwide. Epidemiologic studies link high salt intake and conditions predisposing to dehydration such as low water intake, diabetes and old age to increased risk of CVD. Previously, we demonstrated that el-evation of extracellular sodium, which is a common consequence of these conditions, stim-ulates production by endothelial cells of clotting initiator, von Willebrand Factor, increases its level in blood and promotes thrombogenesis. In present study, by PCR array, using human umbilical vein endothelial cells (HUVECs), we analyzed the effect of high NaCl on 84 genes related to endothelial cell biology. The analysis showed that the affected genes regulate many aspects of endothelial cell biology including cell adhesion, proliferation, leu-kocyte and lymphocyte activation, coagulation, angiogenesis and inflammatory response. The genes whose expression increased the most were adhesion molecules VCAM1 and E-selectin and the chemoattractant MCP-1. These are key participants in the leukocyte adhe-sion and transmigration that play a major role in the inflammation and pathophysiology of CVD, including atherosclerosis. Indeed, high NaCl increased adhesion of mononuclear cells and their transmigration through HUVECs monolayers. In mice, mild water restriction that elevates serum sodium by 5 mmol/l, increased VCAM1, E-selectin and MCP-1 expres-sion in mouse tissues, accelerated atherosclerotic plaque formation in aortic root and caused thickening or walls of coronary arteries. Multivariable linear regression analysis of clinical data from the Atherosclerosis Risk in Communities Study (n=12779) demonstrated that serum sodium is a significant predictor of 10 Years Risk of coronary heart disease. These findings indicate that elevation of extracellular sodium within the physiological range is accompanied by vascular changes that facilitate development of CVD. The findings bring attention to serum sodium as a risk factor for CVDs and give additional support to recom-mendations for dietary salt restriction and adequate water intake as preventives of CVD.
a11111
OPEN ACCESS
Citation:Dmitrieva NI, Burg MB (2015) Elevated Sodium and Dehydration Stimulate Inflammatory Signaling in Endothelial Cells and Promote Atherosclerosis. PLoS ONE 10(6): e0128870. doi:10.1371/journal.pone.0128870
Academic Editor:Giuseppe Danilo Norata, University of Milan, ITALY
Received:December 1, 2014
Accepted:May 3, 2015
Published:June 4, 2015
Copyright:This is an open access article, free of all copyright, and may be freely reproduced, distributed, transmitted, modified, built upon, or otherwise used by anyone for any lawful purpose. The work is made available under theCreative Commons CC0public domain dedication.
Data Availability Statement:All relevant data are within the paper.
Funding:The study was supported by the Intramural Program of National Lung Heart and Blood Institute.
Introduction
Cardiovascular diseases (CVDs) are a leading health problem worldwide.[1,2] Epidemiologic studies link high salt intake and conditions predisposing to dehydration, such as low water in-take, diabetes and old age to increased risk of CVD [3–7]. The underlying mechanisms are not fully understood. A common consequence of these conditions is elevation of plasma sodium. [4,8–12] Sodium (Na+) and chloride (Cl-) are the major electrolytes in plasma and extracellu-lar fluids. Their concentration is maintained within narrow range by osmoregulation. Normal plasma sodium concentration in the general population varies between 134 and 148 mmol/l. [13–15] During hypernatremia plasma sodium concentration increases beyond the normal range, and it can reach 160 mmol/l or higher in cases of severe life threatening hypernatremia [12]. Elevation of plasma sodium within or above the normal range is a common consequence of dehydration [9,12], high salt consumption [10,16], and conditions affecting water/salt bal-ance [8,11,12,17]. Since all of these conditions are associated with increased risk of CVDs [3–7,18], we hypothesized that direct effects of elevated sodium on endothelium might be a contributing factor.
The known mechanisms underlying the pathology of cardiovascular diseases such as athero-sclerosis, coronary heart disease (CHD) and stroke involve a complex interplay of inflamma-tion and coagulainflamma-tion [19–21] of which endothelial cells are major regulators. Resting endothelial cells inhibit thrombosis and inflammation by releasing anti-coagulants and sup-pressing release of pro-coagulants and inflammatory mediators. Endothelial activation, leading to release of mediators of coagulation and inflammation and increased adhesiveness of leuko-cytes, is implicated in pathophysiology of CVD.[22,23]
There are indications that minor elevations of extracellular sodium may have adverse ef-fects, leading to clinically relevant consequences. Thus, increase in the sodium concentration of the culture medium within physiological range stiffens endothelial cells, reduces nitric oxide re-lease [24,25] and leads to hardening and flattering of endothelial glycocalyx (eGC) [25] which is a major modulator of endothelial cells functions. [26] High sodium also potentiates pro-inflammatory effects of TNFαand of non-uniform shear stress.[27] Our recent finding that minor elevations of extracellular sodium upregulate expression and secretion of a key initiator of blood clotting, von Willebrand Factor (vWF) in endothelial cells also supports this hypothe-sis [28]. It has been recently shown that plasma sodium does not vary randomly, but is charac-teristic of individuals that depends on long-term life style, health status or genetically defined factors [29], indicating that it could affect long-term health. Indeed, in multivariable regression analysis of clinical data from the Atherosclerosis Risk in Communities Study, serum sodium significantly contributes to prediction of the blood level of vWF and the 10 years Risk of Stroke [28]. In addition, it has been recently demonstrated that higher levels of plasma sodium are as-sociated with higher risk of mortality in a healthy population.[14]
Results
Elevation of extracellular NaCl upregulates pro-inflammatory mediators
in endothelial cells in culture and increases their adhesive properties
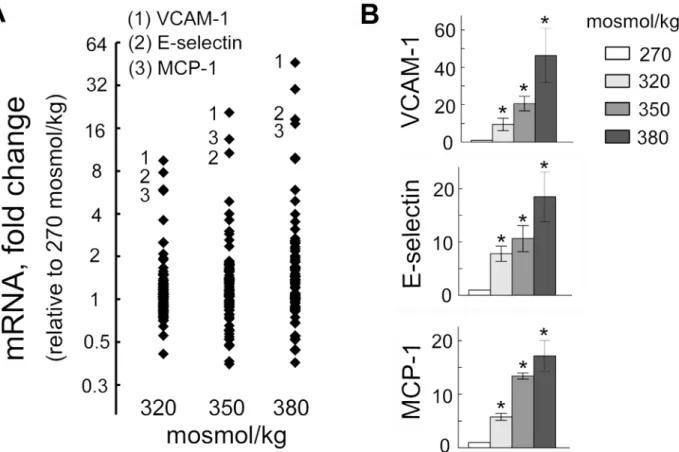
To assess effect of elevated NaCl on endothelial cells, we used a PCR array to analyze the effect of high NaCl on 84 genes related to endothelial cell biology (Fig 1,Table 1). We exposed HUVEC cells grown on cell culture dishes to different levels of NaCl for 4 days. The genes whose expression increased or decreased at least two-fold are listed onTable 1. To get an initial insight to what functions of endothelial cells might be affected by changes in expression of these genes, we used the DAVID Gene Functional Classification Tool [30]. The analysis showed that the affected genes regulate many aspects of endothelial cell biology as well as their interaction with blood cells. Thus, changes in expression of those genes affects cell migration, cell adhesion, proliferation, leukocyte and lymphocyte activation, apoptosis, hemopoiesis, co-agulation, angiogenesis and inflammatory response (Table 1). Since disregulation of these functions is often involved in pathological processes like inflammation, vascular wall remodel-ing and thrombosis [31], we next tested if high NaCl causes such functional consequences, fo-cusing on inflammation. The three genes that showed biggest increase were the adhesion molecules VCAM-1 and E-selectin and the chemokine, MCP1 (Fig 1). These molecules are key
Fig 1. Elevation of extracellular NaCl increases expression of pro-inflammatory mediators in endothelial cells.HUVECs were exposed to media in which NaCl was elevated for 4 days from 270 mosmol/kg to the total osmolality indicated in the figure panels. mRNA for 84 genes was measured by real-time PCR as described in Methods.(A)mRNA of adhesion molecules VCAM-1, E-selectin and of chemokine MCP-1 showed biggest increase upon exposure to high NaCl. The graph plots fold changes relative to 270 mosmol/kg of mRNA for 84 genes related to endothelial cell biology. Each dot shows mean value from 3 independent experiments.(B)Statistical analysis for VCAM-1, E-selectin and MCP-1 (mean±SEM,*P<0.05, N = 3)
doi:10.1371/journal.pone.0128870.g001
players in leukocyte adhesion and transmigration, which are hallmarks of inflammation [32]. During their inflammatory activation, endothelial cells express the adhesion molecules on their plasma membrane and secrete chemokines and cytokines. MCP-1 is a chemokine that activates monocytes, facilitating their capture by adhesion molecules and their transmigration through the endothelium into tissues [32,33].
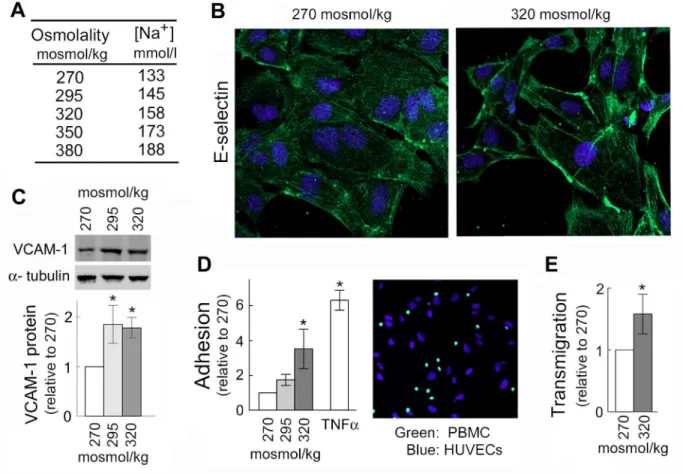
To test whether high NaCl-induced expression of VCAM-1, E-selectin and MCP-1 affects adhesive properties of endothelial cells, we analyzed effects of high NaCl on adhesion of pe-ripheral blood mononuclear cells (PBMC) to HUVECs and on their transmigration through HUVEC monolayers. In these experiments, we added NaCl to the cell culture medium to ele-vate sodium over a range of blood sodium from the lower end of the normal range (133 mmol/ l) up to extreme hypernatremia (160 mmol/l) (Fig 2A). Indeed, consistent with the increased mRNA of the adhesion molecules (Fig 1), exposure of HUVECs to high NaCl elevates E-selectin protein in the plasma membrane (Fig 2B), increases VCAM-1 protein level (Fig 2C), increases adhesion of peripheral blood mononuclear cells (PBMC) to HUVECs (Fig 2D) and
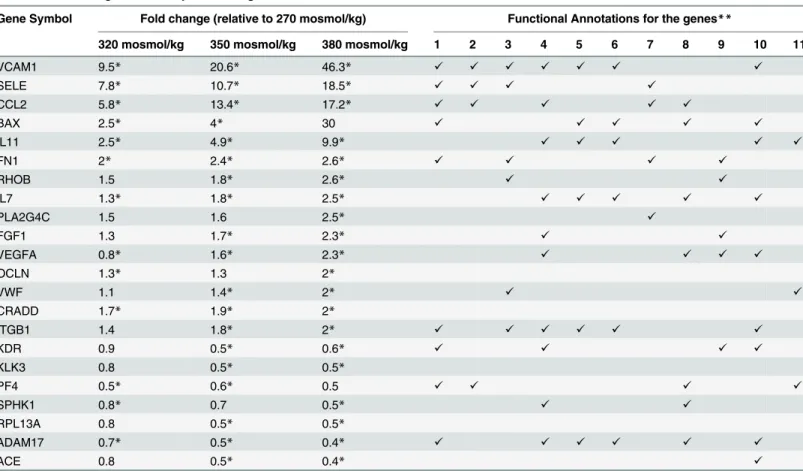
Table 1. Effect of high NaCl on expression of genes related to endothelial cell function in cultured HUVEC cells.
Gene Symbol Fold change (relative to 270 mosmol/kg) Functional Annotations for the genes**
320 mosmol/kg 350 mosmol/kg 380 mosmol/kg 1 2 3 4 5 6 7 8 9 10 11
VCAM1 9.5* 20.6* 46.3* ✓ ✓ ✓ ✓ ✓ ✓ ✓
SELE 7.8* 10.7* 18.5* ✓ ✓ ✓ ✓
CCL2 5.8* 13.4* 17.2* ✓ ✓ ✓ ✓ ✓
BAX 2.5* 4* 30 ✓ ✓ ✓ ✓ ✓
IL11 2.5* 4.9* 9.9* ✓ ✓ ✓ ✓ ✓
FN1 2* 2.4* 2.6* ✓ ✓ ✓ ✓
RHOB 1.5 1.8* 2.6* ✓ ✓
IL7 1.3* 1.8* 2.5* ✓ ✓ ✓ ✓ ✓
PLA2G4C 1.5 1.6 2.5* ✓
FGF1 1.3 1.7* 2.3* ✓ ✓
VEGFA 0.8* 1.6* 2.3* ✓ ✓ ✓ ✓
OCLN 1.3* 1.3 2*
VWF 1.1 1.4* 2* ✓ ✓
CRADD 1.7* 1.9* 2*
ITGB1 1.4 1.8* 2* ✓ ✓ ✓ ✓ ✓ ✓
KDR 0.9 0.5* 0.6* ✓ ✓ ✓ ✓
KLK3 0.8 0.5* 0.5*
PF4 0.5* 0.6* 0.5 ✓ ✓ ✓ ✓
SPHK1 0.8* 0.7 0.5* ✓ ✓
RPL13A 0.8 0.5* 0.5*
ADAM17 0.7* 0.5* 0.4* ✓ ✓ ✓ ✓ ✓ ✓
ACE 0.8 0.5* 0.4* ✓
The Human Endothelial Cell Biology PCR Array was used to determine relative changes in expression of 84 genes caused by increasing NaCl in the cell culture medium. The table includes those genes whose expression increased or decreased significantly more than 2-fold following increase in extracellular NaCl and lists the functional gene ontology (GO) categories to which these genes belong.
*Change is significant with P<0.05, n = 3
**Gene Ontology (GO) terms associated with the genes: 1) cell migration; 2) leukocyte migration; 3) cell adhesion; 4) stimulation of proliferation; 5) Leukocyte activation; 6) lymphocyte activation; 7) inflammatory response; 8) negative regulation of apoptosis; 9) angiogenesis; 10) hematopoiesis; 11) coagulation. The analysis was done with the DAVID Functional Annotation Tool.
increases transmigration of PBMC through HUVEC monolayers (Fig 2E). These results indi-cate that elevation of extracellular NaCl over the range that occurs in humans increases the ad-hesive properties of endothelial cells suggesting that elevated NaCl can initiate inflammation.
Water restriction activates pro-inflammatory signaling in tissues and
accelerates atherosclerosis in mice
Having found that elevations of NaCl increase expression of VCAM-1, E-selectin and MCP-1, leading to increased adhesive properties of endothelial cells in culture, we next tested whether increase of serum sodium has similar effects in vivo.
We controlled the amount of water that the mice consumed by feeding them with gel food containing 30% water, as their only source of water intake or, as a control, feeding the same food, but with free access to drinking water [28]. We previously showed that such water
Fig 2. Elevation of NaCl in cell culture medium promotes adhesion of peripheral blood mononuclear cells (PBMC) to HUVECs and their transmigration through HUVEC monolayer.HUVECs were exposed to media in which NaCl was elevated for 4 days from 270 mosmol/kg to the total osmolality indicated in the figure panels. (A) The table shows sodium concentrations in culture medium of different osmolarities used in experiments shown on Figs1and2. Note, that blood sodium range 135–145 mmol/l is considered normal; up to 160 mmol/l can be seen in people without symptoms (12); and higher levels are seen only in cases of severe hypernatremia in critically ill patients. (B) High NaCl increases E-selectin, a mediator for PBMC adhesion, in plasma membrane of HUVECs (representative IF image: green (Alexa488)—E-selectin, blue—cell nuclei stained with DAPI). (C) High NaCl increases VCAM-1 protein.Upper Panel: Representative Western Blot.Lower Panel: Quantification, relative to 270 mosmol/kg, normalized to tubulin (mean±SEM, *P<0.05, t test, N = 3). (D) Elevation of NaCl within physiological range causes graded increase of adhesive properties of HUVECs.Left panel: Quantification of adhesion. Data are plotted as number of PBMC adhered to 1000 HUVECs (mean±SEM,*P<0.05, N = 4, linearly dependent on NaCl concentration, P = 0.03). Note: Treatment with TNFα, known inducer of the adhesion was used as a positive control.Right panel: Representative image of stained cells used for the quantification of PBMC (green, calcein AM) attached to HUVECs (blue, DAPI). Seemethodsfor more details. (E) Exposure to elevated NaCl promotes transmigration of PBMC through HUVEC monolayer. Number of PBMC transmigrated in 6h was quantified relative to 270 mosmol/kg (mean±SEM,*P<0.05,
N = 3). Seemethodsfor more details.
doi:10.1371/journal.pone.0128870.g002
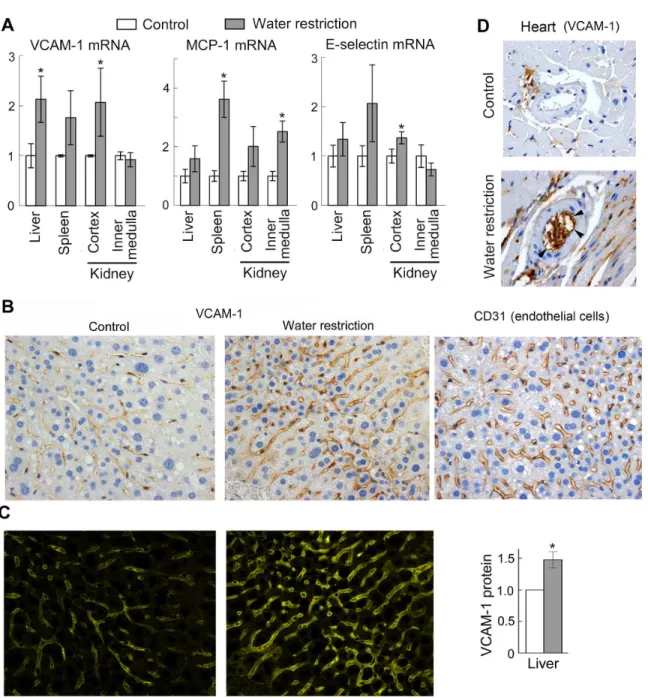
restriction increases serum sodium by about 5 mmol/l but does not cause weight loss, indicat-ing a very mild dehydration that could occur in everyday life. [28] Consistent with the cell cul-ture results, the mild dehydration increases VCAM-1, E-selectin and MCP-1 mRNA in several tissues (Fig 3A). We next confirmed by immunohistochemical staining of the liver and heart sections that VCAM-1 protein expression is increased in endothelial cells of the liver capillaries (Fig3Band3C), and coronary arteries (Fig 3D,S1 Fig) suggesting that the mild dehydration might be pro-inflammatory.
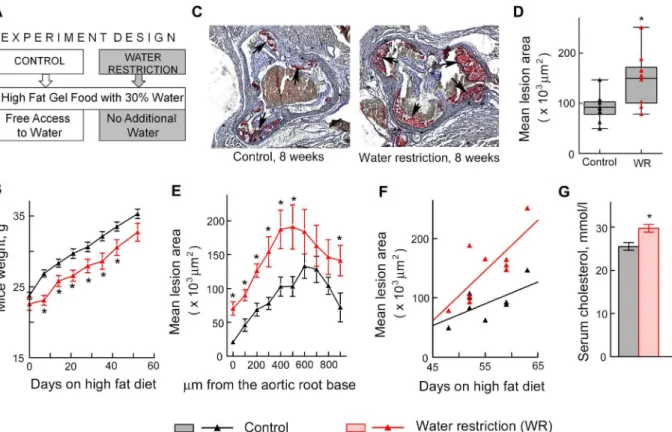
Since VCAM-1-facilitated recruitment of leukocytes from the circulation is an initial step in many inflammatory disorders, including atherosclerosis. [34–37], we hypothesized that water restriction might affect formation of atherosclerotic plaques. To test the effect of water restric-tion on development of atherosclerosis, we used apolipoprotein E knockout (ApoE-/-) mice. ApoE-/-mice have impaired clearance of plasma lipoproteins and develop atherosclerosis in a short time, making them a convenient model to assess impact of different factors. [38] We fed ApoE-/-mice a“western”diet containing 40% of calories from fat and analyzed effect of water restriction on size of atherosclerotic lesions in the aortic root (Fig 4). [39] To control water in-take, we fed mice with gel food made from the“western”diet and containing 30% of water. Control mice had free access to water (Fig 4A). Such water restriction did not cause severe de-hydration as judged from the weight of the mice. After transient growth retardation that lasted about 1 week, water restricted mice resumed growth at the same rate as the control group (Fig 4B). We analyzed atherosclerotic lesions in the aortic root after 7–9 weeks of water restriction. Consistent with our hypothesis that sodium-induced stimulation of inflammatory signaling and of the adhesive properties of the endothelium might accelerate atherosclerosis, water re-stricted mice developed larger atherosclerotic lesions in the aortic root (Fig4C–4F). Water re-striction also caused slight but significant increase in serum cholesterol (Fig 4G), which might be an additional factor contributing to the acceleration of development of atherosclerosis in water restricted ApoE-/-mice. [40] Additionally, water restriction caused thickening of the walls of coronary arteries in the ApoE-/-mice (Fig 5), which is considered as a risk factor for de-velopment of atherosclerosis and predicts future clinical cardiovascular disease events.[41,42]
Plasma sodium is positively associated with 10 Years Risk of coronary
heart disease (CHD) in Atherosclerosis Risk in Community (ARIC) Study
Fig 3. Water restriction activates pro-inflammatory signaling in mouse tissues.To elevate NaCl in vivo, mice were subjected to water restriction for 9 days. To limit the amount of water, mice were fed with gel food containing 30% water and were not given any additional water. Control group mice were fed the same gel food, but had free access to water. (A) Water restriction increases VCAM-1, MCP-1 and E-selectin mRNA in several tissues. Levels of the mRNA were measured by real-time PCR. Results are presented as mean±SEM,*P<0.05, N = 5. (B, C) Water restriction increases VCAM-1 protein in
endothelial cells in the liver. (B) Representative images from immunohistochemical staining for VCAM-1 protein and for endothelial cells marker CD31 (brown) in the liver tissue sections. Similar patterns of VCAM-1 and CD31 staining are consistent with endothelial expression of VCAM-1. (C) Quantification of VCAM-1 staining shown on B. Seemethodssection for more information about the quantification.Left panels. Images of extracted CMYK yellow channel from images shown on B. The pattern and intensity of the signal in the CMYK yellow channel corresponds to pattern and intensity to the brown
diaminobenzidine (DAB) staining of VCAM-1.Right panel. Result of the quantification (mean±SEM,*P<0.05, N = 4). (D) Representative images from immunohistochemical staining for VCAM-1 protein of heart sections. Positive staining of inner surface of coronary arteries of water restricted mice (shown by arrowheads) is consistent with endothelial expression of VCAM1. SeeS1 Figfor more images.
doi:10.1371/journal.pone.0128870.g003
defined as a validated definite or probable hospitalized MI, a definite CHD death, an unrecog-nized MI defined by ARIC ECG readings, or coronary revascularization. The criteria for defi-nite or probable hospitalized MI were based on combination of chest pain symptoms, ECG changes, and cardiac enzyme levels [44,47]
We reasoned that the estimated CHD Risk serves as an approximate measure of atheroscle-rosis burden, and we hypothesized that in line with the results of the mouse studies, plasma so-dium might affect atherosclerosis and therefore the risk of CHD. To assay if the concentration of serum sodium contributes to prediction of 10 Year Risk of CHD, we conducted multivari-able linear regression analysis. [48–51] The following variables from ARIC study were used: serum sodium (mmol/l), blood glucose (mmol/l) and 10 Year Risk of CHD (%). Descriptive statistics for the variables are shown onTable 2. We initially included all study participants. Only participants with missing data were removed from the analysis. Complete data were avail-able for 12779 participants. Distribution histograms for these variavail-ables are shown onFig 6A. For the multivariable analysis, we transformed the 10 Year Risk of CHD variable to make its distribution closer to normal (Fig 6A). Although distribution histograms are visually close to normal, none of them passed formal normality test. However, according to the central limit theorem, this requirement is waved for large sample size (greater than 100). [51]
Fig 4. Water restriction accelerates atherosclerosis in ApoE-/-mice.Mice were water restricted starting at 6 weeks of age for 7–9 weeks and atherosclerosis was analyzed in aortic root as described in methods. Data are presented as mean±SEM,*P<0.05, N = 9. (A) Experiment design. Water restricted mice were fed with gel food made from“western”diet containing 40% of calories from fat and 30% water and were not given any additional water. Control group were fed the same gel food, but had free access to water. (B) Water restricted mice grow at the same rate as controls after transient growth retardation. (C-F) Atherosclerotic lesions are larger in water restricted mice. (C) Representative images of frozen sections through aortic root in which lipids in the atherosclerotic lesions are stained in red with Oil Red O dye (shown by arrows). (D) The graph pots mean areas of the lesions on serial sections spanning approx. 900μm of the aortic root. The data are presented as a box-and-whisker plot (n = 9, t test, P = 0.01). (E) The graph plots mean areas of the lesions at different distances from the base of the aortic root. (F) Atherosclerotic lesions grow faster in water restricted mice as shown by steeper regression line on the scatterplot of mean lesion area vs time (seemethodsfor more details). (G) Serum cholesterol was measured after 6 weeks on high fat diet and
water restriction.
In the multivariable model, containing serum sodium and blood glucose as independent variables both variables significantly (P<0.001) contribute to the predicted 10 Year Risk of CHD (F(2, 12776) = 598, P<0.001) (Fig 6B,Table 3). The positive regression coefficient for serum Na+indicates that higher Na+is accompanied by increased 10 Year Risk of CHD,
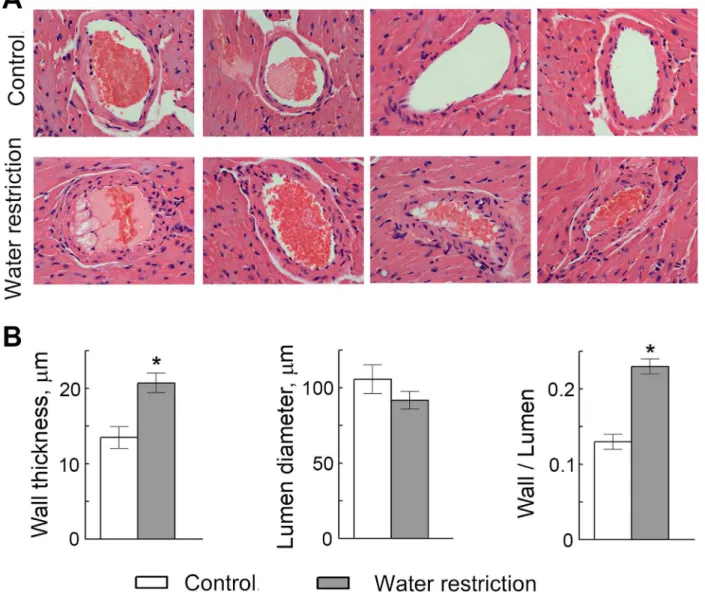
Fig 5. Water restriction causes thickening of the walls of coronary arteries in ApoE-/-mice.(A) Representative images from hematoxylin and eosin staining of heart sections showing coronary arteries. (B) Quantification of the arterial wall thickness, lumen diameter and wall thickness to lumen diameter ratio. Data are presented as mean±SEM,*P<0.05, N = 7.
doi:10.1371/journal.pone.0128870.g005
Table 2. Basic descriptive statistics for the variables used in analysis of the association between sodium and 10 Years Risk of CHD in the ARIC Study (N = 12779).
Mean Median Std Dev 5–95% Percentiles
Na+, mmol/l 141.0 141.0 2.4 137–145
Glucose, mmol/l 6.1 5.5 2.0 4.7–8.5
10 Years Risk of CHD, % 7.7 5.2 7.8 0.6–23.1
ln (10 Years Risk of CHD) 1.5 1.6 1.1 -0.5–3.1
doi:10.1371/journal.pone.0128870.t002
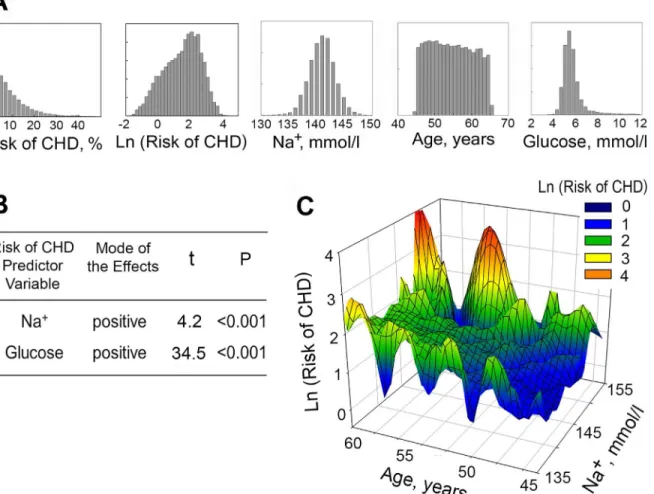
consistent with overall findings of our study. Additionally, a three-dimensional plot of 10 Year Risk of CHD level vs. serum sodium concentration and age demonstrates that participants with higher concentrations of serum sodium have higher Risk of CHD at all ages (Fig 6C).
To examine whether serum sodium and 10 years risk of CHD are still associated in different sub-groups within the study participants, we performed a similar analysis including only par-ticipants who took or did not take blood pressure medications, those with glucose level lower than 6.5 mmol/l and populations divided based on gender and race (Table 3). Serum sodium remained a significant predictor of CHD in people who did not take blood pressure medica-tions but became insignificant in people who took blood pressure medication. Analysis of blood pressure and 10 years risk of CHD in these groups showed that people who took blood pressure medications still had significantly higher blood pressure and risk of CHD (118 ± 17 vs 131 ± 20 mm Hg (mean ± SD, P<0.001) and 6.6 ± 6.9 vs 12.0 ± 9.7% (mean ± SD, P<0.001)), suggesting that factors other than sodium become stronger predictors in people with higher blood pressure and higher risk of CHD. Therefore we excluded people who took blood pressure medications from further analysis. Serum sodium remained a significant predictor in people with blood glucose concentration lower than 6.5 mmol/l, white men, white women and black
Fig 6. Plasma sodium is positively associated with 10 Years Risk of CHD in Atherosclerosis Risk in Community (ARIC) Study.(A, B) Multivariable linear regression analysis was used to assess effect of serum sodium on 10 Years Risk of CHD (N = 12779). (A) Distribution histograms for variables used in the analysis. (B) Overview of the results. The results demonstrate that serum Na+, as well as glucose, significantly contributes to predicting the Risk of CHD. See text andTable 2for details of the analysis. (C) 3D Mesh Plots, visualizing Ln(10 Years Risk of CHD), as functions of serum sodium concentration and age. At all ages, 10 Years Risk of CHD is increased in participants with higher levels of serum sodium.
men. That serum sodium is a significant predictor in multiple subsets of the general population supports the general validity of the model. [51]
Discussion
The present study addresses effects of small physiological elevations of extracellular sodium on the vascular endothelium and provides evidence supporting the hypothesis that pro-inflamma-tory changes produced by elevated sodium in endothelial cells might contribute to develop-ment of cardiovascular diseases.
In recent years experimental data have accumulated indicating that small alterations of ex-tracellular sodium can produce changes in the physiology of endothelial cells. Normal plasma sodium concentration in the general population varies between 134 and 148 mmol/l, roughly corresponding to blood osmolality between 280 and 310 mosmol/kg. [13–15] During hyperna-tremia plasma sodium can reach 160 mmol/l (about 330 mosmol/kg) without clear symptoms (especially in elderly) and can be even higher during life threatening hypernatremia. [12] Sys-temic blood sodium concentration normally is closely regulated by renal variation of sodium and water excretion. Urinary concentration depends on maintenance of high sodium and os-molality in the renal medullary interstitial fluid. Depending on water and salt intake, osos-molality in renal medullary interstitial fluid can reach 600 mosmol/kg in humans and 5000 mosmol/kg in rodents. The osmolality and electrolyte composition of extracellular fluid in other tissues had been believed to be similar to that of systemic blood because of rapid osmotic exchange across capillaries. However, recent studies have revealed exceptions. For example, when dietary salt intake is very high, some salt is temporarily and dynamically stored in the space between cells, bound to, for example, to glycosaminoglycans in the skin interstitium. [52,53] The result-ing skin microenvironment is hypertonic as evidenced by upregulation of the tonicity-respon-sive enhancer binding protein (TonEBP or NFAT5) in skin of rats on high salt diet, even though plasma sodium concentration has remained normal. [54] In another study, directly measuring osmolality of tissue slices, Go et al. demonstrated that osmolality of thymus, spleen
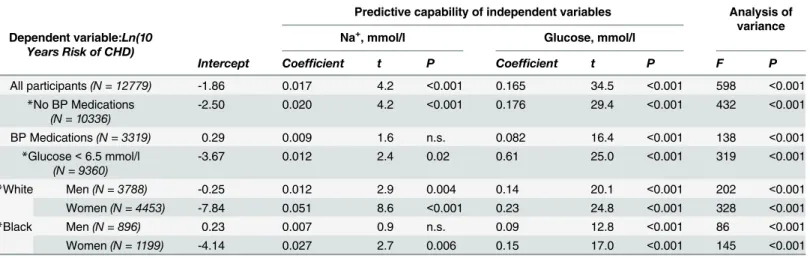
Table 3. Multivariable linear regression analysis of 10 Years Risk of CHD (Ln transformed) with serum Na+and Glucose as predictor variables (ARIC Study).
Predictive capability of independent variables Analysis of variance Dependent variable:Ln(10
Years Risk of CHD)
Na+, mmol/l Glucose, mmol/l
Intercept Coefficient t P Coefficient t P F P
All participants(N = 12779) -1.86 0.017 4.2 <0.001 0.165 34.5 <0.001 598 <0.001
*No BP Medications
(N = 10336)
-2.50 0.020 4.2 <0.001 0.176 29.4 <0.001 432 <0.001
BP Medications(N = 3319) 0.29 0.009 1.6 n.s. 0.082 16.4 <0.001 138 <0.001
*Glucose<6.5 mmol/l
(N = 9360)
-3.67 0.012 2.4 0.02 0.61 25.0 <0.001 319 <0.001
*White Men(N = 3788) -0.25 0.012 2.9 0.004 0.14 20.1 <0.001 202 <0.001
Women(N = 4453) -7.84 0.051 8.6 <0.001 0.23 24.8 <0.001 328 <0.001
*Black Men(N = 896) 0.23 0.007 0.9 n.s. 0.09 12.8 <0.001 86 <0.001
Women(N = 1199) -4.14 0.027 2.7 0.006 0.15 17.0 <0.001 145 <0.001
Serum Na+and glucose are significant predictors of the 10 Years Risk of CHD when all study participants are included in analysis and in the following
subsets: people who do not take blood pressure medications, people with blood glucose concentration lower than 6.5 mmol/l, white men, white women and black men.
*Participants who took blood pressure medications were excluded from the analysis
doi:10.1371/journal.pone.0128870.t003
and liver from normal mice is about 30 mosmol/kg higher than osmolality of the systemic blood. [55] Thus, local extracellular sodium concentration can be higher than in systemic blood plasma.
Even very small elevations of extracellular sodium produce physiologically relevant changes in endothelial cells. Thus, using atomic force microscopy, Oberleithner et al. demonstrated that acute (several minutes) increase of sodium from 135 to 145–150 mmol/l in presence of aldoste-rone stiffens endothelial cells in tissue culture and reduces nitric oxide release from them. [24, 25] Chronic (5 days) increase of sodium leads to hardening and flattering of the endothelial glycocalyx (eGC), decreased binding/buffering capacity of the eGC for sodium, and increased endothelial sodium permeability. [25]
The endothelial glycocalyx is a carbohydrate-rich layer lining the vascular endothelium. [26] Its composition is very dynamic. Various signals result in altered synthesis of its constantly turning over membrane bound molecules, which results in fine tuning of inflammatory re-sponses. High NaCl-induced changes in composition of the eGC [25,56] could involve alter-ations of cellular metabolism, biochemistry and/or signaling. Indeed, previous studies [27] and our present one indicate that small elevations of extracellular sodium increase expression of pro-inflammatory mediators in endothelial cells and increase their adhesive properties. Thus, Wild et al [27] demonstrated that short exposure (20 hours) of HUVEC cells in culture to ele-vated sodium (+10-30mmol/l) potentiated the pro-inflammatory effects of TNFαand of non-uniform shear stress. Their evidence included enhanced expression of adhesive molecules (VCAM-1 and E-selectin) and increased adhesion of monocytes to the endothelial cells. This effect was not seen under static or laminar flow conditions.[27] In the present study, we show that chronic exposure of HUVEC cells to elevated sodium for 4 days under static conditions in-creases expression of adhesive molecules (VCAM-1 and E-selectin) and of pro-inflammatory chemokine MCP-1 (CCL2), accompanied by increased adhesion of monocytes (Figs1and2). Production of such effects under static conditions, without additional pro-inflammatory stimu-lation by TNFαor non-uniform shear stress, suggests that elevated sodium per se can
initiate inflammation.
Extrapolation of these findings suggested that elevation of plasma sodium for even a short time could enhance inflammation in arterial locations exposed to high shear stress such as cur-vatures, ostia and bifurcations, which are known to be prone to atherosclerosis. [57,58] In ad-dition, chronic elevation of plasma sodium or continuous high sodium in locations that accumulate it could cause inflammation as a result of the pro-inflammatory effects of sodium on the endothelium of the microvasculature. [59,60] To test these possibilities in vivo we re-stricted water to elevate serum sodium in mice.
making it reasonable for studying the effects of high plasma sodium on atherosclerosis in large vessels, but it also increase hypertonic signaling in tissues, giving a plausible avenue for microvascular inflammation.
Consistent with the cell culture results, water restriction increased expression of mediators of inflammation VCAM-1, E-selectin and MCP-1 in mouse tissues (Fig 3). Also, water restric-tion promoted atherosclerosis in aortic root (Fig 4) and caused thickening of walls of coronary arteries in ApoE-/-mice (Fig 5), which is considered as a risk factor for development of athero-sclerosis and predicts future clinical cardiovascular disease events.[41,42].
Although we attribute the vascular findings in our mouse model of water restriction to the increase of plasma sodium, other factors that changed during the water restriction could also be involved, such as activation of the renin-angiotensin-aldosterone system by water restriction [63]. An additional concern was that the mouse model might not translate to humans. There-fore, we analyzed the relation between plasma sodium and cardiovascular disease in humans, using the results of the Atherosclerosis Risk in Community (ARIC) study. [43]
The normal human population has much larger range of plasma sodium 135–145 mmol/l than was achieved in the experiments described above in which sodium was changed only 0–3 mmol/l by dietary salt manipulation and 5 mmol/l by manipulating water intake in mice. Therefore, the general human population represents a good model for testing the association of plasma sodium with other measured parameters of health. Using multivariable regression anal-ysis [48–51] of data from ARIC study, we demonstrate that plasma sodium is an independent predictor for 10Years Risk for occurrence of coronary heart disease (CHD) (Fig 6, Tables2and 3). Such result is consistent with our proposed pro-inflammatory and pro-atherogenic effects of plasma sodium. Initially, it is difficult to comprehend how a single measurement of sodium on the first visit could predict future CHD if plasma sodium concentration is, as often viewed, a random value that varies normally due to assay-specific factors. However, plasma sodium has recently been shown to be an idiosyncratic characteristic of every person. This was shown through analysis of plasma sodium measurements in records from two large health plan-based cohorts over a 10 year interval.[29] Thus, serial plasma sodium values for an individual cluster around a patient-specific set point and the degree of individual variation is similar to that for glucose. The individuality of plasma sodium explains how a single measurement of plasma so-dium could predict long-term health outcomes, such as we find in the 10 Years Risk of CHD in this study and 10 Years Risk of Stroke in our previous study. [28]
Taken together, the results of this and previous studies indicate that small elevations of ex-tracellular sodium within or slightly above the normal plasma range have adverse cardiovascu-lar consequences. Thus, in endothelial cell culture elevations of extracellucardiovascu-lar sodium increases endothelial stiffness; hardens and flattens the endothelial glycocalyx [24,25]; increases expres-sion of inflammatory mediators, such as adheexpres-sion molecules VCAM1 and E-selectin and che-mokine MCP-1, accompanied by increased adhesive properties both during non-uniform shear stress and under static conditions ([27] and Figs1and2); and increases expression and secretion of von Willebrand Factor, a key initiator of blood clotting [28]. In mice, mild water restriction that elevates plasma sodium by only 5 mmol/l upregulates vWF, the initiator of blood clotting in tissues and in blood [28]; upregulates the mediators of inflammation, VCAM-1, E-selectin and MCP-1 (Fig 3); increases thrombogenesis [28]; promotes atherosclerosis (Fig 4); and thickens the walls or coronary arteries (Fig 5). Also, multivariable analysis of data from Atherosclerosis Risk in Community study demonstrates that serum sodium is an inde-pendent predictor in humans of the plasma level of vWF, of the 10 Years Risk of Stroke [28] and of the10 Years Risk of CHD (Fig 6,Table 3).
In summary, the known mechanisms underlying the pathology of cardiovascular diseases such as atherosclerosis, CHD and stroke involve a complex interplay of inflammation,
coagulation and vascular wall remodeling [19–21]. Now, there is increasing evidence that ele-vation of extracellular sodium within the physiological range is accompanied by vascular changes that facilitate development of CVD. The findings provide additional insight into the adverse cardiovascular effects of conditions affecting plasma sodium, such as dehydration, and other conditions affecting water/salt balance.[3–12] The findings also bring attention to plasma sodium as a possible risk factor for CVDs and probably for other diseases with thrombotic and inflammatory components.
Methods
Cell culture
Primary Umbilical Vein Endothelial Cells;Normal, Human (HUVECs) were purchased from American Type Culture Collection (ATCC) at passage 1 (ATCC PCS-100-010, ATCC, Manas-sas, VA). These cells are distributed by ATCC as part of the Primary Cell Solutions cell offer-ings. The cells were grown at 37C, 5% CO2in Vascular Cell Basal Medium (No. PCS-100-030, ATCC) supplemented with Endothelial Cell Growth Kit-BBE (No.PCS-100-040, ATCC) and antibiotics (No.PCS-999-002, ATCC). Osmolality of this medium (Control medium) was 270 mosmol/kg (133 mmol/l sodium). High NaCl medium was prepared by adding NaCl to the total osmolality of 295–380 mosmol/kg (145–188 mmol/l sodium). To elevate NaCl, control medium was replaced by the high NaCl medium. All experiments, except transmigration assay, were performed on logarithmically growing cells at about 80% confluence. Completely conflu-ent monolayers were used for transmigration assay. For all experimconflu-ents, cells were exposed to high NaCl for 4 days. To prevent cultures from becoming over confluent, after 2 days in high NaCl medium cells were passaged to new dishes (RNA extraction), chamber slides (adhesion assay) or cell culture inserts (transmigration assay) and grown in high NaCl for 2 more days. Seeding cell number was adjusted so that they were about 80% confluent at time of sample col-lection for mRNA analysis and adhesion assay or completely confluent for transmigration assay. For all experiments, cells were used at passages P2-P6.
Analysis of effect of high NaCl on gene expression in HUVECs by PCR
array
Cells were exposed to high NaCl for 4 days on 10 cm dishes. The Human Endothelial Cell Biol-ogy RT²ProfilerPCR Array (Cat No 330231 PAHS-015ZA, Qiagen, Valencia, CA) was used to analyze the expression of 84 genes related to endothelial cell biology. Total RNA was extracted with RNeasy Mini Kit (No. 74104, QIAGEN, Valencia, CA). 0.5μg of the RNA was converted into cDNA using RT2First Strand Kit (Cat No 330401, Qiagen, Valencia, CA). Quantification of the genes expression was performed by the Comparative CTmethod. B2M, HPRT1, GAPDH, ACTB housekeeping genes (HKGs) were used as an endogenous controls. Average CTvalues for these four HKGs (AVG HKGs) were used for the quantification. The relative copy number (2–(Ct (mRNA)—Ct (AVG HKGs)) of each target mRNA was calculated for each sam-ple and normalized to the relative copy number in the corresponding control samsam-ple (270 mos-mol/kg). The experiment was repeated 3 times.
Immunofluorescent detection of E-selectin in HUVEC cells
primary antibodies for E-selectin (ECM645, Part No. 2004183, Chemicon, Billerica, Massachu-setts) at 4°C overnight, followed by secondary antibodies labeled with Alexa Fluor 488 nm (green emission) (No. 4408, Cell Signaling, Danvers, MA) at room temperature for 1 hour. After 2 washes with PBS, cells were stained with 2.5μg/ml DAPI (DNA stain) (No. D1306, Invi-trogen, Carlsbad, CA) and mounted with ProLong Gold antifade reagent (No. P36930, Invitro-gen, Carlsbad, CA). Pictures were taken by confocal microscopy using a Zeiss LSM 510 microscope (Carl Zeiss MicroImaging, Jena, Germany) with a 63× NA1.4 oil-immersion objective.
Extraction of protein from HUVECs and Western blot
Cells were rinsed with phosphate-buffered saline (PBS), adjusted with NaCl to the same osmo-lality as the medium, then lysed with RIPA buffer (50 mM Tris-HCl, 1% NP-40, 150mM NaCl, 1mM EDTA, 1mM NaF, 1 mM Na3VO4, and protease inhibitors (Roche Diagnostics, India-napolis, IN)). 3X reducing Laemmli Sample buffer (No. 7722, Cell Signaling, Danvers, MA) was added to the lysates and samples were boiled for 5 minutes. Sample loading onto gels was equalized according to the total protein concentration measured before addition of Laemmli buffer. Primary antibodies were against VCAM-1 (No. 305801, BioLegend, San Diego, CA), alfa-tubulin (No. 691251, MP Biomedicals, Solon, OH). Secondary antibodies were labelled with Alexa Fluor 680 nm Dye (Invitrogen, Carlsbad, CA). Immunoblots were scanned and In-tegral Fluorescence (IF) from each band was measured using Odyssey Infrared Imaging System (Li-COR Biosciences, Lincoln, NE).
Adhesion assay
Adhesion assay was performed using Endothelial Cell Adhesion Assay Kit (Cat No: ECM645, Chemicon, Billerica, Massachusetts) according to the kit instructions with modifications. HUVECs were exposed to high NaCl for 4 days as described above in“Cell culture”section. For the last 2 days of the exposure they were grown on 8 chamber slides where adhesion assay was performed. Fresh adult human peripheral blood mononuclear cells (PBMC) (Cat No: PB009F-1, HemaCare, Van Nuys, CA) were frozen in liquid nitrogen in 2.5 mln aliquots in FBS with 20% DMSO. For the adhesion assay, PBMC were thawed, transferred into HUVEC cell culture media described above and incubated overnight at 37C, 5% CO2. Then PBMC were labeled with Calcein AM Dye: PBMC were pelleted at 240 g for 10 min, re-suspended in 1 ml culture medium with 2.5 uM of Calcein AM from the kit and incubated at 37C, 5% CO2for 30 min. PBMC were then washed 3 times with HUVEC media and added to HUVEC cells (150,000 labeled PBMC per chamber). PBMC were allowed to settle down and adhere to HUVECs for 1h. Then unbound PBMC were washed out by gentle removal and addition of culture medium in chambers for 3 times. Following the washing of unbound PBMC, HUVECs with attached PBMC were fixed for 10 minutes in 2% formaldehyde (No. 18814, Polysciences, Inc, Warrington, PA) at room temperature, permeabilyzed with 0.1% Triton X-100, stained with 2.5μg/ml DAPI (DNA stain) (No. D1306, Invitrogen, Carlsbad, CA) and mounted with ProLong Gold antifade reagent (No. P36930, Invitrogen, Carlsbad, CA) (Fig 2D). To quantify the number of PBMC attached to HUVECs, the slides were scanned with Laser Scanning Cy-tometer (CompuCyte, Cambridge, MA). PBMC were identified and counted based on Calcein AM green fluorescence (excitation 495nm / emission 516 nm) and total number of cells was counted based on DAPI fluorescence (350 nm excitation / 470 nm emission). It is important to note that before the addition of PBMC, cell culture medium in all chambers were changed to control culture medium (270 mosmol/kg). Therefore, this assay tests changes of adhesive prop-erties of endothelial cells following exposure to high NaCl and excludes effects of high NaCl on
PBMC themselves. For positive control, HUVECs were treated for 5h wth TNFα(50 ng/ml), a known inducer of adhesive properties of endothelial cells.
Transmigration assay
To analyze whether exposure of HUVECs to high NaCl promotes transmigration of PBMC through HUVECs monolayer, transmigration assay was performed [65]. HUVECs were ex-posed to high NaCl for 4 days as described above in“Cell culture”section. For the last 2 days of the exposure they were seeded in fibronectin coated cell culture inserts for 24 well plates with 3.0μm pores (No. 354597, Corning, Tewksbury, MA). Cell density was adjusted to ensure that confluent monolayers were formed by the end of 4 days exposure to high NaCl (100,000 HUVECs per insert in 250ul). PBMC were prepared and labeled with Calcein AM the same way as described above for adhesion assay. 250,000 labeled PBMC in 250 ul of cell culture me-dium (270 mosmol/kg) were added to the HUVEC monolayer, the cell culture inserts were placed into wells of 24 well plate filled with 300 ul of cell culture medium (270 mosmol/kg) and incubated at 37C, 5% CO26h. To quantify number of PBMC transmigrated through HUVECs monolayers from upper chamber to lower chamber, culture media from lower chamber was transferred into wells of 96 well plate and integral green fluorescence was measured by Wallac 1420 Victor multilabel counter (PerkinElmer, WalthamMA). Note that as in case of adhesion assay, high NaCl was washed out from HUVEC monolayers before addition of PBMC. There-fore, the assay tests effects of high NaCl on ability of HUVECs to facilitate PBMC transmigra-tion but excludes effects of high NaCl on PBMC themselves.
Mice
There were two mouse models used in this study. Male 129S6 traditional inbred mice (129S6, Model no.129SVE-M, Taconic Farms, Inc, Hudson, NY) were purchased at age of 3 months and used for 9 days water restriction experiment. Male ApoE constitutive knockout mice (Apoe, Model no.APOE-M, C57BL/6 Background), Taconic Farms, Inc, Hudson, NY) were purchased at age of 4 weeks. All mouse studies were carried out in strict accordance with the recommendations in the Guide for the Care and Use of Laboratory Animals of the National In-stitutes of Health. The protocol was approved by the Animal Care and Use Committee of Na-tional Heart Lung and Blood Institute (Protocol Number: H-0130R2). The mice were housed in an Association for Assessment and Accreditation of Laboratory Animal Care-accredited fa-cility of National Heart Lung and Blood Institute. At the end of the experiments, mice were sac-rificed by cervical dislocation.
Water restriction (9 days)
Water restriction was performed as previously described [28]. All mice received gelled food containing 30% water (1.7 ml of deionized water + 4 g of balanced purified rodent diet, AIN-76A, Research Diets, New Brunswick, NJ + 57 mg of agar per 5.7 g of the food). Food was pro-vided in excess in individual cups so the mice ate what they wanted. The control group had free access to water. Water restricted mice did not get any additional water. Five control and five water restricted mice were tested.
Mouse blood collection and measurement of cholesterol in mouse serum
centrifuging at 4°C for 10 min at 1800g. The Amplex Red Cholesterol Assay Kit (No. A12216, Life Technologies) was used to measure serum cholesterol level.
RNA extraction from mouse tissues and analysis by real-time PCR
Tissues were collected in Allprotect Tissue Reagent (No. 76405, QIAGEN, Valencia, CA) at the end of the experiments and stored at -20°C. Total RNA was extracted using AllPrep DNA/ RNA Mini Kit (No. 80204, QIAGEN, Valencia, CA). The RNA (1μg) was converted to cDNA by reverse transcription using TaqMan High-capacity cDNA RT Kit (No. 4374966, Applied Biosystems). VCAM-1, E-selectin and MCP-1 mRNA levels were measured by real-time PCR using Mouse TaqMan Gene Expression Assays (No. 4331182, Applied Biosystems) on 7900HT Fast Real-Time PCR System (Applied Biosystems). Quantification was performed by the Com-parative CT method. 18S ribosomal RNA was used as an endogenous control (No. 4319413E, Applied Biosystems) and was amplified in the same tube with the target. The relative copy number (2–(Ct (vWF)—Ct (18S rRNA)) of a target was calculated for each sample and normalized to the average copy number in the corresponding tissues of control mice (free access to water). Each group contained 5 mice.
Immunohistochemical staining of paraffin embedded mouse liver
sections
Mouse livers were fixed for 48 hours in 4% paraformaldehyde at 4°C, and then embedded in paraffin. Sections were cut and mounted on positively charged slides by American Histolabs (Gaithersburg, MD). Sections were stained with antibodies against VCAM-1 (No. MCA2297T, AbDSerotec, Kidlington, UK), CD31 (No. DIA 310, Dianova, Hamburg, Germany), as previ-ously described [66]. Visualization was with diaminobenzidine (DAB) (No. D22187, Molecular Probes, Eugene, OR), which generates a brown-colored oxidation product upon reaction with the horseradish peroxidase (HRP) labeled secondary antibody. Development of the brown DAB color was monitored to prevent over saturation that would prevent quantification. A Nikon E800 Widefield Microscope was used for photography.
Quantification of VCAM-1 protein expression on mouse liver tissue
sections
The quantification was performed as previously described [28]. Briefly, to quantify VCAM-1 protein expression on the DAB stained sections (see above), we used the Yellow-CMYK chan-nel method described by Phamet al[67]. They demonstrated that images in the CMYK yellow channel correlate with the IHC DAB stain intensity. We extracted the CMYK yellow channel from the images of liver tissue sections stained with DAB for VCAM-1 (brown color) and with hematoxylin for nuclei (blue) (Fig3Band3C) and quantified average yellow intensity per pixel as a measure of VCAM-1 protein expression. Images of liver sections from 4 control and 4 water restricted mice were analyzed. 20 images were taken from the liver section of each mouse and their average intensity was calculated.
Quantification of atherosclerosis in aortic root and wall thickness of
coronary arteries of ApoE
-/-mice
Atherosclerotic lesions in aortic root were quantified as described [68] with slight modifica-tions. Starting at age of 6 weeks, ApoE-/-mice were water restricted as described above by feed-ing them gel food containfeed-ing 30% water (Fig 4A). Gel food was made from high fat RD Western Diet (D12079BM, Research Diets, New Brunswick), containing 40% of calories from
fat. Blood for cholesterol measurements was collected 6 weeks after start of the water restric-tion. Atherosclerosis was analyzed 7–9 weeks after start of the water restriction. Heart/aortic root tissues were fixed in 4% formaldehyde (No. 18814, Polysciences, Inc, Warrington, PA) for 2 days at 4C.
Upper part of the hearts containing aortic root were transferred into PBS and then embed-ded in O.C.T. compound (Tissue-Tek #4583, Sakura Finetek, Torrance, CA). Serial 10-μm fro-zen sections were cut with Leica CM3050 cryostat microtome (Leica Biosystems) spanning 900μm starting from the base of the aortic root. Every other section was picked up onto glass slides, dried at room temperature for 10 min and then stored at -80C. For atherosclerotic le-sions analysis, lipids were stained with Oil Red O (No.26503-02, Electron Microscopy Sciences, Hatfield, PA) and stained area on every section was measured with Fiji image processing soft-ware [69].
Lower parts of the hearts were embedded in paraffin. Sections were cut and mounted on positively charged slides and stained with hematoxylin and eosin by American Histolabs (Gai-thersburg, MD). Images of coronary arteries were taken by Nikon E800 Widefield Microscope from 3 control and 4 water restricted mice and analyzed with Fiji image processing software [69]. Arterial lumen diameter was calculated from inner wall perimeter. Arterial wall thickness was calculated as average of 8 measurements along the wall of each artery.
Analysis of data from Atherosclerosis Risk in Community (ARIC) study
Data from Atherosclerosis Risk in Community (ARIC) study were obtained from the NHLBI Biologic Specimen and Data Repository Information Coordinating Center. The obtained data-sets were redacted to remove personal identifiers to conform to individual informed consent restrictions. The datasets transfer was approved by NIH Office of Human Subjects Research (OHSR) and excluded from Institutional Review Board review due to the determination of Not Human Subjects Research that was based on the interpretation of 45 CRF 46 under“Research Involving Coded Private Information or Biological Specimens”and Guidance on Engagement of Institutions in Human Subjects Research (October 16, 2008).
Multivariable linear regression analysis [48,50,51] of data from ARIC study was performed to assay if concentration of serum sodium contributes to prediction of 10 years Risk of coro-nary heart disease (CHD). The data were analyzed using SAS (SAS Institute Inc., Cary, NC, USA) and SigmaPlot (Systat Software, San Jose, CA) software.
Statistical analysis
All the statistical analyses were done using SigmaPlot Software. All data were tested for nor-mality and equal variance before the analysis. If nornor-mality and equal variance tests passed, comparisons were performed by the two-tailed Student'st-test. If not, non-parametric Mann-Whitney Test was used.P<0.05 was considered significant. VCAM-1 expression data (Fig 1B) were Log10 transformed before the analysis. VCAM-1 protein level in HUVEC cells was ana-lyzed for linear dependence on the level of NaCl using GraphPad InStat Software.
Supporting Information
S1 Fig. Representative images from immunohistochemical staining for VCAM-1 protein of heart sections.Positive staining of inner surface of coronary arteries of water restricted mice (shown by arrowheads) is consistent with endothelial expression of VCAM1.
Acknowledgments
We thank Daniela Malide and Christian Combs at NHLBI Light Microscopy Core facility for help with microscopy; Zu-xi Yu at NHLBI Pathology Core facility for help with frozen sections. Data from Atherosclerosis Risk in Community (ARIC) study were obtained from the NHLBI Biologic Specimen and Data Repository Information Coordinating Center (BioLINCC). The authors thank the staff and participants of the ARIC study for their important contributions and for providing the data to BioLINCC repository.
Author Contributions
Conceived and designed the experiments: NID MBB. Performed the experiments: NID. Ana-lyzed the data: NID MBB. Wrote the paper: NID MBB.
References
1. Go AS, Mozaffarian D, Roger VL, Benjamin EJ, Berry JD, Borden WB, et al. Executive Summary: Heart Disease and Stroke Statistics-2013 Update A Report From the American Heart Association. Circula-tion. 2013; 127(1):143–52. doi:10.1161/CIR.0b013e318282ab8fPMID:WOS:000313052900032. 2. Lim GB. Global burden of cardiovascular disease. Nature reviews Cardiology. 2013; 10(2):59-. doi:10.
1038/nrcardio.2012.194PMID:MEDLINE:23296068.
3. Chan J, Knutsen SF, Blix GG, Lee JW, Fraser GE. Water, other fluids, and fatal coronary heart disease
—The Adventist Health Study. American Journal of Epidemiology. 2002; 155(9):827–33. doi:10.1093/ aje/155.9.827PMID:WOS:000175397300007.
4. He FJ, Macgregor GA. Salt intake, plasma sodium, and worldwide salt reduction. AnnMed. 2012; 44 Suppl 1:S127–S37. doi:10.3109/07853890.2012.660495PMID:22713141
5. Manz F, Wentz A. The importance of good hydration for the prevention of chronic diseases. Nutrition Reviews. 2005; 63(6):S2–S5. doi:10.1301/nr.2005.jun.S2-S5PMID:WOS:000230035000002. 6. North BJ, Sinclair DA. The Intersection Between Aging and Cardiovascular Disease. Circulation
Re-search. 2012; 110(8):1097–108. doi:10.1161/circresaha.111.246876PMID:WOS:000302790000013. 7. Fox CS. Cardiovascular Disease Risk Factors, Type 2 Diabetes Mellitus, and the Framingham Heart
Study. Trends in Cardiovascular Medicine. 2010; 20(3):90–5. doi:10.1016/j.tcm.2010.08.001PMID: WOS:000288579000004.
8. Cowen LE, Hodak SP, Verbalis JG. Age-Associated Abnormalities of Water Homeostasis. Endocrinolo-gy and Metabolism Clinics of North America. 2013; 42(2):349–70.http://dx.doi.org/10.1016/j.ecl.2013. 02.005. doi:10.1016/j.ecl.2013.02.005PMID:23702406
9. Senay LC, Christen Ml. Changes in Blood Plasma during Progressive Dehydration. Journal of Applied Physiology. 1965; 20(6):1136–&. PMID:WOS:A19657068400005.
10. He FJ, Markandu ND, Sagnella GA, de Wardener HE, Macgregor GA. Plasma sodium: ignored and un-derestimated. Hypertension. 2005; 45(1):98–102. PMID:15557392
11. Maletkovic J, Drexler A. Diabetic Ketoacidosis and Hyperglycemic Hyperosmolar State. Endocrinology and Metabolism Clinics of North America. 2013; 42(4):677-+. doi:10.1016/j.ecl.2013.07.001PMID: WOS:000329255900004.
12. Adrogue HJ, Madias NE. Primary care—Hypernatremia. New England Journal of Medicine. 2000; 342(20):1493–9. doi:10.1056/nejm200005183422006PMID:WOS:000087068200006.
13. Dietary Reference Intakes for Water, Potassium, Sodium, Chloride, and Sulfate / Appendix J: Serum Electrolyte Concentrations NHANES III, 1988–94. In: Standing Committee on the Scientific Evaluation of Dietary Reference Intakes FaNB, editor. Panel on Dietary Reference Intakes for Electrolytes and Water. Washington, DC 20001: THE NATIONAL ACADEMIES PRESS; 2005. p. 558–63.
14. Oh SW, Baek SH, An JN, Goo HS, Kim S, Na KY, et al. Small Increases in Plasma Sodium Are Associ-ated with Higher Risk of Mortality in a Healthy Population. Journal of Korean Medical Science. 2013; 28(7):1034–40. doi:10.3346/jkms.2013.28.7.1034PMID:WOS:000321629300014.
15. Komiya I, Yamada T, Takasu N, Asawa T, Akamine H, Yagi N, et al. An abnormal sodium metabolism in Japanese patients with essential hypertension, judged by serum sodium distribution, renal function and the renin-aldosterone system. Journal of Hypertension. 1997; 15(1):65–72. doi:10.1097/ 00004872-199715010-00006PMID:WOS:A1997WJ83600009.
16. Suckling RJ, He FJ, Markandu ND, Macgregor GA. Dietary salt influences postprandial plasma sodium concentration and systolic blood pressure. Kidney Int. 2012; 81(4):407–11. doi:10.1038/ki.2011.369 PMID:22048126
17. Kovesdy CP. Significance of hypo- and hypernatremia in chronic kidney disease. Nephrology Dialysis Transplantation. 2012; 27(3):891–8. doi:10.1093/ndt/gfs038PMID:WOS:000301907200007. 18. Hui X, Matsushita K, Sang Y, Ballew SH, Fueloep T, Coresh J. CKD and Cardiovascular Disease in the
Atherosclerosis Risk in Communities (ARIC) Study: Interactions With Age, Sex, and Race. American Journal of Kidney Diseases. 2013; 62(4):691–702. doi:10.1053/j.ajkd.2013.04.010PMID:
WOS:000324858000010.
19. Krychtiuk KA, Kastl SP, Speidl WS, Wojta J. Inflammation and coagulation in atherosclerosis. Hamos-taseologie. 2013; 33(4):269-+. doi:10.5482/hamo-13-07-0039PMID:WOS:000327228700004. 20. Nieswandt B, Kleinschnitz C, Stoll G. Ischaemic stroke: a thrombo-inflammatory disease? Journal of
Physiology-London. 2011; 589(17):4115–23. doi:10.1113/jphysiol.2011.212886PMID: WOS:000294826800008.
21. Croce K, Libby P. Intertwining of thrombosis and inflammation in atherosclerosis. Current Opinion in Hematology. 2007; 14(1):55–61. doi:10.1097/00062752-200701000-00011PMID:
WOS:000242961500010.
22. Pober JS, Sessa WC. Evolving functions of endothelial cells in inflammation. Nature Reviews Immunol-ogy. 2007; 7(10):803–15. doi:10.1038/nri2171PMID:WOS:000249691200012.
23. Ramcharan KS, Lip GYH, Stonelake PS, Blann AD. The endotheliome: A new concept in vascular biol-ogy. Thrombosis Research. 2011; 128(1):1–7. doi:10.1016/j.thromres.2010.11.019PMID:
WOS:000291383500001.
24. Oberleithner H, Riethmueller C, Schillers H, MacGregor GA, de Wardener HE, Hausberg M. Plasma so-dium stiffens vascular endothelium and reduces nitric oxide release. Proceedings of the National Acad-emy of Sciences of the United States of America. 2007; 104(41):16281–6. doi:10.1073/pnas. 0707791104PMID:WOS:000250128800056.
25. Oberleithner H, Peters W, Kusche-Vihrog K, Korte S, Schillers H, Kliche K, et al. Salt overload damages the glycocalyx sodium barrier of vascular endothelium. Pflugers Archiv-European Journal of Physiolo-gy. 2011; 462(4):519–28. doi:10.1007/s00424-011-0999-1PMID:WOS:000299152700003. 26. Reitsma S, Slaaf DW, Vink H, van Zandvoort MAMJ, Egbrink MGAo. The endothelial glycocalyx:
com-position, functions, and visualization. Pflugers Archiv-European Journal of Physiology. 2007; 454(3): 345–59. doi:10.1007/s00424-007-0212-8PMID:WOS:000246391200001.
27. Wild J, Soehnlein O, Dietel B, Urschel K, Garlichs CD, Cicha I. Rubbing salt into wounded endothelium: Sodium potentiates proatherogenic effects of TNF-alpha under non-uniform shear stress. Thrombosis and Haemostasis. 2014; 112(1):183–95. doi:10.1160/th13-11-0908PMID:WOS:000338820300024. 28. Dmitrieva NI, Burg MB. Secretion of von Willebrand factor by endothelial cells links sodium to
hyperco-agulability and thrombosis. Proceedings of the National Academy of Sciences of the United States of America. 2014; 111(17):6485–90. doi:10.1073/pnas.1404809111PMID:WOS:000335199000084. 29. Zhang Z, Duckart J, Slatore CG, Fu Y, Petrik AF, Thorp ML, et al. Individuality of the plasma sodium concentration. American journal of physiology Renal physiology. 2014; 306(12):F1534–43. doi:10. 1152/ajprenal.00585.2013PMID:MEDLINE:24717732.
30. Huang DW, Sherman BT, Tan Q, Collins JR, Alvord WG, Roayaei J, et al. The DAVID Gene Functional Classification Tool: a novel biological module-centric algorithm to functionally analyze large gene lists. Genome Biology. 2007; 8(9). doi:10.1186/gb-2007-8-9-r183PMID:WOS:000252100800009. 31. Michiels C. Endothelial cell functions. Journal of Cellular Physiology. 2003; 196(3):430–43. doi:10.
1002/jcp.10333PMID:WOS:000184522000003.
32. Ley K, Laudanna C, Cybulsky MI, Nourshargh S. Getting to the site of inflammation: the leukocyte ad-hesion cascade updated. Nature Reviews Immunology. 2007; 7(9):678–89. doi:10.1038/nri2156 PMID:WOS:000249038500012.
33. Deshmane SL, Kremlev S, Amini S, Sawaya BE. Monocyte Chemoattractant Protein-1 (MCP-1): An Overview. Journal of Interferon and Cytokine Research. 2009; 29(6):313–26. doi:10.1089/jir.2008. 0027PMID:WOS:000266160600001.
34. Blankenberg S, Barbaux S, Tiret L. Adhesion molecules and atherosclerosis. Atherosclerosis. 2003; 170(2). doi:10.1016/s0021-9150(03)00097-2PMID:WOS:000186850000001.
35. Boring L, Gosling J, Cleary M, Charo IF. Decreased lesion formation in CCR2(-/-) mice reveals a role for chemokines in the initiation of atherosclerosis. Nature. 1998; 394(6696):894–7. doi:10.1038/29788 PMID:WOS:000075611800049.
37. Ross R. Mechanisms of disease—Atherosclerosis—An inflammatory disease. New England Journal of Medicine. 1999; 340(2):115–26. PMID:WOS:000078016200007.
38. Osada J, Joven J, Maeda N. The value of apolipoprotein E knockout mice for studying the effects of die-tary fat and cholesterol on atherogenesis. Current Opinion in Lipidology. 2000; 11(1):25–9. doi:10. 1097/00041433-200002000-00004PMID:WOS:000085723000004.
39. Daugherty A, Whitman SC. Quantification of atherosclerosis in mice. Methods in molecular biology (Clifton, NJ). 2003; 209:293–309. PMID:MEDLINE:12357958.
40. Libby P, Ridker PM, Hansson GK. Progress and challenges in translating the biology of atherosclerosis. Nature. 2011; 473(7347):317–25. doi:10.1038/nature10146PMID:WOS:000290722400038. 41. Lakatta EG, Levy D. Arterial and cardiac aging: Major shareholders in cardiovascular disease
enter-prises Part I: Aging arteries: A "set up" for vascular disease. Circulation. 2003; 107(1):139–46. doi:10. 1161/01.cir.0000048892.83521.58PMID:WOS:000180366600038.
42. O'Leary DH, Polak JF, Kronmal RA, Manolio TA, Burke GL, Wolfson SK, et al. Carotid-artery intima and media thickness as a risk factor for myocardial infarction and stroke in older adults. New England Jour-nal of Medicine. 1999; 340(1):14–22. doi:10.1056/nejm199901073400103PMID:
WOS:000077943700003.
43. Williams OD. The Atherosclerosis Risk in Communities (ARIC) Study—Design and Objectives. Ameri-can Journal of Epidemiology. 1989; 129(4):687–702. PMID:WOS:A1989T805200005.
44. Chambless LE, Folsom AR, Sharrett AR, Sorlie P, Couper D, Szklo M, et al. Coronary heart disease risk prediction in the Atherosclerosis Risk in Communities (ARIC) study. Journal of Clinical Epidemiolo-gy. 2003; 56(9):880–90. doi:10.1016/s0895-4356(03)00055-6PMID:WOS:000185726200011. 45. Folsom AR, Chambless LE, Duncan BB, Gilbert AC, Pankow JS, Atherosclerosis Risk Communities S.
Prediction of coronary heard disease in middle-ages adults with diabetes. Diabetes Care. 2003; 26(10): 2777–84. doi:10.2337/diacare.26.10.2777PMID:WOS:000185766900011.
46. Wilson PWF, D'Agostino RB, Levy D, Belanger AM, Silbershatz H, Kannel WB. Prediction of coronary heart disease using risk factor categories. Circulation. 1998; 97(18):1837–47. PMID:
WOS:000073519200014.
47. White AD, Folsom AR, Chambless LE, Sharret AR, Yang K, Conwill D, et al. Community surveillance of coronary heart disease in the atherosclerosis risk in communities (ARIC) study: Methods and initial two years' experience. Journal of Clinical Epidemiology. 1996; 49(2):223–33. doi:10.1016/0895-4356(95) 00041-0PMID:WOS:A1996UC79900012.
48. Wakkee M, Hollestein LM, Nijsten T. Multivariable analysis. The Journal of investigative dermatology. 2014; 134(5):e20–e; quiz e. doi:10.1038/jid.2014.132PMID:MEDLINE:24732339.
49. Royston P, Sauerbrei W. Selection of variables. In: Royston P, Sauerbrei W, editors. Multivariable model-building: a pragmatic approach to regression analysis based on fractional polynomials for contin-uous variables: John Wiley & sons, Ltd; 2008. p. 23–52.
50. Katz MH. Multivariable analysis: A primer for readers of medical research. Annals of Internal Medicine. 2003; 138(8):644–50. PMID:WOS:000182173800007.
51. Katz MH. Multivariable Analysis. A practical guide for clinicians and public health researches. Cam-bridge: Cambridge University Press; 2011.
52. Titze J, Lang R, Ilies C, Schwind KH, Kirsch KA, Dietsch P, et al. Osmotically inactive skin Na+ storage in rats. American Journal of Physiology-Renal Physiology. 2003; 285(6):F1108–F17. doi:10.1152/ ajprenal.00200.2003PMID:WOS:000186366800010.
53. Titze J, Mueller DN, Luft FC. Taking Another "Look" at Sodium. Canadian Journal of Cardiology. 2014; 30(5):473–5. doi:10.1016/j.cjca.2014.02.006PMID:WOS:000335512400002.
54. Machnik A, Neuhofer W, Jantsch J, Dahlmann A, Tammela T, Machura K, et al. Macrophages regulate salt-dependent volume and blood pressure by a vascular endothelial growth factor-C-dependent buffer-ing mechanism. Nature Medicine. 2009; 15(5):545–52. doi:10.1038/nm.1960PMID:
WOS:000265889300033.
55. Go WY, Liu XB, Roti MA, Liu F, Ho SN. NFAT5/TonEBP mutant mice define osmotic stress as a critical feature of the lymphoid microenvironment. Proceedings of the National Academy of Sciences of the United States of America. 2004; 101(29):10673–8. doi:10.1073/pnas.0403139101PMID: WOS:000222842700035.
56. Oberleithner H. Two barriers for sodium in vascular endothelium? Annals of Medicine. 2012; 44: S143–S8. doi:10.3109/07853890.2011.653397PMID:WOS:000305465300019.
57. Cunningham KS, Gotlieb AI. The role of shear stress in the pathogenesis of atherosclerosis. Laboratory Investigation. 2005; 85(1):9–23. doi:10.1038/labinvest.3700215PMID:WOS:000226159400004.
58. Chiu J-J, Chien S. Effects of Disturbed Flow on Vascular Endothelium: Pathophysiological Basis and Clinical Perspectives. Physiological Reviews. 2011; 91(1):327–87. doi:10.1152/physrev.00047.2009 PMID:WOS:000286375500008.
59. Liu LX, Kubes P. Molecular mechanisms of leukocyte recruitment: organ-specific mechanisms of ac-tion. Thrombosis and Haemostasis. 2003; 89(2):213–20. PMID:WOS:000181038200004.
60. Hickey MJ, Westhorpe CLV. Imaging inflammatory leukocyte recruitment in kidney, lung and liver-challenges to the multi-step paradigm. Immunology and Cell Biology. 2013; 91(4):281–9. doi:10.1038/ icb.2012.83PMID:WOS:000317999200004.
61. Dahl LK. Salt Intake and Salt Need (Concluded). New England Journal of Medicine. 1958; 258(24): 1205–8. doi:10.1056/nejm195806122582406PMID:WOS:A1958WB23300006.
62. Sagnella GA, Markandu ND, Buckley MG, Miller MA, Singer DRJ, Macgregor GA. Hormonal Re-sponses to Gradual Changes in Dietary-Sodium Intake in Humans. American Journal of Physiology. 1989; 256(6):R1171–R5. PMID:WOS:A1989AC79300034.
63. Schnermann JB, Sayegh SI. Regulation of extracellular fluid volume and sodium chloride excretion. Kidney physiology. Lippincott-Raven Series in Physiology. Philadelphia, New York: Lippincott-Raven; 1998. p. 79–102.
64. Chien S. Molecular and mechanical bases of focal lipid accumulation in arterial wall. Progress in Bio-physics & Molecular Biology. 2003; 83(2):131–51. doi:10.1016/s0079-6107(03)00053-1PMID: WOS:000184511400003.
65. Muller WA, Luscinskas FW. Assays of transendothelial migration in vitro. In: Cheresh DA, editor. Angio-genesis: in Vitro Systems. Methods in Enzymology. 4432008. p. 155–76.
66. Dmitrieva NI, Burg MB. High NaCl promotes cellular senescence. Cell Cycle. 2007; 6(24). PMID: WOS:000252877000019.
67. Pham N-A, Morrison A, Schwock J, Aviel-Ronen S, Iakovlev V, Tsao M-S, et al. Quantitative image analysis of immunohistochemical stains using a CMYK color model. Diagnostic Pathology. 2007; 2. doi:10.1186/1746-1596-2-8PMID:WOS:000205631300008.
68. Maganto-Garcia E, Tarrio M, Lichtman AH. Mouse models of atherosclerosis. Current protocols in im-munology / edited by John E Coligan [et al]. 2012;Chapter 15:Unit 15.24.1–3. doi:10.1002/
0471142735.im1524s96PMID:MEDLINE:22314832.