www.atmos-chem-phys.org/acp/5/1757/ SRef-ID: 1680-7324/acp/2005-5-1757 European Geosciences Union
Chemistry
and Physics
Supersaturation, dehydration, and denitrification in Arctic cirrus
B. K¨archer
Deutsches Zentrum f¨ur Luft- und Raumfahrt (DLR), Institut f¨ur Physik der Atmosph¨are (IPA), Oberpfaffenhofen, Germany Received: 1 February 2005 – Published in Atmos. Chem. Phys. Discuss.: 22 March 2005
Revised: 6 June 2005 – Accepted: 17 June 2005 – Published: 20 July 2005
Abstract. A polar cirrus case study is discussed with the help of a one-dimensional model with explicit aerosol and ice microphysics. It is demonstrated that continuous cool-ing of air in regions with small amounts of ice and slow ice deposition rates of water vapor drives significant in-cloud supersaturations over ice, with potentially important conse-quences for heterogeneous halogen activation. Radiatively important cloud properties such as ice crystal size distribu-tions are investigated, showing the presence of high number concentrations of small crystals in the cloud top region at the tropopause, broad but highly variable size spectra in the cloud interior, and mostly large crystals at the cloud base. It is found that weakly forced Arctic cirrostratus are highly efficient at dehydrating upper tropospheric air. Estimating nitric acid uptake in cirrus with an unprecedented treatment of diffusion-limited trapping in growing ice crystals suggests that such clouds could also denitrify upper tropospheric air masses efficiently, but a closer comparison to suitable obser-vations is needed to draw a definite conclusion on this point. It is also shown that low temperatures, high ice supersatu-rations, and the absence of ice above but close to the cloud top region cause efficient uptake of nitric acid in background aerosol particles.
1 Introduction
Unraveling the role clouds and associated climatic feedbacks play in modulating the Greenhouse warming in the Arctic is a key element in many global climate studies (Curry et al., 1996). Airborne measurements of total water suggest that dehydration by cirrus clouds at high latitudes was respon-sible for the observed wintertime asymmetry of upper tro-pospheric water concentrations between the Northern and Southern hemispheres (Kelly et al., 1991). Owing to the low
Correspondence to:B. K¨archer ([email protected])
temperatures prevailing in the winter upper troposphere and lower stratosphere, cirrus clouds form frequently at high lat-itudes, and their occurrence is often tied to synoptic weather systems (Del Guasta et al., 1994, 1998; Masuda et al., 2000; Petzold et al., 2000; Reichardt et al., 2002; Pfister et al., 2003). Clear observational evidence exists for ice clouds in the layer between the local tropopause and the hygropause at polar latitudes (K¨archer and Solomon, 1999; Lelieveld et al., 1999). Little is known about Arctic cirrus clouds due to their difficult accessibility and the resulting paucity of observa-tions, although these clouds are capable of exerting a notice-able radiative impact, drying the upper troposphere, activat-ing heterogeneous chemistry affectactivat-ing ozone, redistributactivat-ing trace gases, and seeding lower mixed-phase clouds via verti-cal redistribution of ice nuclei.
1.1 Radiation and chemistry issues
Arctic cirrus clouds are known to dehydrate and possibly denitrify upper tropospheric air masses. Cirrus have been suspected to be responsible for the observed dryness of air in the Arctic winter (Murphy et al., 1990). In situ measure-ments of water (H2O) close to the winter Arctic tropopause
have shown that the formation of cirrus and subsequent sedi-mentation of ice crystals may dry the air on the time scale of a few hours (Schiller et al., 1999). More recent in situ mea-surements in the same region quantified the condensed phase water and ice crystal size distributions, yielding evidence for the presence of large (size exceeding 20 µm) ice cyrstals in Arctic cirrus (Hallar et al., 2004). Such large crystals are ca-pable of redistributing water (and other trace gases attached to them) and heterogeneous ice nuclei (if the crystals formed on them) efficiently by rapid gravitational settling.
A combination of trace gas and trajectory analyses based on aircraft measurements have shown a significant poten-tial for cirrus formation well above (∼3 km) the Arctic tropopause from midwinter to early spring. Cirrus form because of the simultaneous occurrence of low tempera-tures (<210 K) and the enhancement of H2O mixing
ra-tios above average stratospheric levels (>4–6 ppmv) by rapid troposphere-to-stratosphere mixing (Pfister et al., 2003). In the Arctic tropopause region and below, the same analyses reveal the frequent occurrence of ice (super-)saturation at low H2O mixing ratios (5 ppmv) caused by synoptic storms.
These weather systems lift air parcels originally located pole-ward of the tropospheric jet uppole-ward and polepole-ward and trigger cloud formation and dehydration by rapid and strong cooling. Ozone concentrations have declined at midlatitudes in the northern hemisphere lowermost stratosphere and tropopause region, with mean decadal trends peaking between−7% and
−12% at 100–200 hPa in the winter and spring seasons (Lo-gan et al., 1999). Both changes in transport and heteroge-neous chemisty have been invoked to explain these large neg-ative trends, but their relneg-ative contributions are uncertain.
Tracer transport studies have shown that gases released north of 50◦N between 150–300 hPa could be efficiently mixed into the midlatitude regions where ozone is observed to decline (Rogers et al., 2002). Chemistry-transport models predict the activation of significant quantities of chlorine in the presence of cirrus clouds (Solomon et al., 1997). Chlo-rine activation on cold aerosol droplets and ice particles, sub-sequent catalytic destruction of ozone, and export of chem-ically processed air to midlatitudes helps to explain the ob-served ozone trends at midlatitudes, provided cirrus occur frequently at high latitudes up to a few kilometers above the tropopause (see above) and the heterogeneous chemical re-actions known to occur on polar stratospheric cloud particles similarly enhance reactive chlorine in the presence of liquid aerosols and cirrus clouds (Borrmann et al., 1996).
The presence of reactive halogenes (e.g., in the form of chlorine oxide, ClO) does not necessarily correlate with the presence of cirrus clouds at the same location, because the chemical activation times of ClO are short and perturbations
to reactive chlorine can persist for many weeks, while cir-rus clouds have a limited life time and may be transported in different air masses. Recent observational evidence for the presence of enhanced levels of ClO near the winter Arc-tic tropopause has been reported by Thornton et al. (2003). Measured mixing ratios of ClO of 15-20 pptv exceeded typ-ical values found in airborne measurements in relatively dry conditions by at least a factor of 10 (Smith et al., 2001), con-stituting an effective loss process for ozone. More recent measurements at a similar time and location in the Arctic confirm these data, showing even higher levels of ClO be-tween 20–40 pptv slightly above the tropopause, in one in-stant within a cirrus cloud (F. Stroh, personal communica-tion, 2005). Even in the absence of cloud, halogen activation proceeds very rapidly on background aerosols (see below) composed of H2O, sulfuric acid (H2SO4), and nitric acid
(HNO3), at low temperatures (<205 K) above ice saturation
without freezing (Meilinger et al., 2001).
1.2 Nitric acid phase partitioning in cirrus clouds
Uptake of HNO3 on or in ice has been reported in
numer-ous laboratory and field measurements (Popp et al., 2004, and references therein). Given the variety of conditions un-der which HNO3-ice interaction may take place in the
at-mosphere (wide ranges of temperatures, HNO3partial
pres-sures, and cirrus properties) and uncertainties in theoretical descriptions of the uptake process, it remains largely un-clear if cirrus-induced denitrification is relevant globally and which cirrus type is most effective in vertically redistributing HNO3. Besides providing an overview of the temporal and
spatial development of radiatively important parameters such as ice crystal size distributions and examining the possibil-ity for ice supersaturation occurring within and dehydration caused by polar cirrus, this served as another motivation to conduct the present study.
Measurements of HNO3concentrations and other
param-eters have revealed that liquid ternary aerosols composed of H2O, HNO3, and H2SO4are present in the Arctic tropopause
region (Irie et al., 2004). These aerosols, commonly denoted as supercooled ternary solution (STS) particles, freeze ho-mogeneously to form cirrus clouds at high relative humidi-ties over ice in the same way they serve as nuclei for polar stratospheric ice clouds. Besides being taken up by aerosol particles, HNO3partitions in the ice phase in the presence of
cirrus clouds. A model analysis of the associated nonequi-librium phase partitioning of HNO3, as presented below, has
not yet been performed.
Airborne measurements of HNO3 contained in cirrus
cloud particles have frequently been expressed in terms of an equilibrium ice surface coverage and fitted to various isotherms as a function of the HNO3partial pressure and air
(Popp et al., 2004). More importantly, local equilibrium con-cepts neglect the trapping of HNO3in the ice crystal volume
during growth as well as possible kinetic limitations of up-take and thus are incapable of adequately describing the con-siderable variability in observed HNO3content in cirrus ice
crystals.
The large scatter and the less than perfect agreement with equilibrium uptake models suggests that ice phase HNO3is
not in equilibrium with its gas phase reservoir, which led K¨archer and Basko (2004) to develop a model for trace gas trapping in growing ice crystals. Trapping integrates the uptake over the entire life cycle of individual ice crystals and cannot simply be correlated to instantaneous variables. This description of uptake combines surface kinetic pro-cesses with diffusion-limited trapping of HNO3along with
condensing H2O vapor; it is thus physically more plausible
than assuming ice equilibrium and calculating the amount of particle HNO3by model isotherms.
1.3 Model case study
Accurate modeling of cirrus clouds and trace gas–ice inter-actions is of central importance for chemistry-climate predic-tion and weather forecasts. In this work, the one-dimensional (1-D) vertical, cloud-resolving model APSCm-1-D is pre-sented and applied to an observed Arctic cirrostratus cloud (Reichardt et al., 2002). The simulation is idealized, but it is partly based on information from nearby radiosondes and the results are consistent with the observed, general synoptic-scale cloud development (see Sect. 3.1).
The 1-D-version has been developed on the basis of the de-tailed microphysical model APSC (Advanced Particle Simu-lation Code) (K¨archer, 2003) to simulate vertical advection, size-dependent aerosol particle growth and evaporation, trace gas trapping in ice, homogeneous freezing and heteroge-neous ice nucleation, and individual ice crystal growth, sub-limation, and sedimentation. Some features such as tracking of individual ice crystals and the treatment of particle water uptake and homogeneous freezing are shared by the model developed by Jensen et al. (2005a). The cloud type has been chosen as the basis for the present model study because of its long life time (at least 7 h) and large vertical extent (more than 5 km). Together with low air temperatures, these factors potentially favor the partitioning of HNO3in the ice phase
and efficient vertical redistribution of HNO3, and the
contin-uous forcing produces significant supersaturation over ice. The present simulations combining a cirrus cloud-resolving model with a model of trace gas trapping and gas-aerosol microphysics are unprecedented. A detailed study of the phase partitioning of H2O and HNO3and associated
dehydration and denitrification effects is presented, yielding important insights into the physical processes involved and pointing toward the key issues needed to better understand and predict these processes in future observations and mod-els.
The basic physics of the numerical model is summarized in Sect. 2, in particular the novel features of the APSCm -1-D such as vertical transport and the tracking of height and size of many individual ice crystals. Numerical schemes used to solve microphysical equations and explicit expressions for nucleation rate coefficients, vapor fluxes, gas solubilities, and terminal fall speeds are compiled in K¨archer (2003). Results are presented and discussed in Sect. 3 and the conclusions are given in Sect. 4.
2 Model description
2.1 Vertical advection
Air temperatureT and pressurep, potential temperature θ, number density of air moleculesc, as well as volume mixing ratios χw (H2O) and χn (HNO3), aerosol particle number
density, and number density of solute (H2SO4 and HNO3)
and H2O in the aerosol particles are discretized over an
al-titude (z-)grid. All variables except p,T, andc, which are computed diagnostically, are advected as volume mixing ra-tiosχ, using a prescribed vertical wind fieldw that causes adiabatic cooling and serves as the key cloud-forcing agent:
∂(χ c) ∂t +
∂(wχ c)
∂z =0. (1)
Vertical turbulent diffusion is not included.
Advection, aerosol, and ice particle processes are operator-split in the code. The time step is chosen such that the ice saturation ratioSi(usually the most critical and fastest varying parameter) does not vary more than 0.1–1%, but it is also ascertained that crystals do not fall across two altitude bins within a time step and that the Courant-Friedrichs-Levy criterion is not violated.
The sharp gradients and small features in the vertical pro-files of relative humidity and other variables in cirrus clouds require the use of a numerical scheme preserving local ma-xima or minima as accurately as possible. To transport gas and particle volume mixing ratios, a fast yet accurate, mono-tonic, positive definite, and mass-conserving tracer advection scheme is employed (Walcek, 2000). Az-grid is used with a spatial resolution small enough to resolve the rapid homoge-neous freezing events that take place in the top cloud layers. The grid spacing1zis obtained from prescribing the mini-mum and maximini-mum altitude of the vertical domain and the number of altitude bins.
The advection sequence is computed as follows. First, the initial profiles T (z), θ (z), Si(z), andχn(z) are prescribed, along with the vertical wind fieldw(z, t ). The initial pressure profile follows fromp(z)=p0[T (z)/θ (z)]1/κ, whereκ=2/7
andp0=1000 hPa. The gas phase water mixing ratioχw(z)
then follows fromSi,T, andp.
balance∂p/∂z=−gp/(RT ), wheregis the gravitational ac-celeration andR is the ideal gas constant. Combining this equation withθ=T (p0/p)κyields
∂5 ∂z = −
Ŵ
θ , 5=
p
p0 κ
, (2)
from whichp(θ )follows by integration:
hp(z, t )
p0 iκ
=hp(z∗)
p0 iκ
−Ŵ
Z z
z∗
dz
θ (z, t ). (3)
In Eqs. (2) and (3),Ŵ=gκ/Ris the dry adiabatic lapse rate. Equation (3) is solved by trapezoidal integration. At the fixed reference levelz∗, the initial valuep(z∗)is kept constant. A value ofz∗located in the middle portion of the cloud mini-mizes the impact of the pressure perturbations in the simula-tion.
The third step consists of calculating a new tem-perature profile from the updated p and θ fields via T (z, t )=θ (z, t )[p(z, t )/p0]κ, and a new air density
pro-file from the ideal gas lawc(z, t )=p(z, t )/[kBT (z, t )], with Boltzmann’s constantkB. Finally, gas, aerosol number, and aerosol solute and liquid water mixing ratios in each size bin are advected using the updatedcfield.
2.2 Aerosol growth, trace gas uptake, and freezing Background aerosol particle number concentrations and those of H2O, HNO3, and H2SO4 (per unit volume of air)
contained in these particles are discretized over radius bins in each altitude bin. While H2SO4is treated as an involatile
species in the STS particles, the amount of volatile material is allowed to change kinetically according to condensation and evaporation processes, mainly dictated by the evolution ofT (determining the gas solubility in the droplets) and the availability of the molecules in the gas phase.
The exact sizes of the liquid particles are computed by summing up volatile and (constant) nonvolatile contributions to the total particle volume. This Lagrangian approach is free of numerical diffusion. Total mass is exactly conserved be-tween the gas and aerosol phase in each altitude bin. Aerosol particles are not allowed to sediment owing to their small (sub-µm) sizes.
The production of ice crystals relies on the water-activity-based homogeneous freezing model for supercooled aerosols (Koop et al., 2000). The STS particles commence to freeze aboveSi values of 1.5, depending onT and on the local wa-ter activity in each droplet size bin, which is explicitly calcu-lated to allow effects of non-equilibrium aerosol composition to be taken into account. Although the APSCm-1-D allows to study the effects of heterogeneous ice nuclei on cloud for-mation and development, heterogeneous ice nucleation is not considered in this work.
During freezing of a liquid droplet, solute may be expelled to the surface and may even escape to the gas phase. It is assumed that the complete amount of HNO3 (and H2SO4)
residing in the droplets prior to freezing is retained in the ice crystals, but a sensitivity study will examine the effects of changing the retention coefficient upon the HNO3phase
partitioning. Of course, HNO3dissolved in liquid droplets
may evaporate in non-freezing droplets ifSi is reduced after ice formation.
2.3 Growth and sedimentation of ice crystals
The growth of ice crystals occurs via deposition of water va-por from the gas phase, using a similar diffusional growth law as for liquid aerosols but including the effects of habit and ventilation. Ice particles are hexagonal columns with an aspect ratio of 3 for diameters >25 µm and spheres for smaller sizes. Ventilation enhances sublimation and evapora-tion rates for large (>50 µm) crystals. The ice vapor pressure recommended by Murphy and Koop (2005) is used. Nitric acid uptake does not affect the crystal size owing to the low molar ratio of HNO3 to H2O (<10−4), but the amount of
HNO3 contained in individual ice crystals is tracked in the
code. The ice crystals sediment owing to gravitational accel-eration; their individual locations are obtained by integrating the difference between their size- and habit-dependent termi-nal fall speed and the local vertical wind over time.
To calculate ice crystal growth, a standard expression for the diffusional growth law (Eq. (15) in K¨archer, 2003) is ap-plied together with a fixed ice mass deposition coefficient of 0.5 (Haynes et al., 1992). Lowering this value would lead to more ice crystals while an increase would have little effect on the results. A fixed value for the deposition coefficient is a simplification. It is possible that real deposition coefficients to be used in conjunction with more sophisticated growth models could show very sensitive dependences on supersat-uration. However, such growth models valid for small ice crystals, low temperatures, and high supersaturations are not yet available (Nelson, 2005). On the other hand, the present approach is capable of explaining atmospheric observations in many cases (e.g., Haag et al., 2003a,b; Jensen and Pfister, 2004; Jensen et al., 2005a).
The nucleation, growth, and sedimentation of ice crystals is computed on a particle-by-particle basis (particle-in-cell code), whereby the laws describing depositional growth and combined vertical advection and sedimentation are solved for each individual crystal. The altitude and size where each ice crystal forms serve as the initial conditions to solve these laws, which are integrated with a simple Euler forward scheme. The variablesz,T,p,χw,χn required to compute the vapor and sedimentation fluxes are linearly interpolated to the exact locations of each ice crystal. This method per-mits the exact conservation of H2O and HNO3between the
gas phase and the ice crystals and eliminates any numerical diffusion during growth or fall. If an ice crystal evaporates below its initial size, it is removed from the calculation.
Liquid particles produce ice particles at their exact size at the point of freezing. The altitude at which ice particles form is randomized within the respective altitude bin.
In order to keep the code efficient, each simulation parti-cle is associated withN physical ice crystals. A lower limit
concentration n∗ is prescribed which determines the num-berN of individual ice crystals generated in the simulation.
Ifni crystals nucleate per cm3of air in a given altitude bin per time step,N=ni/n∗. The value ofn∗is a compromise between a good statistical representation of the crystal size distrubtions and the available computational resources. 2.4 Nitric acid-ice interaction
The interaction of gaseous HNO3with ice is simulated using
a novel uptake model that allows diffusion-limited trapping of molecules to compete with surface kinetic processes, de-pending on the relative magnitude of the time of adsorption and the ice crystal growth rate (K¨archer and Basko, 2004).
Experimental evidence exists for the fact that growing ice surfaces lead to enhanced uptake of HCl (Abbatt et al., 1992; Huthwelker, 1999). Very recently, evidence was found for significantly enhanced uptake of HNO3 by growing
rel-ative to static ice films (J. Abbatt and M. Ullerstam, per-sonal communication, 2005). These new laboratory mea-surements clearly support the main feature of the trapping model, namely that trace gases can effectively be taken up in growing ice particles even at low supersaturations.
The number of HNO3molecules taken up per unit time by
growing ice particles in the APSCm-1-D is given by dNn
dt =4π riDnκiφinnǫ(ri,r˙i, αn, βn, k, d) , (4) whereri is the effective spherical radius of the ice crystals, Dnis the diffusion coefficient of HNO3molecules in air,κiis the capacitance factor,φi is the ventilation factor,nn=χncis the molecular concentration of HNO3in the gas phase, andǫ
is the trapping efficiency. Contrary to equilibrium adsorption isotherms, the amount of trapped molecules in a cloud is a non-local quantity, depending on the history of individual ice crystals. This renders a detailed comparison with airborne observations difficult.
The trapping efficiency depends on the individual ice par-ticle growth rater˙i, the deposition coefficientαn=0.3 (Han-son, 1992) for HNO3molecules impinging on the ice surface,
and the escape ratekof HNO3molecules from the ice
sur-face. The second parameterd is tied to the existence of a surface layer at the moving air-ice interface. It is not dis-cussed here further. Finally,ǫcontains a size-dependent fac-torβn=[1+4Dnκi/(αnunri)]−1(unis the HNO3molecular
thermal speed) interpolating between the diffusion and ki-netic flow regimes.
In the simplest approach, k is interpreted as a desorp-tion rate in the form αnωexp[−Q/(kBT )]. As a baseline value for the latent heat of adsorption on ice,Q, a value of
10.5 kcal mol−1is used (Bartels-Rausch et al., 2002); Qis regarded as a fit parameter, as its correct magnitude depends on the choice of the exponential prefactor ω (taken to be 1013s−1). The trapping model requires independent valida-tion. The parameterskanddin the trapping model are poorly constrained and need to be fixed by measurements of gas up-take in growing ice films, as proposed by K¨archer and Basko (2004, their Sect. 5 for more details). Uncertainties arising from the above choice ofQwill be addressed in Sect. 3.4.
There exist two limiting cases of trapping. The key param-eterkd/r˙idescribes the effectiveness of escape of molecules from the ice surface versus ice particle growth. In the limit kd ≫ ˙ri, trapping is controlled by the kinetics at the ice surface, which determines the concentration of trace gas molecules that are subsequently buried by comparatively slowly growing ice layers. Equation (4) takes the form
dNn dt ≃4π r
2
ineqr˙i, (5) whereneqis the equilibrium concentration determined by the
balance between the adsorptive flux nnαnun/4 and the es-cape (desorption) fluxneqkd. The difference between these
two fluxes enters the trapping model as part of a boundary condition at the moving air-ice interface, and is essentially equivalent to a linear (i.e., unsaturated) adsorption isotherm. Whenkd≪ ˙ri, trapping is entirely controlled by the rate of diffusion of the HNO3molecules through the air toward the
ice particle, yielding dNn
dt ≃4π riDnκiφinnβn. (6) In this limit, trapping does not depend on the surface pro-cesses.
For evaporating ice crystals, the flux of HNO3molecules
leaving each ice crystal is set proportional to the H2O flux
times the molar ratio of HNO3and H2O in the crystal.
Recent measurements in subtropical cirrus have suggested that nitric acid trihydrate (NAT) might block active growth sites at the surfaces of cirrus ice crystals below 205 K, lead-ing to a perturbed steady-state between H2O vapor and ice
accompanied by a persistent in-cloud supersaturation (Gao et al., 2004). As the detailed mechanism by which the ice crystal growth properties are changed by NAT is currently not known, the potential for this effect to occur in polar cir-rus is not investigated here.
3 Results and discussion
3.1 Observation and initialization
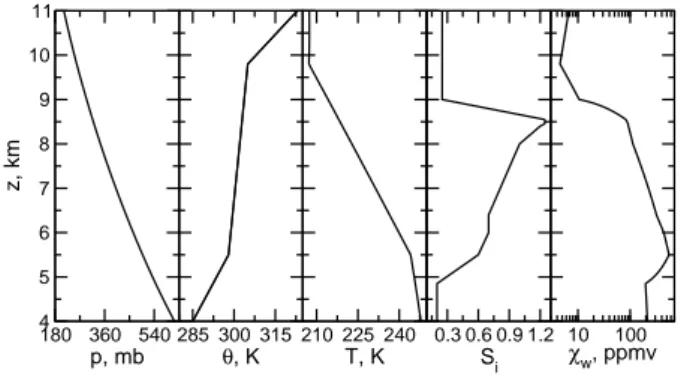
180 360 540 p, mb 4 5 6 7 8 9 10 11
z, km
285 300 315
θ, K
210 225 240 T, K
0.3 0.6 0.9 1.2
Si
10 100
χw, ppmv
Fig. 1. Prescribed vertical profiles of potential temperatureθ, air temperatureT, and ice saturation ratioSi, and inferred profiles of air pressurepand H2O gas volume mixing ratioχwused to initial-ize the 7 h simulation describing the formation (via homogeneous freezing) and evolution of an Arctic cirrostratus cloud. The initial HNO3mixing ratio (not shown) is set constant,χn=1 ppbv.
been studied numerically, with a focus on nucleation path-ways (Lin et al., 2005). The foci of the two complemen-tary model studies are thus substantially different from each other.
As described in more detail by Lin et al. (2005), the cloud system was associated with a strong northwesterly jet stream and a surface warm front. While the cloud drifted across the measurement site, the lidar backscatter data show that its top was lifted from 8.5 km to more than 10 km within 7 hours at an almost constant rate. Values for the updraft speed in the range 4–6 cm s−1can be estimated from the observed cloud top heights.
Figure 1 presents the initial vertical profiles ofθ,T, andSi (R.-F. Lin and J. Reichardt, personal communication, 2004), along with the derived pressure and H2O gas mixing ratio
profiles. To advect the species and drive the formation of the cloud, a spatially uniform vertical wind speed ofw=5 cm s−1 is prescribed throughout the simulation which extends over 7 h.
The initial profiles are based on radiosonde data, taken 250 km downwind of Kiruna and 2 hours after the cloud formed. TheSi profile has been tuned by Lin et al. (2005) together with the imposed vertical ascent rate such that the large-scale cloud development could be reproduced. It is possible that processes controlling the small-scale develop-ment of the cloud (waves, turbulence, latent heat release) in-fluence its simulated properties. Uncertainties arising from small-scale processes unresolved in the present simulations will be discussed in following sections.
The APSCm-1-D uses a vertical domain extending from 4 to 11 km, divided into 2100 bins, i.e.,1z=3.3 m. The pres-sure reference altitude isz∗=8.5 km. The time step is fixed to 2 s. The minimum number of ice crystals resolved by the code isn∗=5×10⁻⁵cm−3. The maximum number of simu-lation particles is about 160 000, with∼3.5 physical ice crys-tals per simulation particle.
The number of radius bins over which the lognormal aerosol number and component size distributions are dis-cretized is 25, starting at a radius of 5 nm. The bins increase geometrically in size with a bin volume ratio of 2.25. In to-tal, 103 (4×25 aerosol + 2 gas + 1 meteorological) tracers are advected. For plotting purposes, an ice crystal size grid is defined with 50 bins and a bin volume ratio of 1.75. The H2O/H2SO4/HNO3particles have a total number density of
200 cm−3, a mean number radius of 0.02 µm, and a width of 2.3. The results are not sensitive to the specific choice of these aerosol parameters.
The most important feature seen inSi(z)in Fig. 1 is the tongue of moist, supersaturated air centered at 8.5 km. As shown below, the first cloud particles begin to form right above this altitude.
3.2 Ice supersaturation and microphysical properties The evolution of the column-integrated ice crystal number densities, ice water path, and optical depth (not shown here), as well as the temporal development of the vertical distri-bution of ice water content and ice crystal number density of the Arctic cirrostratus calculated with the APSCm-1-D agree well with those presented by Lin et al. (2005). It is encouraging that the two models generally lead to similar results for homogeneous freezing in Arctic cirrostratus con-cerning basic cloud microphysical properties, although they are conceptually different (size-segregated representation of ice crystals versus particle-in-cell code) and rely on thermo-dynamic functions derived from different sources (freezing rate coefficients and aerosol vapor pressures). Slightly more crystals form in the present simulation which may be caused by small differences in the homogeneous freezing rates.
Figure 2 shows the ice saturation ratio (left panel, top) and the ice crystal number densityni(right panel, top) as a func-tion of height and time. The steady uplift increasesSi which attains its maximum value 1.52 at 216 K after about 1 h at 8.75 km. The fact thatSi then declines rapidly at this level indicates that ice crystals have formed. The region in which homogeneous freezing is active lies within theSi=1.4 con-tour line.
Crystal concentrations reach values up to 0.4 cm−3within 20 min in the early formation zone. High Si values are transported upwards and define a rather thin cloud top layer, which is characterized by continuous formation of ice crys-tals throughout the simulation. In the rising top layer,ni in-creases with altitude up to 0.12 cm−3because of declining temperatures.
Below the initial formation layer, homogeneous freezing also occurs but only up to ∼140 min. The termination of freezing there is caused by sedimenting ice crystals that quickly deplete the gaseous H2O reservoir in the highly
4 5 6 7 8 9 10 11
z, km
0 60 120 180 240 300 360 420
t, min
0.7
0.7
1.1
1.1 1.1
1.1
1.4 1.4
1.4
0.0 0.2 0.4 0.6 0.8 1.0 1.2 1.4 1.6
Si
4 5 6 7 8 9 10 11
z, km
0 60 120 180 240 300 360 420
t, min 0.01
0.01
0.01
0.00 0.05 0.10 0.15 0.20 0.25 0.30 0.35 0.40
ni, cm3
4 5 6 7 8 9 10 11
z, km
0 60 120 180 240 300 360 420
t, min
0 2 4 6 8 10 12
ni ri, µm/cm3
4 5 6 7 8 9 10 11
z, km
0 60 120 180 240 300 360 420
t, min
0 500 1000 1500 2000 2500 3000 3500 4000
Ai, µm2/cm3
4 5 6 7 8 9 10 11
z, km
0 60 120 180 240 300 360 420
t, min
0 15 30 45 60 75 90 105 120
ri, µm
4 5 6 7 8 9 10 11
z, km
0 60 120 180 240 300 360 420
t, min
0 5 10 15 20 25 30 35 40
IWC, mg/m3
0.2 0.4 0.6 0.8 1 1.2 1.4 1.6
Si
0 0.02 0.04 0.06 0.08 0.1 0.12
P(S
i
)
all outside inside
1.2 1.3 1.4 1.5 1.6
0.001 0.01
all outside inside
Fig. 3. Probability distributions of ice saturationSi taken inside and outside the cloud as well as the total probability averaged over the entire computational domain (0–7 h, 4–11 km. The distributions are normalized to the respective total number of data points in each case. The inset enlarges the highly supersaturated tail of the distri-butions.
theSi=1.1 contour line). Between the top layer and the fall streak, saturation ratios as high as 1.25 build up (8.5–10 km at 7 h), because the crystals forming above are too small to fall into this layer and the early-forming crystals have already fallen out of it.
Theni=0.01 cm−3contour line indicates that low concen-trations prevail in the regions away from the top layer and the fall streak. At the cloud base,niexhibits a sharp increase, be-cause crystals fall in already subsaturated air (see theSi=0.7 contour line) and evaporate. The resulting reduction of their terminal fall speed causes the formation of this thin, concen-trated layer.
Figure 2 also shows the evolution of the product niri determining the relaxation times of the in-cloud ice super-saturation as discussed below (left panel, middle) and the specific cloud surface area density Ai (right panel, mid-dle). Typical values forAi within the fall streak reach up to 4000µm2cm−3, while the region below the fall streak is characterized by values in the range 500–1000µm2cm−3. Values of Ai in the cloud top region near the tropopause never exceed a few 100µm2cm−3.
Contrary to the conjecture of Reichardt et al. (2002), su-persaturation with respect to ice occurs at times in this type of cloud. This is best illustrated with the help of Fig. 3 showing the probability distributions ofSi in the total computational domain (4–11 km, 0–7 h) as a black histogram, together with the distributions taken inside (blue histogram) and outside (red histogram) of the cloud.
The out-of-cloud distribution reflects the initialSi-profile and the action of adiabatic cooling consistent with the re-gions void of ice in Fig. 2, with a maximum between Si=0.2−0.4. The in-cloud distribution peaks in the
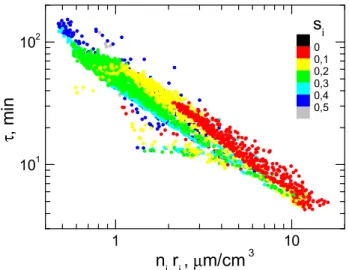
super-τ
µ
Fig. 4. Scatter plot of ice supersaturation relaxation timesτ as a function ofniri. The symbols are color-coded by the respective supersaturationssi=Si −1. The data points are representative for the relaxation phase in and below the fall streak region of the cloud.
saturated region, betweenSi=1−1.2, indicating that most of the ice crystals experience growth conditions.
It is very interesting to note that some crystals survive in strongly subsaturated air, down toSi=0.35, as seen by the left tail of the in-cloud distribution. This can happen because large ice crystals need quite a long time to fully evaporate at low temperatures while falling through subsaturated lay-ers. The existence of ice in rather dry air has been demon-strated in in-situ observations of midlatitude cirrus (Str¨om et al., 2003).
Finally, the total distribution is a blend of the in-cloud and out-of-cloud parts, and contains both the dry and moist maxi-ma. The distributions exhibit several salient features, such as the dry and moist maxima and the quasi-exponential tails in supersaturated air (K¨archer and Haag, 2004), but their de-tailed shapes depend on the sampling process. The highSi -tails are shown enlarged in the inset in Fig. 3. The peakSi in-side cloud is about 0.05 higher than the maximumSioutside cloud because of ongoing cooling during nucleation. Such differences are also seen in freezing chamber measurements (Haag et al., 2003a) and in distributions ofSi taken in the field within and nearby cirrus clouds (Haag et al., 2003b).
The main reasons responsible for the high in-cloud rela-tive humidities are (i) the continuous (albeit relarela-tively slow) cooling which produces supersaturation in regions where the ice crystal concentrations are low and (ii) the low tempera-tures which lead to rather slow removal rates of gaseous H2O
on growing ice particles.
1 10 100
r, µm
10-3
10-2
10-1
r dn
i
/dr, cm
-3
> 9 km 6 - 9 km < 6 km
3.5 h
1 10 100
r, µm
10-3
10-2
10-1
r dn
i
/dr, cm
-3
> 9.5 km 5 - 9.5 km < 5 km
7 h
Fig. 5.Average ice crystal size distributions after 3.5 (left) amd 7 h (right) extracted from the cloud top or formation regions (red), the cloud base or evaporation regions (blue), and the cloud interior (black). At 3.5 h (7 h), the lower and upper cloud boundaries are located at 5.51 (4.69) km and 9.41 (10.23) km.
each vertical level within and below the fall streak (as visible inni(z, t )in Fig. 2) wheneversi>0 according to
τ =1
si
dsi dt
−1
. (7)
This definition ofτincludes both a deposition term (reducing siin proportion toniri in the diffusional growth limit) and a cooling term (increasingsi in proportion to the updraft speed w). It describes relaxation toward a steady-state in which cooling is balanced by deposition (see Appendix for more details). For a developed, non-evaporating cloud the cooling term is negligible, so thatτ∝1/(niri), describing relaxation toward the equilibrium ice saturation.
In Fig. 4, points with|dsi/dt|<5×10−5 are excluded to eliminate cases with excessively high τ. Theτ-values are color-coded by si. The results show that τ generally de-creases inversely proportional toniriin the relaxation phase, as expected, and ranges between 4–150 min. These rather long timescales are mainly caused by the low temperatures, and render the high in-cloud supersaturations (0.1–0.3) as discussed above plausible (red, yellow, and green symbols). The highest supersaturations (0.4–0.5) only occur prior to ho-mogeneous freezing (dark blue and gray symbols) and are comparatively rare events. As a general trend,τ-values with highsi (gray and bluish colors) associated with fresh nucle-ation events appear over the entire range ofniri, depending on nucleation conditions. For aging clouds increases inniri are correlated with decreases insi (red, yellow, and green colors), indicative of depositional growth.
These findings are in general agreement with results pre-sented by Jensen et al. (2005a) for the case of a subtropical tropopause cirrus layer developing in similar ambient condi-tions, but driven by mesoscale temperature fluctuations. In particular, high ice supersaturations are only found in homo-geneous freezing regions or when ice crystals sediment into supersaturated air.
3.3 Ice crystal size distributions and dehydration
Also shown in Fig. 2 are the mean values of the effective spherical radius ri of ice crystals (left panel, bottom) and the cloud ice water content IWC (right panel, bottom). At the cloud top, where homogeneous freezing is active, crys-tal radii are small (10–30 µm). They are also small in the slightly supersaturated fall streak initially, but grow to sizes of ∼80 µm towards the end of the simulation. The biggest crystals (120 µm) appear after 3 h at rather low altitudes (∼6 km); these few crystals were produced earliest and could fall sufficiently long through the highly supersaturated layer below the initial formation zone. They slowly evaporate while sedimenting further down.
The cloud base is characterized by the sharp decrease of ri, as is the cloud top. At intermediate altitudes, away from the fall streak, the cloud is very tenuous, withni values of 0.01 cm−3or less andriin the range 20–60 µm. Correspond-ingly, the IWC distribution shows a maximum along the fall streak and around the 6 km level after 3 h.
A precise knowledge of the vertical distribution of ice crystals as a function of their size is required for the use of radiative cirrus models and the improvement of satellite re-trieval algorithms. The crystal size distributions at different times and locations are quite variable. It is therefore instruc-tive to inspect these size distributions after 3.5 and 7 h aver-aged over the cloud top region, the cloud base region, and in the cloud interior with the help of Fig. 5.
4 5 6 7 8 9 10 11
z, km
0 60 120 180 240 300 360 420
t, min
15
65
360
360
0 70 140 210 280 350 420 490 560
χw(g), ppmv
4 5 6 7 8 9 10 11
z, km
0 60 120 180 240 300 360 420
t, min
0.00 0.45 0.90 1.35 1.80 2.25 2.70
χn(g), ppbv
4 5 6 7 8 9 10 11
z, km
0 60 120 180 240 300 360 420
t, min
0.0 0.1 0.2 0.3 0.4 0.5 0.6 0.7
χn(a), ppbv
4 5 6 7 8 9 10 11
z, km
0 60 120 180 240 300 360 420
t, min
0.00 0.25 0.50 0.75 1.00 1.25 1.50 1.75 2.00
χn(i), ppbv
Fig. 6. H2O gas mixing ratioχw(top left), HNO3gas mixing ratioχn(top right), HNO3aerosol mixing ratio (bottom left), and HNO3 ice mixing ratio (bottom right) as a function of altitude and time. The baseline valueQ=10.5 kcal mol−1is assumed to describe HNO3-ice interaction. The amount of HNO3residing in the liquid particles prior to freezing is retained in the ice phase.
analysing data from optical particle probes for ice crystals with sizes below 10 µm do not allow a closer comparison to be made. The small particles sediment only slowly with ter-minal fall speeds below 360 m/h, or below 180 m/h relative to the uplift. The cloud base region has received the few large crystals that formed first (see above). In the cloud re-gion between top and base, the size spectrum extends from 20–100 µm; the peak at 30 µm belongs to the numerous crys-tals within the fall streak.
While the situation at the cloud top after 7 h (right panel) has not changed significantly because homogeneous freez-ing is continuously active, small ice crystals are now absent throughout most of the cloud interior and the radii range be-tween 30 and 100 µm. It is possible that the real Arctic cloud contained even larger crystals formed by aggregation, a
pro-cess not included in this model. In contrast to the earlier cloud stage, the cloud base region now also contains a few µm-sized crystals produced by evaporation. The size spec-trum there is noisy at the low size end because evaporation is rapid.
Figure 6 gives an overview of the evolution of H2O and
HNO3 gas mixing ratios (top panel) and the HNO3
con-tent in STS and cirrus particles (bottom panel) expressed in equivalent air volume mixing ratios. The initial H2O
pro-file shown in Fig. 1 appears to be purely advected prior to cirrus formation, indicating that the aerosol water content is neglible compared to total water. As soon as ice forms, gas phase H2O is quickly transferred to the ice phase, as
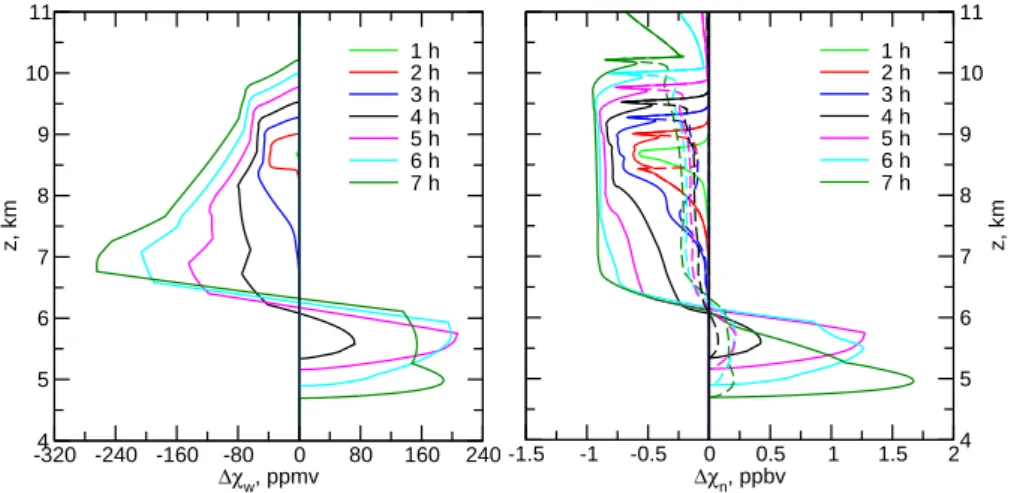
-320 -240 -160 -80 0 80 160 240
∆χw, ppmv
4 5 6 7 8 9 10 11
z, km
1 h 2 h 3 h 4 h 5 h 6 h 7 h
-1.5 -1 -0.5 0 0.5 1 1.5 2
∆χn, ppbv
4 5 6 7 8 9 10 11
z, km
1 h 2 h 3 h 4 h 5 h 6 h 7 h
Fig. 7.Vertical profiles showing the combined result of sequestration of H2O (left) and HNO3(right) in STS particles and ice crystals and the subsequent sedimentation (in the case of ice) and evaporation of these particles at selected cloud ages. The initial profile of total HNO3 is constant,χn(z)=1 ppbv, and gaseousχw(z)decreases with altitude as shown in Fig. 1. Shown are the differences1χbetween the actual profiles of gas phase H2O and HNO3and the respective initial profiles advected as passive tracers. The excursions to positive1χ-values at the lower altitudes show that rehydration and renitrification occurred. The respective evolutions of condensed-phase H2O and HNO3 are shown in Figs. 2 and 5, respectively. Solid curves correspond to Fig. 5 (baseline valueQ=10.5 kcal mol−1) and dashed curves assume
Q=9 kcal mol−1mimicking less efficient uptake of HNO3on ice.
there is moistened again toward the end of the simulation (χw=360 ppmv contour line).
To further examine the vertical redistribution of H2O and
HNO3, the initial mixing ratiosχw(z)andχn(z)are advected
as passive tracers (no interaction with particles), yielding χt
w(z, t ) andχnt(z, t ). The difference 1χw=χw−χwt then describes the affect of ice uptake and sedimentation on H2O
and is shown in Fig. 7 at selected cloud ages. This approach describes the potential for dehydration and denitrification to occur.
The H2O profiles (left panel) show clear signs of cloud
formation, starting in the nucleation region around 8.5 km after 1 h. In the course of time, ice water is produced within an increasing vertical column, until after 4 h, H2O molecules
evaporate back to the gas phase in the cloud base region. Re-calling the absolute H2O mixing ratios from Fig. 6, this
Arc-tic cloud causes a substantial drying of upper tropospheric air, supporting the tentative interpretation of the cause of low water contents observed in the Arctic upper troposphere and lower stratosphere region (Murphy et al., 1990; Kelly et al., 1991; Schiller et al., 1999; Pfister et al., 2003).
The present work shows that mesocale temperature fluc-tuations driven by buoyancy waves unresolved in the present study are not necessarily required to explain persistent in-cloud supersaturation, but may cause more frequent acti-vation of homogeneous freezing by broadening the distri-butions of relative humidity in the supersaturated regions (K¨archer and Haag, 2004). This is consistent with other model studies suggesting that cirrus formation mostly takes place in synoptic cold pools, but with microphysical prop-erties controlled by mesoscale dynamical variability
prevail-ing in these synoptic-scale ice supersaturated regions (Jensen and Pfister, 2004; Haag and K¨archer, 2004).
The addition of small-scale fluctuations will lead to more but smaller ice crystals. Dynamical variability at the scale of the cloud may at least in part be responsible for the multiple fall streaks visible in the observed Arctic cirrostratus (Re-ichardt et al., 2002), but are missing in the present simula-tion. It is not fully clear whether the inclusion of unresolved dynamical variability reduces the potential of the cloud to vertically transport H2O (and HNO3, see next section) due to
lower ice crystal sedimentation speeds. An increased num-ber of nucleation events and multiple falls streaks could over-compensate this effect. To include realistic forcing patterns (e.g., variations in vertical winds and temperatures on hori-zontal scales at or below∼1–10 km) is beyond the scope of this study but will be examined in future work.
3.4 Nitric acid uptake and denitrification
A comparison of χn(g) and χn(a) in Fig. 6 reveals that little HNO3 partitions in STS particles when T stays
be-low the frost point near the cold tropopause (K¨archer and Solomon, 1999). Uptake in STS particles becomes relevant whenSi>1.2–1.3, which can be seen by comparing the shape of enhancedχn(a)-values with the Si=1.4 contour line in Fig. 2. When ice particles form, more HNO3molecules
par-tition in ice crystals, in particular within the fall streak re-gion as indicated byχn(i). In the course of time, the region into which ice crystals sediment from the cloud top is char-acterized by very low HNO3gas phase mixing ratios, while
HNO3 is released back to the gas phase in the cloud base
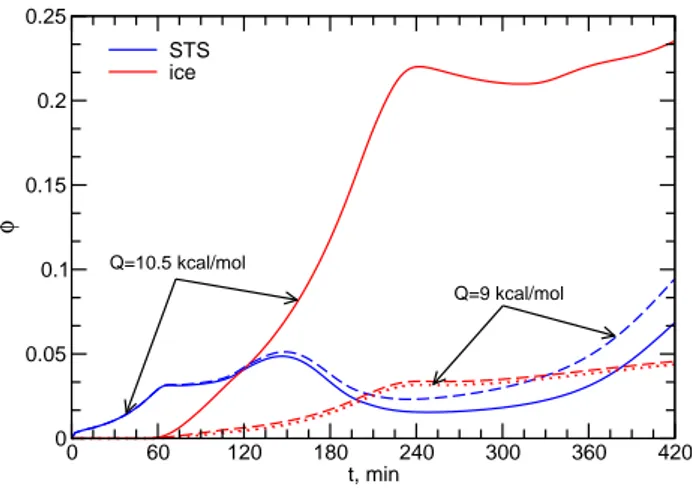
0 60 120 180 240 300 360 420 t, min
0 0.05 0.1 0.15 0.2 0.25
φ
STS ice
Q=10.5 kcal/mol
Q=9 kcal/mol
Fig. 8.Column-integrated phase partitioning fractionsφof HNO3
in the liquid ternary aerosol (blue curves) and ice (red curves) par-ticles for the baseline case (solid curves) and the case with less ef-ficient HNO3uptake on ice (dashed curves) for which also a model run assuming no retention of HNO3is shown (dotted curve).
In Fig. 7 (right panel), the difference 1χn=χn−χnt de-scribes the affect of dissolution in STS particles and ice up-take and sedimentation on HNO3. The HNO3profiles in the
baseline case (solid curves) likewise show clear signs of up-take in cirrus particles and resulting denitrification, and ren-itrification in the cloud base region. The cloud amount suf-fices to practically partition all available HNO3 (1 ppbv) in
the ice phase. The amount of HNO3taken up over a region
extending from 6–9 km within 4 h is evaporated within an only 1.5 km thick region at mid-tropospheric levels, increas-ing the mixincreas-ing ratios there by more than 150%.
A difference to the water uptake is that a significant amount of HNO3is also taken up by the STS particles prior
to freezing (before 1 h) and throughout the simulations in re-gions where T is low andSi is high and void of crystals (above the cloud top and near the cloud edges), consistent with Fig. 6. As soon as ice forms,Si (and thus the HNO3
vapor pressure) is reduced, driving HNO3out of the liquid
solution droplets back into the gas phase, where it is avail-able for uptake on the growing ice crystals. The sharp peak in the1χn-curves in Fig. 7 marks this transition region, and is carried upwards by the continuous uplift where it becomes more pronounced because of the lowerT higher up.
In the trapping model used to predict the HNO3
interac-tion with growing ice crystals (recall Sect. 2.4), theQ-values which mainly determine the time of adsorption 1/ k are not well known. The partitioning of HNO3in cirrus can be
sen-sitive to variations ofQ, so it is illustrative to study results obtained with a different choice of this parameter.
Figure 7 shows almost complete removal of HNO3
from the gas phase in the mature cloud. The case with Q=9 kcal mol−1, that is, with shorter times of adsorption, is also shown (dashed curves). The effects on the HNO3
pro-files are quite dramatic; throughout most of the cloud col-umn, gas phase mixing ratios are now reduced by no more than 0.25 ppbv. Consequently, denitrification is much less pronounced, reaching similarly weak enhancements below 6 km altitude after 4 h.
The main reason for this strong sensitivity on the vertical distribution of HNO3is that uptake is neither fully controlled
by gas diffusion nor by surface processes forQ-values in the region 8–12 kcal mol−1(K¨archer and Basko, 2004). Under the conditions relevant to this study, the trapping efficiency switches between the two limiting cases of pure diffusional trapping and trapping of equilibrium surface concentrations represented by Eqs. (5) and (6), respectively.
The following estimates serve to illustrate this point. The number of HNO3 molecules that would escape from
a static surface at T=210 K is given by k≃35(1290)s−1 for Q=10.5(9)kcal mol−1. The more ice layers that are added in a given time interval, the less likely it be-comes for adsorbed molecules to escape from the sur-face. The number of ice monolayers added per second is given byr˙i/(vwσw)≃7 s−1with the specific volume of H2O
molecules in ice vw=3×10⁻²³cm3, the maximum num-ber of surface sites for water deposition σw=1015cm−2, and the standard diffusional growth rater˙i≃0.13 µm min−1 evaluated at 210 K, p=220 hPa, ri=10 µm, and si=0.05. This shows that trapping is much less effective for Q=9 kcal mol−1as the time of adsorption decreases by a fac-tor of 35/1290≃0.03 compared to the baseline case.
Figure 8 depicts the phase partitioning fractions φ of HNO3into STS particles and ice crystals integrated over the
entire vertical column (4–11 km) as as function of time. For bothQ-values, similar amounts of HNO3dissolve in the
liq-uid particles initially, but somewhat more HNO3partitions in
the aerosol phase whenQis lowered and uptake into ice is reduced (dashed curves). Toward the end of the simulation, φin aerosols starts to increase quite rapidly. This is caused by the very low temperatures above the cloud top (<205 K), favoring nearly complete dissolution of HNO3 in the STS
particles in the absence of cloud ice (see also Fig. 6). In the tropopause region, significantly more HNO3can dissolve
when ammonium is additionally present in the background aerosol particles, depending on the degree of ammoniation (K¨archer and Solomon, 1999). In any case, the amount of HNO3contained in them would be released back to the gas
phase roughly at the same altitudes as soon asT rises above the HNO3dew point temperature.
While for the baseline case trapping in ice becomes more important than dissolution in STS particles after 120 min and reaches an average level of∼20%, this happens only after 210 min in the case with reduced ice uptake, where less than 5% of the HNO3molecules are associated with the ice phase.
The dotted curve forφ in ice has been obtained by set-ting the HNO3 retention coefficient equal to zero in the
released to the gas phase and is not fully retained in the newly formed ice crystals. (Recall that the other curves assume full retention.) Here, φ in ice is slightly reduced and correspondingly more HNO3partitions in the gas phase.
In contrast, a zero retention coefficient has no effect on the Q=10.5 kcal mol−1 result (not shown in Fig. 8). This is because the HNO3 molecules released to the gas phase
upon freezing are quickly trapped in the growing, newly formed ice crystals, while this trapping is less efficient in theQ=9 kcal mol−1case. Hence it may be concluded that uncertainties in retention factors only affect species that do not adsorb efficiently on ice surfaces in cold cirrus.
Before addressing pending uncertainties, the predictions of the trapping concept are compared to the more conven-tional approach of calculating the amount of HNO3
associ-ated with cirrus ice particles by assuming a local equilibrium between adsorption and desorption at the surfaces of ice par-ticles, but not allowing the amount absorbed to be trapped during ice growth as if the ice crystals stayed at saturation. This approach mimicks the way most field measurements of HNO3 uptake have been analyzed in the past (e.g., Kondo
et al., 2003; Ziereis et al., 2004; Popp et al., 2004).
Dissolution of HNO3 into STS particles is treated as
be-fore. The remaining partial pressurepn,T, and the ice sur-face area densityAithen determine the amount per cm3of air that would be adsorbed in equilibrium at a static surface ac-cording toAiσn2(T , pn), where the choiceσn=1015cm−2 maximizes the number of available surface sites for adsorp-tion of HNO3and2is the fractional surface coverage
cal-culated from the equilibrium isotherm (see above). Here, as in many previous analyses, a saturated, dissociative Lang-muir isotherm determines the functional form of2, with the same parameters as given by Popp et al. (2004), except for Q, which is set equal to 10.5 kcal mol−1 as in the trapping case.
Figure 9 repeats the solid curves from Fig. 8 for the base-line case, but includes results from the conventional approach as dashed curves. In the latter case, the amountφof HNO3
associated with cirrus particles reaches only 0.4 % after 7 h, compared to 20 % in the trapping scenario. The increased amount of HNO3 in the gas phase leads to an increase of
HNO3dissolved in STS particles. These results demonstrate
that without trapping, the amount of cirrus-bound HNO3will
be underestimated.
However, the current state of knowledge does not al-low robust conclusions to be drawn. Dissociative Langmuir isotherms may not be appropriate to describe HNO3
adsorp-tion, although they seem to fit2-data inferred from cirrus-bound HNO3measured in the field reasonably well. Recent
laboratory equilibrium studies have revealed that for typi-cal upper tropospheric HNO3partial pressures (<10−7hPa),
the amount of adsorbed HNO3is better described by a
non-dissociative Langmuir isotherm (Ullerstam et al., 2005). The trapping model as employed here is based on an unsaturated, non-dissociative Langmuir isotherm (recall
0 60 120 180 240 300 360 420
t, min
10-3
10-2
10-1
φ
STS ice
trapping
adsorption equilibrium
Fig. 9. As Fig. 8, again with the solid curves representing the
baseline case but now on a logarithmic scale. The dashed curves have been obtained by assuming instantaneous adsorption equilib-rium of HNO3on ice according to a saturated dissociative Langmuir isotherm, as frequently done in the interpretation of updake data.
Sect. 2.4), but the initial HNO3mixing ratio of 1 ppb,
corre-sponding to(2−3)×10−7hPa, is high enough for saturation effects to become important. It is thus necessary to gener-alize the trapping model to include saturated adsorption in order to properly cover the high pressure regime.
If trapping of HNO3 takes place near the
adsorption-limited regime governed by Eq. (5), it is possible that in-formation about the form of the adsorption isotherm is “con-served” during trapping. This could potentially explain why 2-values inferred from measured HNO3contents in ice
parti-cles resemble adsorption isotherms. Much of the scatter seen in inferred2may then be caused by trapped HNO3.
How-ever, a sound comparison with field measurements is only possible after the yet poorly constrained model parameters have been fixed.
4 Conclusions
Using a relatively well documented case study of a long-lived, geometrically and optically thick Arctic cirrostratus cloud as a basis, the processes controlling supersaturation, cloud microphysical properties, and the potential for dehy-dration and denitrification of upper tropospheric air have been examined with the help of a one-dimensional cirrus cloud model with explicit aerosol and ice microphysics. The specific results are summarized as follows.
1. Continuous weak cooling of air in regions with small amounts of ice and slow ice deposition rates of water vapor at low temperatures drive significant in-cloud su-persaturations over ice.
region near the tropopause, broad but highly variable size spectra in the cloud interior, and mostly large crys-tals in the cloud base region. At and below the cloud base, broadening of the size distribution occurs due to evaporating ice crystals.
3. Large ice crystals may survive falling through even strongly subsaturated cloud layers, because they need a long time to fully evaporate at low temperatures. 4. Weakly forced, vertically extended polar cirrus clouds
are highly efficient at dehydrating the upper tropo-sphere. They could also denitrify upper tropospheric air masses efficiently.
5. Low temperatures, high supersaturation ratios over ice, and the absence of ice above but close to the cloud top region causes efficient uptake of nitric acid in back-ground supercooled ternary solution particles.
The above results stimulate further research in this area and should be considered in the future.
The findings that Arctic cirrus can significantly dehydrate and possibly denitrify upper troposphere air masses have been quantified in a single cloud simulation. However, a global quantification of these effects and its impact on the trace gas budget of the upper troposphere and lowermost stratosphere ultimately requires either a large number of such 1-D simulations similar to the statistical approach employed by Jensen and Pfister (2004) or truly three dimensional sim-ulations.
It is possible that both small-scale dynamical forcings and heterogeneous ice nuclei modulate the cloud evolution. Lin et al. (2005) point out that the complex small-scale struc-ture of weakly forced cirrostratus may entirely result from the action of ice nuclei when heterogeneous nucleation is assumed to be the dominant ice formation path. However, small-scale dynamical variability not included in their study will also contribute to the detailed cloud structure (Haag and K¨archer, 2004) so that the role of heterogeneous ice nucle-ation remains unclear.
Further, the present study shows that strong uptake of HNO3in liquid aerosols may occur in cirrus conditions and
that this process should be considered in the interpretation of field measurements. It would be interesting to examine the phase partitioning of HNO3in the presence of cirrus ice
crystals and ammonium in the background aerosol, as am-moniated sulfate particles are capable of dissolving greater amounts of HNO3 than STS particles under similar
condi-tions. Field measurements point towards the presence of in-terstitial ammonium sulfate aerosols in polar cirrus (Petzold et al., 2000; Romakkaniemi et al., 2004). As a first step, an equilibrium study could help isolate parameter regions where enhanced dissolution of HNO3 in aerosols occurs, perhaps
even in the presence of substantial amounts of cloud ice.
The present case study demonstrates that detailed com-parisons with laboratory measurements of HNO3uptake on
growing ice and with suitable field data are required to bet-ter constrain open paramebet-ters of the trapping model. This will ultimately lead to a better understanding of the role of cirrus in determining the budget and vertical distribution of nitrogen oxides in the upper troposphere.
Finally, the existence of high supersaturations inside and nearby cirrus clouds at the cold tropopause has potentially important implications for heterogeneous halogen chemistry, as reaction rates on cold STS droplets and ice crystals are very large in such conditions (K¨archer and Solomon, 1999; Meilinger et al., 2001). The vertical distribution of ice crys-tal size spectra from detailed microphysical simulations of Arctic cirrus may help improve calculations of their radiative forcing.
Appendix: Ice saturation relaxation timescale
The goal is to derive an approximate expression for the re-laxation time τ of si=Si−1 valid for isothermal and iso-baric conditions in order to compare it with numerical results shown in Fig. 4. Starting point is the balance equation for the ice saturation ratioSi, as noted by K¨archer and Lohmann (2002):
dSi
dt =a1wSi −(a2+a3Si)R , (8) where a1, a2, a3 are p- and T-dependent constants (with
a1∼10−5cm−1),wis the vertical velocity, andR is the
de-positional growth term
R=4π niriDwκiφiei(Si−1)=a4(Si−1) (9) in the diffusion limit which is mostly realized in this study. Here,Dw is the diffusion coefficient for H2O molecules in
air, κi is the capacitance factor, φi the ventilation factor, andei=1/a2 is the H2O vapor number density at ice
satu-ration. Only for small deposition coefficients (<0.1) and/or very small ice crystals (<1 µm)R would scale in proportion to the cloud surface area densityAi.
Using the fact thata3Si<a2, the balance equation can be
cast into the form dsi
dt =A+Bsi =A− si
|τ|, (10)
whereA=a1wandB=a1w−a2a4. Growth during relaxation
requires thatB<0, viz.
τ = 1
4π niriDκiφi−a1w
>0. (11)
The cooling terma1w is usually much smaller than the
Acknowledgements. This work was funded, in part, by the European Commission within the Integrated Project “Stratosphere-Climate Links With Emphasis on the UTLS” (SCOUT-O3). The author is grateful to C. Voigt, P. Popp, R.-S. Gao, D. Fahey, J. Hendricks, R.-F. Lin, J. Reichardt, F. Stroh, and T. Corti for scientific exchange and discussions.
Edited by: U. P¨oschl
References
Abbatt, J. P. D., Beyer, K. D., Fucaloro, A. F., McMahon, J. R., Woolridge, P. J., Zhang, R., and Molina, M. J.: Interaction of HCl vapor with water-ice: Implications for the stratosphere, J. Geophys. Res., 97, 15 819–15 826, 1992.
Bartels-Rausch, T., Eichler, B., Zimmermann, P., G¨aggeler, H. W., and Ammann, M.: The adsorption enthalpy of nitrogen oxides on crystalline ice, Atmos. Chem. Phys., 2, 235–247, 2002,
SRef-ID: 1680-7324/acp/2002-2-235.
Borrmann, S., Solomon, S., Dye, J. E., and Luo, B.: The potential of cirrus clouds for heterogeneous chlorine activation, Geophys. Res. Lett., 23, 2133–2136, 1996.
Curry, J., Rossow, W. B., Randall, W., and Schramm, J. L.: Overview of Arctic cloud and radiation characteristics, J. Clim., 9, 1731–1764, 1996.
Curry, J., Hobbs, P. V., King, M. D., Randall, D. A., Minnis, P., Isaac, G. A., Pinto, J. O., Uttal, T., Bucholtz, A., Cripe, D. G., Gerber, H., Fairall, C. W., Garrett, T. J., Hudson, J., Intrieri, J. M., Jakob, C., Jensen, T., Lawson, P., Marcotte, D., Nguyen, L., Pilewskie, P., Rangno, A., Rogers, D. C., Strawbridge, K. B., Valero, F. P. J., Williams, A. G., and Wylie, D.: FIRE Arctic Clouds Experiment, Bull. Amer. Meteorol. Soc., 81, 5–29, 2000. Del Guasta, M., Morandi, M., Stefanutti, L., Stein, B., Kolenda, J., Rairoux, P., Wolf, J. P., Matthey, R., and Kyro, E.: Multi-wavelength lidar observation of thin cirrus at the base of the Pinatubo stratospheric layer during the EASOE campaign, Geo-phys. Res. Lett., 21, 1339–1342, 1994.
Del Guasta, M., Morandi, M., Stefanutti, L., Balestri, S., Kyro, E., Rummukainen, M., Kivi, R., Rizi, V., Stein, B., Wedekind, C., Mielke, B. Matthey, R., Mitev, V., and Douard, M.: Lidar ob-servations of spherical particles in a−65◦C cold cirrus observed above Sodankyl¨a (Finland) during SESAME, J. Aerosol Sci., 29, 357–374, 1998.
Gao, R. S., Popp, P. J., Fahey, D. W., Marcy, T. P., Herman, R. L., Weinstock, E. M., Baumgardner, D. G., Garrett, T. J., Rosenlof, K. H., Thompson, T. L., Bui, T. P., Ridley, B. A., Wofsy, S. C., Toon, O. B., Tolbert, M. A., K¨archer, B., Peter, Th., Hudson, P. K., Weinheimer, A. J., and Heymsfield, A. J.: Evidence that ambient nitric acid increases relative humidity in low-temperature cirrus clouds, Science, 303, 516–520, 2004. Haag, W., K¨archer, B., Schaefers, S., Stetzer, O., M¨ohler, O.,
Schu-rath, U., Kr¨amer, M., and Schiller, C.: Numerical simulations of homogeneous freezing processes in the aerosol chamber AIDA, Atmos. Chem. Phys., 3, 195–210, 2003a,
SRef-ID: 1680-7324/acp/2003-3-195.
Haag, W., K¨archer, B., Str¨om, J., Minikin, A., Lohmann, U., Ovar-lez, J., and Stohl, A.: Freezing thresholds and cirrus cloud forma-tion mechanisms inferred from in situ measurements of relative
humidity, Atmos. Chem. Phys., 3, 1791–1806, 2003b,
SRef-ID: 1680-7324/acp/2003-3-1791.
Haag, W., and K¨archer, B.: The impact of aerosols and gravity waves on cirrus, clouds at midlatitudes, J. Geophys. Res., 109, D12202, doi:10.1029/2004JD004579, 2004.
Hallar, A. G., Avallone, L. M., Herman, R. L., Anderson, B. E., and Heymsfield, A. J.: Measurements of ice water content in tropopause region Arctic cirrus during SAGE III Ozone Loss and Validation Experiment (SOLVE), J. Geophys. Res., 109, D17203, doi:10.1029/2003JD004348, 2004.
Hanson, D. R.: The uptake of HNO3 onto ice, NAT, and frozen sulfuric acid, Geophys. Res. Lett., 19, 2063–2066, 1992. Haynes, D. R., Tro, N. J., and George, S. M.: Condensation and
evaporation of H2O on ice surfaces, J. Phys. Chem., 96, 8502– 8509, 1992.
Huthwelker, T.: Experimente und Modellierung der Spurengasauf-nahme in Eis, Ph.D. dissertation, Universit¨at Bonn, Cuvillier Ver-lag, G¨ottingen, ISBN 3-89712-675-3, 1999.
Irie, H., Kondo, Y., Koike, M., Takegawa, N., Tabazadeh, A., Reeves, J. M., Sachse, G. W., Vay, S. A., Anderson, B. E., and Mahoney, M. J.: Liquid ternary aerosols of HNO3/H2SO4/H2O in the Arctic tropopause region, Geophys. Res. Lett., 31, L01105, doi:10.1029/2003GL018678, 2004.
Jensen, E., and Pfister, L.: Transport and freeze-drying in the tropical tropopause layer, J. Geophys. Res., 109, D02207, doi:10.1029/2003JD004022, 2004.
Jensen, E., Pfister, L., Bui, T., Weinheimer, A., Weinstock E., Smith, J., Pittman, J., Baumgardner, D., Lawson, P., and McGill, M. J.: Formation of a tropopause cirrus layer observed over Florida during CRYSTAL-FACE, J. Geophys. Res., 110, D03208, doi:10.1029/2004JD004671, 2005a.
Jensen, E., Smith, J. B., Pfister, L., Pittman, J. V., Weinstock, E. M., Sayres, D. S., Herman, R. L., Troy, R. F., Rosenlof, K., Thomp-son, T. L., Fridlind, A. M., HudThomp-son, P. K., Cziczo, D. J., Heyms-field, A. J., Schmitt, C., and Wilson, J. C.: Ice supersaturations exceeding 100% at the cold tropical tropopause: Implications for cirrus formation and dehydration, Atmos. Chem. Phys., 5, 851– 862, 2005,
SRef-ID: 1680-7324/acp/2005-5-851.
K¨archer, B.: Simulating gas-aerosol-cirrus interactions: Process-oriented microphysical model and applications, Atmos. Chem. Phys., 3, 1645–1664, 2003,
SRef-ID: 1680-7324/acp/2003-3-1645.
K¨archer, B. and Solomon, S.: On the composition and optical ex-tinction of particles in the tropopause region, J. Geophys. Res., 104, 27 441–27 459, 1999.
K¨archer, B. and Lohmann, U.: A Parameterization of cirrus cloud formation: Homogeneous freezing of supercooled aerosols, J. Geophys. Res., 107 (D2), doi:10.1029/2001JD000470, 2002. K¨archer, B. and Haag, W.: Factors controlling upper tropospheric
relative humidity, Ann. Geophys., 22, 705–715, 2004,
SRef-ID: 1432-0576/ag/2004-22-705.
K¨archer, B. and Basko, M. M.: Trapping of trace gases in growing ice crystals, J. Geophys. Res., 109, D22204, doi:10.1029/2004JD005254, 2004.