Study of the Adsorption of Arsenic (III and V) by Magnetite Nanoparticles Synthetized via
AACVD
Blanca Elizabeth Monárrez-Corderoa, Patricia Amézaga-Madrida*, César Cutberto Leyva-Porrasa, Pedro Pizá-Ruiza, Mario Miki-Yoshidaa
Received: November 4, 2015; Revised: October 5, 2016; Accepted: November 21, 2016
Globally, water pollution is mainly caused by the presence of heavy metals and metalloids such
as arsenic. The majority of the techniques employed in the removal are of low eiciency and high
cost. Therefore, in this work it is presented the adsorption processes of arsenic (As III and V) ions
employing magnetite nanoparticles (MNPs) synthesized by the aerosol assisted chemical vapor deposition (AACVD) process. The adsorption eiciency was determined at diferent times and concentrations. The remaining As concentration in the solutions was analyzed by atomic absorption spectroscopy. The adsorbed As ions on the surface of the NMPs was analyzed by high resolution transmission electron microscopy. The results showed an overall removal eiciency of 87% for As+3 and 98% for As+5, in a contact time of 15 minutes. Results suggested the use of NMPs as a promising alternative in the
removal of As ions in water.
Keywords: AACVD, MNPs, adsorption isotherms, physisorption process
* e-mail: [email protected]
1. Introduction
Heavy metals such as lead1, mercury1, cadmium2,
chromium3, nickel4 and arsenic metalloid5, are found
naturally in the earth’s crust; eventually these heavy metals can become contaminants in the air, surface
water, groundwater, soil and other aquatic environments.
In recent decades, the aquatic environment has been
exposed to a large contamination mainly caused by the continuous discharges of pollutants containing heavy metals produced from anthropogenic sources2. When these metals reach the food chain, generate a high health risk for the living beings and humanity, because they can accumulate in living tissues causing
various disorders and diseases as skin diseases, kidney cancer and even incomplete embryonic development
during pregnancy6,7. Thus, for this reason, most of the
health agencies in the world have decided to reduce the maximum concentration of these toxic ions established
in the international norms.In the case of arsenic, it is
present in large quantities of groundwater and effluents worldwide, with an allowed maximum limit8 of 0.01 mg L-1. In natural water bodies, As is found as hydrogen
arsenate (H3AsO4) and arsenic acid (H3AsO3), which at
oxidizing or reducing conditions produce As+5 and As+3
ions, respectively9. From these ions, As+3 is more toxic. The mobility and bioavailability of these ions largely
depend on the adsorption/desorption process of As
within the soil and the pH conditions in groundwater10,11.
The treatment techniques include methodologies such as oxidation, precipitation and co-precipitation12,13,
inverse osmosis14, and ion exchange15. These techniques employ solid adsorbents particles for immobilizing the As ions such as alumina, mineral oxides, active carbon, polymer resins and zeolites16. Additionally, when both
As ions are presented in the water fluent, the removal
process becomes more complex, since As+3 must be first oxidized into As+5. Clearly, this increases the overall cost for decontamination of water. Thus, there is a growing interest in the development of low cost methodologies
for water treatment, especially for As ions. Consequently, in recent years several adsorbents based on
nanometric-scale oxides have been synthesized and tested (TiO2,
Fe2O3, Fe3O4)17-21. Among these oxides, iron oxides have
been widely employed due to its high efficiency caused by the strong affinity between the As and Fe at mild
conditions of room temperature and pH22,23. Therefore,
in this work were studied the equilibrium and kinetics
of the adsorption process of arsenic ions on magnetite hollow nanoparticles (MNPs). The equilibrium study will
provide relevant information related with the affinity between the adsorbate and adsorbent. The kinetics study will contribute with data associated with the time and concentration required to perform the removal process24. The experimental data was fitted with different kinetic
models in order to set if the process was driven by physisorption or chemisorption. Additionally, several
thermodynamic parameters such as the adsorption energy and Gibbs free energy were calculated.
a Departamento de Física de Materiales, Centro de Investigación en Materiales Avanzados S.C., Miguel
2. Experimental procedure
2.1. Synthesis and MNPs characterization
The MNPs were synthesized by the AACVD technique,
details of the technique have been previously reported elsewhere25-27. Briely, AACVD consists of an ultrasonic
nebulizer, where the precursor solution is converted into a ine aerosol. The aerosol is transported into de furnace by the carrying gas. Once inside the furnace, the precursor solution contained in the aerosol is decomposed by efect of the thermal energy into the oxide, forming in it a ine powder
on the walls of the tubular furnace. The precursor solution
was a dilution of Fe (II) chloride in methanol (99.9%), at a
concentration of 0.05 mol L-1. The aerosol was carried by a mixture of Ar–air low, (relation of 0.250:0.004 L min-1, respectively). Synthesis temperature was ixed at 723 K. A collection lask was placed on super magnets with the function of attracting and collecting the MNPs obtained.
The microstructure of the pure MNPs and the MNPs-As was analyzed in two ield emission microscopes, a scanning electron microscope (SEM) JEOL JSM-7401F and in a high resolution transmission electron microscope (HRTEM) JEOL JEM-2200FS. The elemental analysis was carried out by energy dispersive x-ray spectroscopy (EDS) attached to the column of the microscope. The EDS employed was an Inca from Oxford Instruments. Sample preparation consisted in dispersing the MNPs in ethanol and mixing under sonic conditions by 5
minutes. One drop of the solution was deposited on a
Holey-Carbon Cu grid. Excess of ethanol was removed by drying under a visible light lamp. Prior to the introduction in the column the Cu-grid was cleaned with Plasma by 10 seconds. MNPs-As were prepared as follows: irst a solution of 500
ppm of arsenic in 100 ml of tridistilled water was prepared.
Subsequently, 10 mg of MNPs were added to the solution and placed in ultrasonic agitation for 10 minutes. Once the time was elapsed, the solution was subjected to centrifugation at
5000 rpm by 15 minutes. Then the solution was decanted and
separated from the collected MNPs-As. For the SEM analysis,
the particles were dispersed in methanol by ultrasound for 1 minute, then three drops of the solution were deposited on
a silicon substrate with an approximate area of 0.5 cm2, and
the substrate was allowed to dry. In this case, an elemental
mapping for arsenic detection was performed on the MNPs-As. The speciic surface area of MNPs was analyzed by the
BET method before and after the contact with the arsenic to
determine the amount of speciic surface area being occupied
by the ions of arsenic after the adsorption process.
2.2. Arsenic removal test
The arsenic ions precursors (99% purity, JT Baker) used
in the preparation of solutions were sodium arsenite (NaAsO2) and sodium arsenate dibasic heptahydrate (Na2HAsO4.7H
2O),
for the As+3 and As+5, respectively. Two dilute solutions for
each ion were prepared as: As+3 0.152 and 0.164 mg L-1, and
As+5 0.033 and 0.066 mg L-1. To each of the dilute solutions were added 10 mg of MNPs and then left in contact under ultrasonic agitation. The contact times were 1, 5, 10, 15 and 30 minutes. After elapsed this time, in order to separating the MNPs from the liquid, the solutions were centrifuged at 5000 RPM by 10 minutes. Each clear solution was analyzed by atomic absorption spectroscopy (AAS, Avanta Sigma, GBC Scientiic Equipment Ltd.) for determining the As and Fe content. The removal eiciency was calculated with equation (1), where C0 is the initial As concentration in the solution prior to the contact test, and Cf is the As concentration determined from
the AAS characterization:
%
/
( )
Removal efficiency
Q
V
=
"Q
C
0-
C
fV
C
0%#
100 1
2.3. Equilibrium study
2.3.1. Adsorption capacity
The adsorption capacity (qe) was calculated from a
mass balance according to equation (2), where Co was the
initial As concentration in the solution (mg L-1), C e the As
concentration in the equilibrium (mg L-1), V the volume of
the solution (L) and M the mass of the MNPs (g).
*
/
M
( )
q
e=
"V
Q
C
0-
C
eV
%2
2.3.2. Adsorption isotherms
The equilibrium adsorption isotherms provide useful information about the interactions between the adsorbate and the adsorbent. From this type of curves it was possible to determine
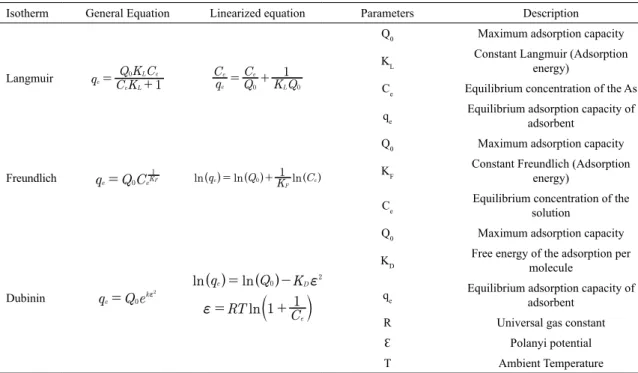
the thermodynamic parameters and the maximum adsorption capacity. Several itting models were tested (Langmuir28, Freundlich29 and Dubinin30) in order to ind the best adjustment between the experimental data and the theoretical behavior. The models and the corresponding parameters are depicted in Table 1.
2.4. Adsorption process thermodynamics
2.4.1. Adsorption energy
The adsorption free energy (E) was determined to according to equation (3) and it represents the energy change required for transferring one mole of As ions from the solution onto
the surface of the solid. If E is lower than 20 kJ mol-1 the
adsorption process is called physisorption, if it is between
20-40 kJ mol-1 the process is known as ionic exchange,
and when E is larger than 40 kJ mol-1 it is a chemisorption process. The Gibbs free energy (ΔG) indicates the energy
required to displace the adsorbate onto the surface of the adsorbent31 and was calculated according to equation (4).
( )
E
K
2
1
nanometric size, which formed the surface of the hollow sphere. The average particle size of the spherical particle was 300 ± 78 nm. Once analyzed, the MNPs were added to the arsenic solution and the results obtained by SEM show any change in the morphology of the nanoparticles
(It is called nanoparticle because the sphere is formed of
crystallites with size average of 20 nm, this means that the requirement of having at least 100 nm in size in one dimension is fulilled, therefore, it can be mentioned as nanoparticle) after the adsorption of arsenic (Figure 1b). Figure 2 (a-b) shows a micrograph obtained by HRTEM of a single MNP and the corresponding elemental mapping determined by EDS . In Figure 2b the white dots forming the image of the
particle indicated the presence of arsenic. It was observed
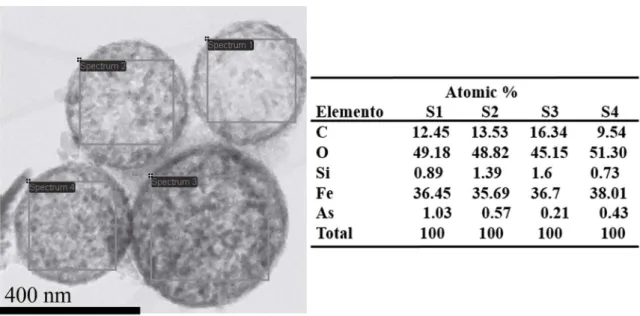
a homogeneous distribution of the As adsorbed on the MNPs. With this, the adsorption of As by the MNPs was conirmed. However, the As was preferentially adsorbed on the crust of the particle rather than in the bulk. Figure 3 shows the EDS analysis performed on several of the MNPs. As expected, the quantiication of the elements showed the presence of a high concentration of Fe and O, originated from the MNPs. The C, Si and Cu detected were originated from the elements conforming the support where the MNPs
were deposited. The relatively low concentration of As was evidently produced by the adsorption of the ions on the
surface of MNPs. Figure 4 shows the micrograph obtained by HRTEM and the corresponding line scan of elementes
(Fe, O and As) determiend by EDS. With the line scans it was possible to determine the overall As distribution on the
surface of a single MNP. These results suggested that most of the crystals forming the MNP contributed in the adsorption process, attraping several As ions32,33.
( )
G
RT Ln K
1
4
L
D
=
where KD is the Dubinin constant, KLis Langmuir constant, R is the universal gas constant (8.314 J mol-1 K-1) and T is
absolute temperature.
3. Results and discussion
3.1. Microstructure of the MNPS
Figure 1 (a-b) shows SEM micrographs of the MNPs synthesized by the AACVD method.
We can see particles with spherical morphology, each
sphere is composed of crystallites, these particles tend to
agglomerate, due to its size it is nanostructured. Two efects are observed when the size is reduced to nanostructured scale: a) a signiicant increase in surface area relative; b) a signiicant number of atoms on the surface increase. These efects increase the chemical reactivity of the surface of
nanoparticles; this chemical reactivity and other properties
depend on many factors: size, shape, chemical composition, electronic structure, surface structure, defects, difusion, surface energy of the nanocrystals, interactions with atoms
that are near and its chemical environment. The atoms on the
surface of the nanoparticles are unstable, have a higher energy
level and forces that are attracted by the atoms located inside the mass are very weak53. Therefore, by reducing the size at
the nanoscale, the forces of Van der Waals attraction and its
magnetic nature25-27 of the nanostructures, increase and the
spheres tend to attract each other and to form agglomerates. Most of the spherical particles consisted of crystallites with
Table 1: Models and parameters employed for itting the adsorption isotherms in the equilibrium.
Isotherm General Equation Linearized equation Parameters Description
Langmuir qe C KQ K C1
e L L e
0
= + Cq QC K Q1
e
e e
L
0 0
= +
Q0 Maximum adsorption capacity
KL
Constant Langmuir (Adsorption energy)
Ce Equilibrium concentration of the As
qe Equilibrium adsorption capacity of adsorbent
Freundlich qe Q C0 eK
1
F
= lnq lnQ ln
K C 1 e F e 0 = +
Q V Q V Q V
Q0 Maximum adsorption capacity
KF
Constant Freundlich (Adsorption
energy)
Ce Equilibrium concentration of the solution
Dubinin qe Q e0 k
2
= f
ln
Q
qeV
=lnQ
Q0V
-KDf2ln
RT 1 C1
e
f= T + Y
Q0 Maximum adsorption capacity
KD
Free energy of the adsorption per
molecule
qe
Equilibrium adsorption capacity of adsorbent
R Universal gas constant
Ɛ Polanyi potential
Figure 1: SEM images showing a) the morphology of the MNPs before arsenic adsorption process. b) Morphology of MNPs after the arsenic adsorption process.
Figure 2: HRTEM image from a single MNP and Elemental mapping of a single MNPs. The scattered white dots indicate the distribution
of the As ions on the MNPs.
3.2. Surface area measurements
The surface area calculated for MNPs before and after the adsorption process was 92 and 84 m2/g respectively. The diference between these two measurements (8.7%) indicated
that this value was the surface area occupied by arsenic. It
is evident that the adsorption capacity depends largely on the speciic surface area of the adsorbent and the ainity between the adsorbate and adsorbent. Altough the adsorbed As covered only a 8.7% of the surface of the particles, there still a large surface area where As ions may be adsorbed. This indicates the existence of free active sites for adsorbing
more As ions i.e. in a continuos adsorption process.
3.3. Efect of contact time and solution
concentration
Figure 5 shows the plots of the removal eiciency against the contact time of As ions (As+5 and As+3) solutions at the diferent concentration. The curves showed a similar adsorption behavior. At early stages of the contact time, there was a high adsorption rate of As on the MNPs, which was caused by the large amount of available sites for As
adsorption34. As the contact time elapsed, the active sites are being saturated with more As ions; this was observed
Figure 3: EDS analyses from the MNPs synthesized by the AACVD method, after the contact tests with As ions (As+3 y As+5).
Figure 4: Scanning line by HRTEM, indicates the elemental distribution of As, O and Fe in MNPs.
the equilibrum was attached after 15 minutes of contact time. These results were similar to those previously reported by Naushad et al.2,36 who found that the rate of adsorption was higher in the early stages of the removal process and
then tend to decrease when the process reached the state of
Figure 5: The removal eiciency of the As ions at diferent contact time.
As+3 ions after 15 minutes of contact time reached only 87%. These eiciency values were of importance since at these levels it was fulilled the maximun concentration of As in
water allowed in the international health standards. After 30 minutes of contact time As+5 ions were fully removed
from the solution, while As+3 ions were removed only at 90%. Clearly, these suggested diferences in the adsorption
mechanism between the As+5 and As+3 ions. Commonly, prior
to the removal of As+3 ions, these must be oxidized into As+5. However, in the adsorption experiments performed in this
work, As+3 ions were removed from water at a relative high eiciency without any previous treatment.
The mechanism of adsorption of As ions on FeOH was previoulsy reported by Xu et al.37, Westerof et al.38 and Eby39, and it was depicted in Figure 6. Results showed that only 10 mg of MNPs were enough to reach those removal eiciencies. The advantages of employing this type of MNPs are the low contact time required to achieve a high removal eiciency40,41 and the prevention in the generation of residual sludge, which reduce the overall cost of the water
treatment process.
3.4. Adsorption isotherms
Adsorption isotherms were constructed in order to show
the adsorption capacity of the MNPs in the equilibrium. Table 3 shows the experimental conditions and the results of the
calculated adsorption capacity (qe). As observed in Table 3, the adsorption capacity increased with the initial concentration
Table 2: Results of the removal of As ions (As+3 y As+5) from water. The initial concentration of As in the solution is indicated in square
brackets.
Time (min) As
+5 removal (%) [0.036 mg L-1]
As+5 removal (%) [0.066 mg L-1]
As+3 removal (%) [0.152 mg L-1]
As+3 removal (%) [0.164 mg L-1]
1 64 70 49 54
5 89 91 62 68
10 94 95 73 78
15 96 98 85 87
30 100 100 88 90
of the As solution; this was observed for both of the As ions
tested. This behavior was explained in terms of the high mass transfer velocity produced by the larger amount of adsorbate
available in the more concentrated solution3,42,43. Table 4 shows
a summary of the results reported in literature of the adsorption
capacities obtained with diferent types of adsorbents44-46. As
can be infered, the adsorption capacity of the adsorbatent depends on the initial concentration of the adsorbeate, and in consequence the saturation point or equilibrium may be
shifted in any direction. The experimental data describing the interactons solute-adsorbate was calculated from the itting of the diferent models. Table 5 shows the results of the linnear regresion according to the Langmuir model. The monolayer
content level (Q0) represents the mass of ions adsorbed on
the MNPs and forming a single monolayer of As ions47-36. Since in every case, the qe values is larger than the Q0, then
it was suggested the formation of several layers adsorbed on
the initial monolayer. This is a typical performance observed
in physisorption processes. The calculated Lagmuir constant (KL) can be interpred as the enthalpy of adsorption, showed negative values. This suggested the exothermal nature of the process and indicated that the surface of the MNPs was energetically favorable to react with the As ions. Table 6 shows the results of the Freundlich model. According to Mandal S.
et al.48,49, at higher KF value will be higher the adsorption
capacity of the adsorbent. Additionally, a KF value higher
than the unit indicates the spontaneous nature of the process
50. In terms of the adsorption capacity, these results agreed with those calculated by the Langmuir model. However, for all the adsorption ishoterms, the regression coeicient (R2) was more reliable for the Freundlich model than for the Langmuir model. Table 7 shows the results obtained after applying the Dubinin model. The regression coeicent was similar to those
calculated by the Freundlich model, and the Q0 value was lower than the qe value, conirming the formation of several
adsorbed layers of As ions during the adsorption process 2.
3.5. Determination of adsorption energy and
Gibbs free energy
Figure 6: Proposed mechanism of arsenic adsorption process by
MNPs37-39.
Table 3: Experimental conditions employed in the contact adsorption
tests for calculating the adsorption capacity.
C0 (mg L
-1) V (L)
Solution
MNPs
(mg) qe (mg g
-1)
As+5 0.036 0.1 0.01 0.355
As+5 0.066 0.1 0.01 0.63
As+3 0.152 0.1 0.01 1.33
As+3 0.164 0.1 0.01 1.38
Table 4: Adsorption capacities of diferent types adsorbents, with diferent amounts of adsorbate and adsorbent.
Adsorbent Initial concentration of
adsorbate Adsorption capacity (mg g
-1)
Amount of Adsorbent
utilized
Nickel/nickel boride nanoparticles coated resin 4 100 ppm 23.4 As +3
17.8 As+5
0.1 g 0.4 g
Fe7S8 nanoparticles5 300 ppb 14.3 As
+3
31.3 As+5 0.01g
Iron oxide Green nanoparticles44 600 ppm 3.77 As+5 2.5 g
MOF-808 nanoparticles45 5 ppm 24.83 As+5 0.01 g
TiO2 nanoparticles46 0.1 ppm 3.1 As+5 0.2 gr
Magnetite nanoparticles (this work) 0.066 ppm 0.134 ppm 0.63 As1.38 As+5+3 0.01 g
Table 5: Results from the Langmuir model for the adsorption of As ions (As+3 y As+5) on the MNPs.
As+5 As+3
Concentration
0.036 mg L-1
Concentration
0.066 mg L-1
Concentration
0.152 mg L-1
Concentration
0.164 mg L-1
Adsorption capacity of a monolayer
Q0 (mg g-1) 0.338 0.623 1.052 1.219
Langmuir constant KL (L mg
-1) -37 -23 -2.4 -1.9
Adsorption capacity qe (mg g
-1) 0.35 0.63 1.33 1.38
Regression coeicient R2 0.85 0.91 0.97 0.95
As ions from the solution onto the surface of the adsorbate
(MNPs) was very close to 20 kJ mol-1 for the As+5 and 7.6 kJ mol-1 for the As+3. These values corroborated that the interactions among the adsorbate and the adsorbent
were of the physical type, i.e. physisorption process51,52. The calculated Gibbs free energy for the both. As ions presented a negative value, indicating the spontaneous
nature of the process. Furthermore, as the concentration of the solution decreased, the calculated value of the
energies (E and ∆G) was more negative, indicating that
the physisorption process was more favorable. These results were similar to those reported by Naushad et al.52.
Furthermore, when the concentration of the adsorbate in the solution decreased, the calculated value for the
energies (E and ΔG) also decreases, indicating that the
physisorption process was more favorable.
4. Conclusions
The study presented herein showed that the hollow
magnetic nanoparticles (MNPs) can be employed as a promising material in the removal of As ions (As+5 and
As+3) from water. The adsorption experiments showed that As ions could be removed with a high eiciency (90%) in a relatively short time (15 minutes). From the high resolution electron microscopy images, it was observed that the As
ions were adsorbed and well distributed on the surface
of the MNPs. Several physical models were employed to it the experimental data and the results indicated the formation of several layers of As ions on the MNPs. The calculated adsorption free energy and Gibbs free energy
indicated that the adsorption process was conducted by
Table 6: Results from the Freundlich model for the adsorption of As ions (As+3 y As+5) on the MNPs.
As+5 As+3
Concentration
0.036 mg L-1
Concentration
0.066 mg L-1
Concentration
0.152 mg L-1
Concentration
0.164 mg L-1
Adsorption capacity of a monolayer Q0 (mg g
-1)
0.28 0.54 0.610 0.77
Freundlich constant
KF (L mg -1)
-32 -36 -5 -6.3
Adsorption capacity qe (mg g-1)
0.35 0.63 1.33 1.38
Regression coeicient R2 0.97 0.96 0.98 0.99
Table 7: Results from the Dubinin model for the adsorption of As ions (As+3 y As+5) on the MNPs.
As+5 As+3
Concentration
0.036 mg L-1
Concentration
0.066 mg L-1
Concentration
0.152 mg L-1
Concentration
0.164 mg L-1
Adsorption capacity of a monolayer
Q0 (mg g-1) 0.278 0.528 0.439 0.606
Dubinin constant
KD (L mg
-1) 0.0013 0.0012 0.011 0.0086
Adsorption capacity qe (mg g
-1) 0.35 0.63 1.33 1.38
Regression coeicient R2 0.96 0.97 0.99 0.99
Table 8: Adsorption free energy for As ions (As+5 y As+3) at diferent experimental conditions, calculate from the Dubinin model
As ion Concentration (mg L-1) Dubinin Constant (mol2 kJ-2) Adsorption free Energy (kJ mol-1)
As+5 0.036 0.0013 19
As+5 0.066 0.0012 20
As+3 0.152 0.0011 6.7
As+3 0.164 0.0086 7.6
Table 9: Gibbs free energy for As ions (As+5 y As+3) at diferent experimental conditions, calculate from the Langmuir model
As ion Concentration (mg L-1) Langmuir Constant (mol2 kJ-2) Adsorption free energy (kJ mol-1)
As+5 0.036 37 -8.8
As+5 0.066 23 -7.6
As+3 0.152 2.4 -2.14
As+3 0.164 1.9 -1.57
5. Acknowledgements
Authors thank to S. Miranda, A. Benavidez, P. Peregrino, C. Ornelas, O. Esquivel-Pereyra, A. Heiras-Trevizo, G. Romero-Rubio for the technical assistance provided during the realization of this work. This work was partially supported by a grant from CONACYT PDCPN2014-01 Project 248289.
6. References
1. Naushad M, ALOthman ZA, Awual MR, Alam MM, Eldesoky
GE. Adsorption kinetics, isotherms, and thermodynamic studies
for the adsorption of Pb2+ and Hg2+ metal ions from aqueous medium using Ti(IV) iodovanadate cation exchanger. Ionics.
2015;21(8):2237-2245.
2. Naushad M, Ansari AA, ALOthman ZA, Mittal J. Synthesis and characterization of YVO4:Eu
3+ nanoparticles: kinetics and
isotherm studies for the removal of Cd2+ metal ion. Desalination and Water Treatment. 2014;57(5):2081-2088.
3. Fernández-López JA, Angosto JM, Avilés MD. Biosorption of
Hexavalent Chromium from Aqueous Medium with Opuntia
Biomass. The Scientiic World Journal. 2014;2014:670249.
4. Çiftçi TD, Henden E. Nickel/nickel boride nanoparticles coated resin: A novel adsorbent for arsenic(III) and arsenic(V) removal.
Powder Technology. 2015;269:470-480.
5. Cantu J, Gonzalez LE, Goodship J, Contreras M, Joseph M, Garza C, et al. Removal of arsenic from water using
synthetic Fe7S8 nanoparticles. Chemical Engineering Journal.
6. Jain CK, Ali I. Arsenic: occurrence, toxicity and speciation
techniques. Water Research. 2000;34(17):4304-4312. 7. Zhang S, Niu H, Cai Y, Zhao X, Shi, Y. Arsenite and arsenate
adsorption on coprecipitated bimetal oxide magnetic nanomaterials: MnFe2O4 and CoFe2O4. Chemical Engineering
Journal. 2010;158(3):599-607.
8. México. Secretaría de Salud. Norma Oicial Mexicana
NOM-127-SSA1-2015, Salud ambiental. Agua para uso y consumo
humano. Límites permisibles de calidad y tratamientos a que debe someterse el agua para su potabilización. Ciudad de
México: Secretaría de Salud; 2015,
9. Malana MA, Qureshi RB, Ashiq MN. Adsorption studies of arsenic on nano aluminium doped manganese copper ferrite polymer (MA, VA, AA) composite: kinetics and mechanism. Chemical
Engineering Journal. 2011;172(2-3):721-727.
10. Kundu S, Gupta AK. Arsenic adsorption onto iron oxide-coated cement (IOCC): Regression analysis of equilibrium data with several isotherm models and their optimization. Chemical
Engineering Journal. 2006;122(1-2):93-106.
11. Manning BA, Goldberg S. Arsenic (III) and arsenic
(V) adsorption on three California soils. Soil Science. 1997;162(12):886-895.
12. Borho M, Wilderer P. Optimized removal of arsenate (III) by adaptation of oxidation and precipitation processes
to the filtration step. Water Science and Technology. 1996;34(9):25-31.
13. Hansen HK, Nuñez P, Grandon R. Electrocoagulation as a remediation tool for wastewaters containing arsenic. Minerals Engineering. 2006;19(5):521-524.
14. Han B, Runnells T, Zimbron J, Wickramasinghe R. Arsenic removal from drinking water by locculation and microiltration. Desalination. 2002;145(1-3):293-298.
15. Kim J, Benjamin MM. Modeling a novel ion exchange
process for arsenic and nitrate removal. Water Research.
2004;38(8):2053-2062.
16. Benjamin MM, Sletten RS, Bailey RP, Bennett T. Sorption and iltration of metals using iron-oxide-coated sand. Water Research. 1996;30(11):2609-2620.
17. Martinson CA, Reddy KJ. Adsorption of arsenic(III) and arsenic(V) by cupric oxide nanoparticles. Journal of Colloid
and Interface Science. 2009;336(2):406-411.
18. Manning BA, Fendorf SE, Bostick B, Suarez DL. Arsenic(III) Oxidation and Arsenic(V) Adsorption Reactions on Synthetic
Birnessite. Environmental Science & Technology. 2002;36(5):976-981.
19. Liu Z, Zhang FS, Sasai R. Arsenate removal from water using
Fe3O4-loaded activated carbon prepared from waste biomass.
Chemical Engineering Journal. 2010;160(1):57-62. 20. Xu Z, Li Q, Gao S, Shang JK. As(III) removal by hydrous titanium
dioxide prepared from one-step hydrolysis of aqueous TiCl4
solution. Water Research. 2010;44(19):5713-5721.
21. Kanel SR, Grenèche JM, Choi H. Arsenic(V) Removal from
Groundwater Using Nano Scale Zero-Valent Iron as a Colloidal Reactive Barrier Material. Environmental Science & Technology. 2006;40(6):2045-2050.
22. Korngold E, Belayev N, Aronov L. Removal of arsenic from drinking water by anion exchangers. Desalination. 2001;141(1):81-84. 23. Dambies L, Salinaro R, Alexandratos SD. Immobilized N -Methyl-d-glucamine as an Arsenate-Selective Resin. Environmental & Science Technology. 2004;38(22):6139-6146.
24. Ho YS, Ng JCY, McKay G. Kinetics of pollutant sorption by
biosorbents: Review. Separation & Puriication Reviews.
2000;29(2):189-232.
25. Monárrez-Cordero B, Amézaga-Madrid P, Antúnez-Flores W, Leyva-Porras C, Pizá-Ruiz P, Miki-Yoshida M. Highly eicient removal of arsenic metal ions with high supericial area hollow magnetite nanoparticles synthetized by AACVD method. Journal
of Alloys and Compounds. 2014;586(Suppl 1):S520-S525.
26. Monárrez-Cordero BE, Amézaga-Madrid P, Hernández-Salcedo PG, Antúnez-Flores W, Leyva-Porras C, Miki-Yoshida M. Theoretical and experimental analysis of the aerosol assisted CVD synthesis of magnetite hollow nanoparticles. Journal of
Alloys and Compounds. 2014;615(Suppl 1):S328-S334.
27. Hernández-Salcedo PG, Amézaga-Madrid P, Monárrez-Cordero BE, Antúnez Flores W, Pizá-Ruiz P, Leyva-Porras C, et al. Theoretical and experimental inluence of aerosol assisted CVD parameters on the microstructural properties of magnetite nanoparticles and their response on the removal eiciency of
arsenic. Journal of Alloys and Compounds. 2014;643(Suppl 1):S287-S296.
28. Iqbal MJ, Ashiq MN. Adsorption of dyes from aqueous solution
on activated charcoal. Journal of Hazardous Materials.
2007;139(1):57-66.
29. Renault F, Morin-Crini N, Gimbert F, Badot PM, Crini G. Cationized starchbased material as a new ion-exchanger
adsorbent for the removal of C. I. Acid Blue 25 from aqueous solutions. Bioresource Technology. 2008;99(16):7573-7586.
30. Shrestha RR, Shrestha MP, Upadhyay NP, Pradhan R, Khadka R, Maskey A, et al. Groundwater arsenic contamination, its health impact and mitigation program in Nepal. Journal of Environmental Science and Health Part A, Toxic/Hazardous
Substances & Environmental Engineering. 2003;38(1):185-200.
31. Maji SK, Pal A, Pal T. Arsenic removal from real-life groundwater
by adsorption on laterite soil. Journal of Hazardous Materials.
2008;151(2-3):811-820.
32. Litter MI, Alarcón-Herrera MT, Arenas MJ, Armienta MA, Avilés M, Cáceres RE, et al. Small-scale and household methods to remove arsenic from water for drinking purposes in Latin
America. Science of The Total Environment. 2012;429:107-122.
33. Wu FC, Tseng RL, Juang RS. Initial behavior of intraparticle difusion model used in the description of adsorption kinetics.
Chemical Engineer Journal. 2009;153(1-3):1-8.
34. Naushad M, ALOthman ZA. Separation of toxic Pb2+ metal
from aqueous solution using strongly acidic cation-exchange
resin: analytical applications for the removal of metal ions from pharmaceutical formulation. Desalination and Water Treatment.
2013;53(8):2158-2166.
35. Vadivelan V, Kumar KV. Equilibrium, kinetics, mechanism, and process design for the sorption of methylene blue onto rice husk.
36. Naushad M, ALOthman ZA, Alam MM, Awual MR, Eldesoky GE, Islam M. Synthesis of sodium dodecyl sulfate-supported nanocomposite cation exchanger: removal and recovery of Cu2+
from synthetic, pharmaceutical and alloy samples. Journal of
the Iranian Chemical Society. 2015;12(9):1677-1686.
37. Xu YH, Nakajima T, Ohki A. Adsorption and removal of arsenic(V) from drinking water by aluminum-loaded Sirasu-zeolite. Journal of Hazardous Materials. 2002;92(3):275-287. 38. Westerhof P, Highield D, Badruzzaman M, Yoon Y. Rapid
small-scale column tests for arsenate removal in iron oxide
packed bed columns. Journal of Environmental Engineering.
2005;131(2):262-271.
39. Nelson Eby G. Principles of Environmental Geochemistry. Paciic Grove: Brooks/Cole-Thomson Learning; 2004. 514 p. 40. Urbano BF, Rivas BL, Martinez F, Alexandratos SD. Equilibrium
and kinetic study of arsenic sorption by water-insoluble
nanocomposite resin of poly[N-(4-vinylbenzyl)-N-methyl-d-glucamine]-montmorillonite. Chemical Engineering Journal. 2012;193-194:21-30.
41. Garg UK, Kaur MP, Garg VK, Sud D. Removal of nickel(II) from aqueous solution by adsorption on agricultural waste biomass using a response surface mehodological approach. Bioresource Technology. 2008;99(5):1325-1331.
42. Karami H. Heavy metal removal from water by magnetite
nanorods. Chemical Engineering Journal. 2013;219:209-216.
43. Alqadmi AA, Naushad M, Abdalla MA, Ahamad T, Alothman ZA, Alshehri SM. Synthesis and characterization of Fe3O4@TSC nanocomposite: highly eicient removal of toxic metal ions from
aqueous medium. RSC Advances. 2016;6(27):22679-22689.
44.Saritha A, Raju B, Narayana RD, Roychowdhury A, Das D,
Hussain KA. Facile green synthesis of iron oxide nanoparticles
via solid-state thermolysis of a chiral, 3D anhydrous potassium
tris(oxalato)ferrate(III) precursor. Advanced Powder Technology. 2015;26(2):349-354.
45. Li ZQ, Yang JC, Sui KW, Yin N. Facile synthesis of
metal-organic framework MOF-808 for arsenic removal. Materials Letters. 2015;160:412-414.
46. Ramos MLP, González JA, Albornoz SG, Pérez CJ, Villanueva ME, Giorgieri SA, et al. Chitin hydrogel reinforced with
TiO2 nanoparticles as an arsenic sorbent. Chemical Engineering
Journal. 2016;285:581-587.
47. Rodríguez Vidal FJ. Proceso de iltración - adsorción y efecto del ozono. Procesos de potabilización del agua e inluencia
del tratamiento de ozonización. 1er ed. Madrid: Díaz de Santos:
2006; 196 p.
48. Mandal S, Sahu MK, Giri AK, Patel RK. Adsorption studies of
chromium (VI) removal from water by lanthanum diethanolamine hybrid material. Environmental Technology. 2014;35(7):817-832.
49. Naushad M, Khan M, ALOthman ZA, AlSohaimi I, Rodriguez-Reinoso F, Turki M, et al. Removal of BrO3− from drinking water samples using newly developed agricultural waste-based activated carbón and its determination by ultra-performance
liquid chromatography-mass spectrometry. Environmental
ScienceandPollution Research.2015;22(20):15853-15865.
50. Mandal S, Mahapatra SS, Patel RK. Neuro fuzzy approach for
arsenic(III) and chromium(VI) removal from watery. Journal
of Water Process Engineering. 2015;5:58-75.
51. Hokkanen S, Repo E, Lou S, Sillanpää M. Removal of arsenic(V) by magnetic nanoparticle activated microibrillated cellulose.
Chemical Engineering Journal. 2015;260:886-894. 52. Naushad M, ALOthman ZA, Sharma G, Inamuddin. Kinetics,
isotherm and thermodynamic investigations for the adsorption of Co(II) ion onto crystal violet modiied amberlite IR-120
resin. Ionics. 2015;21(5):1453-1459.
53. Cornejo-Alvarez L. La Revolución Nanotecnológica del Siglo
XXI. Available from: <http://nuevastecnologiasymateriales.com/