DOI: http://dx.doi.org/10.1590/1980-5373-MR-2015-0612
Optical Band Gap Estimation of ZnO Nanorods
Angélica Sáenz-Trevizoa*, Patricia Amézaga-Madrida, Pedro Pizá-Ruiza, Wilber Antúnez-Floresa, Mario Miki-Yoshidaa
Received: October 9, 2015; Revised: April 14, 2016; Accepted: July 8, 2016
The optical band gap energy of ZnO nanorods was estimated by diferent methods found in literature. These nanorods were deposited onto TiO2 covered borosilicate glass substrates by aerosol assisted chemical vapor deposition. Characterization techniques were employed to reveal the crystalline structure, surface morphology and optical properties of the sample. The analysis proved that hexagonal cross-section ZnO nanorods in the wurtzite phase were grown onto a TiO2 bufer thin ilm of anatase. Variations in the components of transmittance and relectance were associated with the development of a rough surface. Such luctuations were correlated with the equations employed to estimate the optical band gap. The diferent methods indicated band gap values of 3.17 to 3.24 eV. The energy band gap of 3.24 eV agrees to that reported in the literature for ZnO nanorods. Fluorescence spectroscopy conirmed the accuracy of the mathematical predictions since an emission at 380 nm (3.26 eV) was seen.
Keywords: ZnO nanorods, ZnO band gap, Kubelka-Munk method, rough surface
* e-mail: angelica.saenz@cimav.edu.mx
1. Introduction
Photo activated applications such as solar cells, H2 generators and photocatalysis, generally require the knowledge of the refractive index, absorption coeicient, band bap (BG) or any other optical parameters that serve to predict the performance of the employed materials1-5. The term BG
is usually determined when the photo stimulated generation of electrons and holes at a certain wavelength is required, leading to a more accurate employment of the light sources and materials according to the selected application. In practice, the estimation of the BG becomes feasible within the use of indirect methods, commonly by the Tauc’s plot, which demands the computation of the absorption coeicient (α). Then, α can be determined from the itting or processing of ellipsometric or spectroscopic measurements1,2. According
to literature, the employment of the ellipsometric technique is often recommended as it can lead to the determination of more reliable optical properties. However, it is still an indirect methodology that requests itting models for the analysis of the data. Nevertheless, the available models are not suitable for all nanostructures, particularly when a rough surface has been developed1,2. In fact, this is why the utilization of
the spectrophotometric technique combined with standard optical equations that require the measurement of only Transmittance and Relectance is commonly accepted6-10. As a matter of fact, for those cases when a precise deinition of the BG is desired or when possible substrate interference is detected, transport theories, speciically the Kubelka-Munk (K-M) method, are employed3,4,11-13. Nevertheless, it
is believed that such method has limited applicability and so, several modiications have resulted. Nonetheless, the adoption of alternative techniques implies a more complex examination of the data, comprising all possible surfaces and light interactions4,5,11. As a consequence and based on
the simplicity of the spectrophotometric measurements, the adoption of the simple mathematical expressions remain a common practice in literature to report the BG value.
Therefore, since the variation in the BG is often claimed when the diferent optical equations or models are adopted, a comparative study among the various methods, including the K-M theory, was performed in order to estimate the BG value of a rough sample of ZnO nanorods and to establish applicability limitations of the formulas. ZnO in the form of nanorods was chosen because it is suitable in all of the aforementioned applications2,5,7,9,10 and its 1D morphology is preferably among other morphologies9,10.
2. Materials and methods
2.1 Synthesis
A sample consisting of ZnO nanorods was grown onto TiO2 coated borosilicate glass substrate (BGS), using the aerosol assisted CVD technique. The synthesis of the ZnO nanorods sample, Z, followed the conditions reported previously by Sáenz-Trevizo et al.15
2.2 Characterization
The crystalline phases were determined by grazing incidence x-ray difraction (GIXRD). The experiment was
carried out in a Panalytical X-Pert system, set at the following conditions: a Cu Kα radiation (λ = 0.1542 nm) operated at 40 keV and 30 mA, a grazing incidence angle of 0.5º, a scanning angle 2θ varied in range from 20° to 80°, with a step size of 0.05° and step time of 2.75 s. Surface morphology was analyzed by scanning electron microscopy (SEM) in a ield emission JEOL JSM-7401F microscope. The total, difuse and collimated components of the relectance and transmittance for the BGS substrate, TiO2 coated substrate and
ZnO nanorods sample, were measured in the UV-VIS-NIR interval using a CARY 5000 spectrophotometer equipped with a DRA2500 integrating sphere accessory, as suggested in earlier studies11. Spectral collimated component was determined by subtracting the spectral difuse component from the total measurement. Moreover, the luorescence spectrum of the sample was measured using a modular spectroluorometer Horiba Fluorolog-3, which uses a 450-W Xenon CW lamp as excitation source. The excitation wavelength was set at 325 nm, while the interval of emission was in the range of 300 nm to 800 nm with a step of 5 nm. The luorescence signal was detected at a 45º viewing mode for the incident light and that of emission. A slit of 1 nm was used for excitation and emission. The whole process was carried out at room temperature (293 K).
3. Results and discussion
3.1 Crystalline structure, morphology and optical
properties
Difractograph from the sample by GIXRD appears in Figure 1a. It is clear from the igure that sharp and deined peaks were detected during the analysis, which matched precisely with the synthesized tetragonal anatase and hexagonal wurtzite phases of TiO2 bufer thin ilm and ZnO layer of nanorods, respectively. Furthermore and as it can be seen in micrograph in Figure 1b, the as grown ZnO nanorods appeared mostly oriented following the [001] direction perpendicular to the substrate’s surface, associated with the intense peak in Figure 1a that agrees with the (002) family planes of ZnO. From Figure 1b, the columnar and hexagonal cross-section morphology of the ZnO nanorods was also evidenced. Results matched with the information presented earlier by Sáenz-Trevizo et al.15. Additionally, according to
the morphology and orientation of the layer of nanorods, the development of a rough sample was considered.
Total transmittance (T) and relectance (R) spectra of sample Z along with their difuse components (TD and RD) appear in Figure 2. From this igure, it is noticeable that the main sample-light interactions are difuse in both cases, associated with the roughness of the surface. Measured T and R were the properties of the stack BGS - TiO2 -ZnO
nanorods layer considered for the analysis.
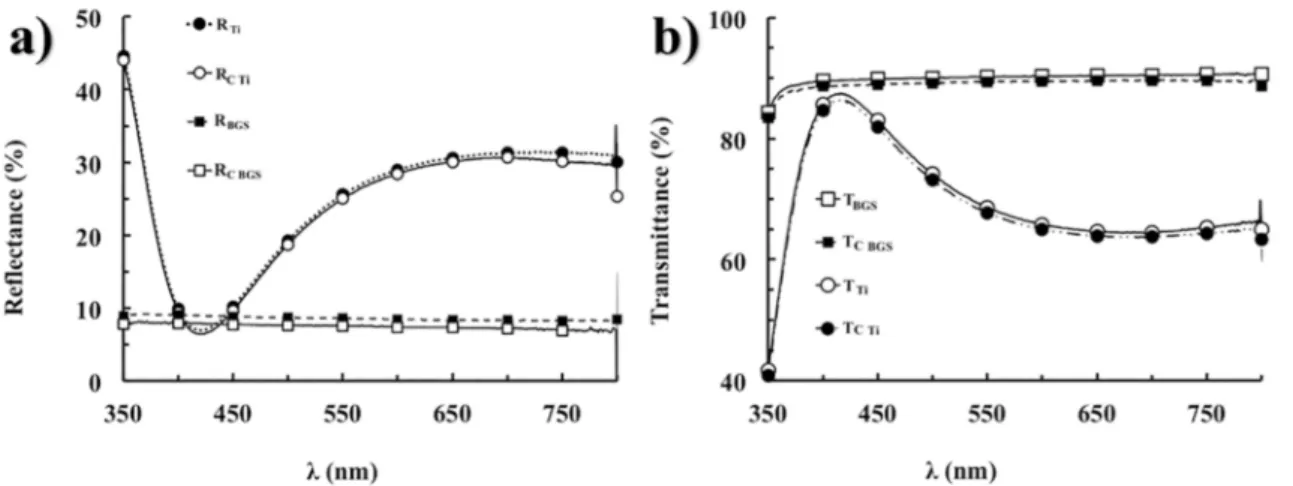
In order to evaluate the contribution of the bare BGS and TiO2 coated BGS on the optical properties of sample Z, the total transmittance and relectance spectra of both materials were measured. Results appear in Figure 3a and b, for bare BGS and TiO2 coated BGS, respectively. From the igure it is evident that for both cases, the collimated component of the relectance and transmittance were mainly detected. This efect was related to the surface conditions, as its roughness was almost negligible even when a thin layer of TiO2 was grown onto the BGS. Moreover, it was also clear that the transmittance and relectance proiles of TiO2 coated BGS, difer considerably from those of the bare BGS, corroborating the presence of the bufer thin ilm onto it. Noteworthy, the relectance spectra of sample Z in Figure 2, presents a completely diferent proile to those seen on bare BGS and TiO2 coated BGS substrates in Figure 3, suggesting that the inluence of the substrate is almost irrelevant when the optical properties of the stack structure are measured.
3.2 Band Gap approximation using standard
optical equations
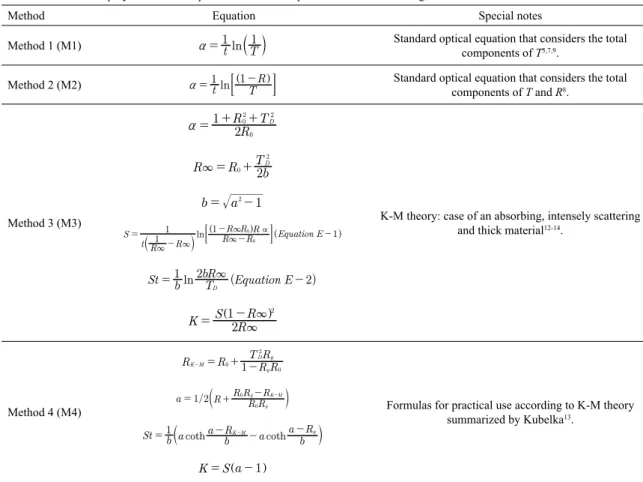
Several theoretical expressions named standard, as well as adaptations to the K-M method were used to compute α at each wavelength. All employed equations appear summarized in Table 1. Later on, α was used to estimate the optical BG energy using the Tauc’s plot method16 following
the relationship:
E
B E
Eg
ma
=
^
-
h
where B is a parameter independent of the photon energy E, Eg is the optical band gap energy and the exponent m depends of the type of transition between bands. Since an allowed direct transition is considered for ZnO, m = ½ for
our estimations.
Figure 1. a) difractograph by GIXRD and b) SEM micrograph from sample Z. Both images reveal the crystalline structure of the synthesized materials and the topography of the surface.
Figure 2. Total (R, T) and difuse (RD, TD) components of
transmittance and relectance spectra of sample Z in the UV-Vis region. Total components are mainly constituted by difuse
interactions in both cases.
Figure 3. Optical properties of bare BGS and TiO2 covered BGS substrates. a) total (RBGS, RTi) and collimated (RC BGS, RCTi) components
of relectance spectra and b) total (TBGS, TTi) and collimated (TC BGS, TC Ti) components of transmittance spectra. Total components are
mainly constituted by specular interactions for both samples.
3.3 Band Gap determination using the
Kubelka-Munk method
Figure 4. Tauc’s plots obtained through the applications of standard equations in a) M1 and b) M2. All cases indicate a BG of 3.24 ± 0.01 eV.
Method Equation Special notes
Method 1 (M1) a=1tlnb lT1 Standard optical equation that considers the total
components of T5,7,9.
Method 2 (M2) a=1tln:]1-TRgD Standard optical equation that considers the total
components of T and R8.
Method 3 (M3)
R
R T
2
1 D
0 02 2
a= + +
K-M theory: case of an absorbing, intensely scattering
and thick material12-14.
R R T2bD
0 2
3= +
b= a2-1
ln
S
t R R R R
R R R Equation E
11
1 1
0 0 \
3 3
3 3 =
-
--
-b
] ^
l
g h
; E
( )
ln
St 1b 2bRT Equation E 2 D
3
=
-K S12RR
2
3 3
= Q - V
Method 4 (M4)
RK M R 1T RR R
g
D g
0
0 2
= +
-Formulas for practical use according to K-M theory summarized by Kubelka13.
/
a 1 2 R R RR RR
g
g K M
0 0 = T + - - Y
coth coth St=b a1T a-bRK M- -a a-bRgY
K=S aQ -1V
T measured total transmittance; R measured total relectance; t nanorods average length equals to 1.5 µm; R0 measured difuse relectance; TD measured difuse transmittance; R∞ relectance of an ininite thick layer; RK-M total relectance according to K-M equations; S dispersion
coeicient; K absorption coeicient = α; Rg = RD BGS measured relectance of the substrate; a and b deined as K-M constants.
observations in Figures 2 and 3, from where it was seen that the main relectance component of the sample was difuse and also, that the measured transmittance and relectance components of both possible substrates was collimated, exhibiting a diferent proile to that seen on the whole stack sample. Thus, these postulates simplify the mathematical expressions that are used to explain the optical properties of the studied layer of material, as agreed by several authors12-14.
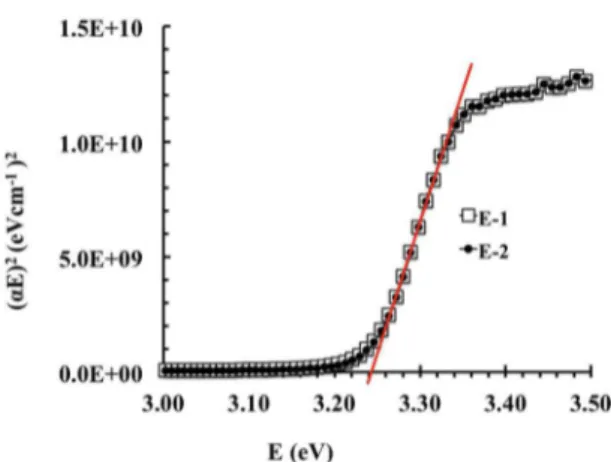
Figure 5. Tauc’s plot obtained through the application of K-M case
for an ininitely thick layer. The two mathematical expressions applied for estimation of S (E-1 and E-2) resulted in analogous plotted proiles.
Figure 6. Tauc’s plot obtained through the application of the formulas
deined for general application of K-M method.
Figure 7. Fluorescence spectrum of sample Z obtained with
excitation of 325 nm. Emission at 380 nm closely resembles with the computed values of BG obtained with the application of methods M1, M2 and M3.
a deviation of about 11% (Equations E-1 and E-2 in Table 1). However, both formulas had negligible impact on Tauc’s plot as they generated the same BG values, around 3.24 ± 0.01 eV. Results of the application of M3 appear in Figure 5.
An alternative route for BG estimation following K-M theory considers the contribution of the substrate (M4, results shown in Figure 6). For this case, a set of more complex equations become available and demand the knowledge of the substrate relectance (Rg). As a irst approximation we
considered Rg = RD Ti, since the interaction of the substrate with the nanostructure or the air is diferent. Even though RD Ti is almost insigniicant (from Figure 3a), its inclusion resulted in an estimation of the optical BG of 3.17 ± 0.01 eV. This value of BG implied a shift of the absorption to higher wavelengths (around 391 nm instead of 382 nm for 3.24 eV). Previous result suggests that Rg should be lower than RD Ti, consistent with the fact that the refractive index of ZnO is higher than that of air, and closer to that of TiO2. Consequently, outcomes from methods M1-M4 are in good agreement with the optical BG determined for ZnO nanorods despite the substrate employed and the dimensions of the nanorods 9,10.
The luorescence spectrum of the stack sample was obtained in order to compare the energy required to stimulate fundamental electronic transitions on the ZnO nanorods, with the computed values of BG achieved within the application of all methods (M1-M4). Figure 7 shows the resulting spectrum, it is clearly seen that various emissions were detected. Emissions at 325 nm and 650 nm resulted from irst and second order scattering due to the selected excitation wavelength, respectively. The observed emission at 380 nm (FWHM 20 nm) was attributed to the direct recombination of electrons and holes within the material, suggesting a BG of approximately 3.26 eV, which matches at a great extent with the computed values resulting from M1 to M3. Additionally, a second order non linear emission related
with previous phenomena was observed at 760 nm. Finally, a broad peak centered at around 510 nm (FWHM 100 nm) which could be associated to several mechanisms related with the structure of ZnO, including transitions between singly ionized oxygen vacancies and photoexcited holes, surface defects, among others, as announced and previously observed in other reports17-19. Interestingly, these emissions in the visible region are not dependent on the morphology of the ZnO. The luorescent contribution of the substrate was not observed.
4. Conclusions
the almost negligible Rg as the substrate contribution. The computation of the BG by standard equations was corroborated by luorescence spectroscopy, which indicated that approximately 3.26 ± 0.09 eV of energy was required for the excitation of ZnO. Results indicated that all mathematical approximations are useful for the determination of the BG when other techniques are not available. However, it is appropriate to measure the optical properties of all involved surfaces in order to determine the nature of light-matter interactions.
5. Acknowledgements
The authors would like to thank SEP-CONACYT (project N° 242612) for their partial inancial support.
6. References
1. Selj JH, Mongstad T, Hauback BC, Karazhanov SZ. The dielectric functions and optical band gaps of thin ilms of
amorphous and cubic crystalline Mg~ 2NiH~ 4. Thin Solid Films.
2012;520(22):6786-6792.
2. Hichou AE, Stein N, Boulanger C, Johann L. Structural and
spectroscopic ellipsometry characterization for electrodeposited
ZnO growth at diferent hydrogen peroxide concentration. Thin Solid Films. 2010;518(15):4150-4155.
3. Murphy AB. Optical properties of an optically rough coating from inversion of difuse relectance measurements. Applied Optics. 2007;46(16):3133-3143.
4. Curiel F, Vargas WE, Barrera RG. Visible spectral dependence of the scattering and absorption coeicients of pigmented coatings from inversion of difuse relectance spectra. Applied Optics.
2002;41(28):5969-5978.
5. Wang MD, Zhu DY, Liu Y, Lin Z, Zheng CX, He ZH, et al.
Determination of Thickness and Optical Constants of ZnO Thin
Films Prepared by Filtered Cathode Vacuum Arc Deposition.
Chinese Physics Letters. 2008;25(2):743-746.
6. Vargas WE, Niklasson GA. Applicability conditions of the Kubelka-Munk theory. Applied Optics. 1997;36(22):5580-5586.
7. Sapkal RT, Shinde SS, Waghmode TR, Govindwar SP, Rajpure KY, Bhosale CH. Photo-corrosion inhibition and photoactivity enhancement with tailored zinc oxide thin ilms. Journal of Photochemistry and Photobiology B: Biology. 2012;110:15-21.
8. Tabbal M, Kim T, Woolf DN, Shin B, Aziz MJ. Fabrication and
sub-band-gap absorption of single-crystal Si supersaturated with Se by pulsed laser mixing. Applied Physics A. 2010;98(3):589-594.
9. Foo KL, Hashim U, Muhammad K, Voon CH. Sol-gel synthesized
zinc oxide nanorods and their structural and optical investigation for optoelectronic application. Nanoscale Research Letters.
2014;9(1):4291.
10. Krunks M, Katerski A, Dedova T, Acik IO, Mere A.
Nanostructured solar cell based on spray pyrolysis deposited ZnO nanorod array. Solar Energy Materials and Solar Cells.
2008;92(9):1016-1019.
11. Murphy AB. Modiied Kubelka–Munk model for calculation of the relectance of coatings with optically-rough surfaces.
Journal of Physics D: Applied Physics. 2006;39(16):3571-3581.
12. Džimbeg-Maľić V, Barbarí-Mikǒević Ž, Itrić K. Kubelka-Munk theory in describing optical properties of paper (I). Tehnički Vjesnik/Technical Gazette. 2011:18(1):117-124.
13. Kubelka P. New contributions to the optics of intensely
light-scattering materials. Part I. Journal of the Optical Society of America. 1948;38(5):448-457.
14. Lin H, Huang CP, Li W, Ni C, Shah SI, Tseng YH. Size dependency
of nanocrystalline TiO2 on its optical property and photocatalytic
reactivity exempliied by 2-chlorophenol. Applied Catalysis B: Environmental. 2006;68(1-2):1-11.
15. Sáenz-Trevizo A, Amézaga-Madrid P, Fuentes-Cobas L, Pizá-Ruiz P, Antúnez-Flores W, Ornelas-Gutiérrez C, et al.
Microstructural, chemical and textural characterization of ZnO nanorods synthesized by aerosol assisted chemical vapor deposition. Materials Characterization. 2014;98:215-221.
16. Stenzel O. The Physics of Thin Films Optical Spectra. Berlin:
Springer-Verlag; 2005. 277 p.
17. Zhang Y, Mi L, Zheng Z. Study on the structure and optical
property of Zn1−xCuxO sol–gel thin ilms on quartz substrate.
Physica B: Condensed Matter. 2017;407(12):2254-2257.
18. Yue Q, Cheng J, Li G, Zhang K, Zhai Y, Wang L, et al. Fluorescence Property of ZnO Nanoparticles and the Interaction with Bromothymol Blue. Journal of Fluorescence.
2011;21(3):1131-1135.
19. Bekermann D, Ludwig A, Toader T, Maccato C, Barreca D, Gasparotto A, et al. MOCVD of ZnO Films from Bis(Ketoiminato) Zn(II) Precursors: Structure, Morphology and Optical Properties.


