*e-mail: [email protected]
Micro and Nanometric Wear Evaluation of Metal Discs Used on
Determination of Biodiesel Fuel Lubricity
Aline Cristina Mendes de Farias*, João Telésforo Nóbrega de Medeiros, Salete Martins Alves
Tribology and Dynamic Laboratory, Department of Mechanical Engineering, Federal University of Rio Grande do Norte – UFRN, Campus Universitário Lagoa Nova, CEP 59072-970, Natal, RN, Brazil
Received: June 24, 2013; Revised: June 9, 2014
The contact of diesel fuel with engine subsystems demands a good wear resistance. Lubricity is an important feature for integrity of injection system and the sulphur composites are primarily responsible for lubrication of the injector nozzle. Biodiesel is responsible for partially restoring the lubricity of diesel fuel that presents low levels of sulphur composites and, furthermore, it causes less pollution than diesel fuel. The lubricity is measured through the wear scar diameter following the ASTM D 975 standards. However, the friction and wear with light loads of micro/nanocomponents are highly dependent on surface interactions that can be evaluated by microscopy techniques. This study aimed to measure and to analyze the biodiesel lubricity and their blends (B5, B20) with diesel by observing the wear scars of discs using the scanning electronic microscopy (SEM), atomic force microscopy (AFM) and micro roughness techniques. The fuels performance was evaluated using HFRR tribometer. The tests conditions were based on standard ADTM D-6079-04. The coefficient of friction was measure during the test. After the test, the worn ball and disc were analyzed by SEM, AFM and profilometer. The results showed that the addition of biodiesel in diesel improve the tribological performance of fuel. Also, the just WSD value is not sufficient to evaluate the lubrication ability of a fuel. Analysis of the worn disc surfaces proved to be compatible with WSD number and also more sensitive to these kinds of fuels, showing mainly the form and intensity of the wear.
Keywords: AFM, WSD, roughness, biodiesel, lubricity, HFRR
1. Introduction
Biodiesel fuel is an environmentally friendly alternative, which is obtained by transesterification of vegetable oils producing alkyl esters of long chain fatty acids1,2. It is an
environmentally and economically interesting option to generate technology and incomes to Brazil. These fuels are transesterified vegetable oils of soybean, sunflower, castor and palm3, whose main importance of use is related to the
needs of reducing the pollutant gases that are present in the combustion emissions during engines use4.
Blends of biodiesel promote the formation of better fuels than diesel oil, because of its low sulfur content, high flashpoint and low aromatic content. Besides, engines using biodiesel as an energy source emit fewer pollutants for the atmosphere5,6, containing 78% and 98% less CO
2 and
sulfur, respectively. Other advantages of biodiesel when compared to conventional diesel include biodegradability and national source7.
In order to reduce the emission of pollutants from diesel oil, biodiesel is added to it, which can also increase its lubricity. From the tribological point of view, the lubricity of biodiesel and the lifetime of fuel supply line are correlated8.
The lubricity is defined by the ability to reduce friction and wear on surfaces under load and relative motion. The most common method to evaluate fuel lubricity is described by ASTM D-6079. This standard determines the lubricity
by evaluation of wear scar diameter (WSD) in µm, as measured in the x and y axis, produced on the ball surface due to reciprocating sliding against the pressure plate, both immersed in fluid9.
Generally, smaller wear scar signifies greater lubricity that ensures the effectiveness of interfacial lubricant fuel film on the separating action of these surfaces10. This thin
film is formed by adsorption of polar molecules of fuel on metal surfaces, i.e., there is a high affinity to metallic surfaces forming a thin protective metal-metal contact. The maximum permitted WSD by American and European standards is 520 µm (ASTM D 975-10) to 460 µm (EN 590 -10) to 60° C, respectively11.
The lubricity issue is significant because of the advent of low-sulfur petrodiesel fuels and, more recently, ultralow-sulfur diesel (ULSD) fuels, as required by regulations in the United States, Europe, and elsewhere. This can promote failure of engine parts such as fuel injectors and pumps, because they are insufficient lubricated by the fuel. The reason for poor lubricity of ULSD is not the removal of sulfur-containing compounds, but rather that polar compounds with other heteroatoms such as oxygen and nitrogen are also reduced in this petrodiesel11-13.
Most papers refer to lubricity just as a function of WSD (wear scar diameter). Hu et al.14 developed a study
lubricity of diesel (S166 ppm) blended with 2% wt/wt of biodiesel. They could note that all the unrefined biodiesels showed improved lubricity properties over all the refined biodiesels, WSD (351-429 µm) were lower than 460 µm of EN590. Bučinskas15 investigated the tribological properties
of biodiesel fuel and its mixtures. They concluded that regular diesel fuels have more stable properties, although pure biodiesel showed the lowest coefficient of friction.
Muñoz et al.16 evaluated the lubricity of diesel and
the mixtures of biodiesel with diesel fuel, using HFRR method. Different biodiesel blends were used to compare their lubricant responses on the wear scars. Diesel fuel with 50 ppm of sulphur (S50) without lubricant additive promoted an approximate wear scar of 600 µm. Nonetheless, when this diesel included small percentages of biodiesel, lubricity got closer to the one of a conventional diesel fuel (wear scars of 283 µm and 312 µm with 10% (B10) and 5% (B5) biodiesel, respectively, compared with 314 µm developed with conventional diesel fuel).
The lubricity of numerous fatty compounds was studied by Knothe and Steidley7. The effects of blending compounds
found in biodiesel on petrodiesel lubricity were also studied. Lubricity was determined using the high-frequency reciprocating rig (HFRR) test. They concluded that fatty compounds possess better lubricity than hydrocarbons, because of their polarity-imparting O atoms. Also, Lubricity improves somewhat with the chain length and the presence of double bonds. An order of oxygenated moieties enhancing lubricity (COOH > CHO > OH > COOCH3 > CdO > C-O-C) was obtained from studying various oxygenated C10 compounds. These authors evaluated lubricity just in function of WSD.
Pehan et al.17 studied the influence of B100 rapeseed
biodiesel fuel on roughness of some components of injection system in controlled diesel engine. According to these researchers, the surface roughness at the pump plunger head is not as important as the roughness at the pump plunger skirt; and after biodiesel usage, the surfaces showed better lubrication conditions than the diesel usage, whereas Ra (arithmetic roughness) parameter was of 0.45 to 0.40 µm.
The WSD does not provide sufficient information in case of critical markets and diesel fuels. Possible approaches for improvements are disclosed in this article. The HFRR method is kept as intended, but complemented by additional evaluation methods, e.g. by micrographic and topographic analyses and measurement of worn disc surfaces for a better understanding of the tribological processes happening in the contact zone (ball-fuel-disc).
This work aimed to establish other parameters to measure the lubricity and their correlations with WDS. So, the fuel lubricity was evaluated by the AFM (contact mode), SEM and microroughness techniques, analyzing the disc scars used in HFRR testing of soybean and sunflower biodiesels and their B5 and B20 blends with diesel S1200 (1100 ppm sulfur).
2. Materials and Methods
2.1.
Ball and disc characterization
In HFRR test, the tribological couple is composed by ball (quenched and tempered) and disc, both made of AISI 52100 steel (SAE 52100), whose chemical compositions, by X-Ray Fluorescence technique, are shown on Table 1.
The dimensions of the tribological couple are: hard polished ball of 6 mm and smooth polished disc of 10 mm of diameter and 3 mm of height, according to ASTM D 6079-049. The Vickers microhardness tests are performed
for both ball and disc surface which consisted by applying the Vickers indenter (diamond pyramid with square base and apical angle of 136°) on the sample surface during 15 seconds with the following loads: 50 gf or 0.49 N (HV0.05), for disc surfaces; and 200 gf or 1.96 N (HV0.2), for ball surfaces. The Vickers microhardness values showed average range of 174 to 190 HV0.05 to disc surfaces and 585 to 677 HV0.2 to ball surfaces to the non-worn condition surface, as can be seen on Table 2.
2.2.
Fuel samples preparation
A total of seven fuel samples were evaluated in this work. Diesel (mineral conventional diesel fuel, 1100 ppm sulfur) was obtained from Petrobras S.A., which was used as the comparison fuel. Biodiesels were obtained by the ethylic transesterification process of commercial soybean and sunflower oils with potassium hydroxide catalyst and ethanol 99.5 %, synthesized in the NUPEG II Laboratory of the Federal University of Rio Grande do Norte. Besides diesel and biodiesel, some blends of these fuels were evaluated, in 5 % and 20 % volumetric concentration of biodiesel (B5 and B20). Table 3 describes the blends and their abbreviations.
2.3.
Tribological test
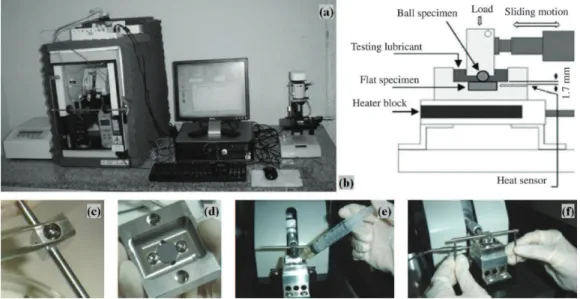
Lubricity of the fuels was evaluated using the HFRR from PCS Instruments, as shown in Figure 1. It is a ball-on-disc test to measure friction and wear under boundary lubrication conditions using a highly stressed ball-on-disc
Table 1. Chemical composition by weight (% p.) from the AISI 52100 steel disc.
Fe C Mn Cr S Si Al Ca
Bal. 0.900 0.413 1.567 0.127 0.546 0.105 0.154
Table 2. Microhardness HV averages of the non-worn ball and disc surfaces.
Avg. Values B0-Diesel B100-SB B20-SB B5-SB B100-SF B20-SF B5-SF
HV0.2 (Ball) 585±42 614±119 644±101 677±153 670±80 585±55 600±41
contact. A hard steel ball slides on a softer steel disc under the fully submerged fuel condition (2.0 ± 0.2 mL) at normal load of 1.96 ± 0.01 N and a 1.00 ± 0.02 mm stroke length at a frequency of 50 ± 1 Hz for 75 min. Fuel temperature was kept at 60± 2 °C, according to the ADTM D-6079-049,
where the heating of contact is measured at 1.7 mm distance of the ball-on-disc contact.
The repeatability of the data (coefficient of friction and wear scar diameter) provided in the HFRR tests was evaluated using seven replicates for each fuel. In order to minimize any outside interference during the tests, humidity and temperature were controlled. COF (coefficient of friction) was measured by a piezoelectric force transducer. At the end of the test, the ball is removed from HFRR to measure the WSD (wear scar diameter) at the optical microscopy with magnification of 100 times. The resulting scar size, WSD was corrected to normalize the vapor pressure to 1.4 kPa (WS 1.4 number), established by ISO 1215618.
2.4.
Techniques of surface analysis
The wear scar of discs was analyzed by micro and nanometer scales through rugosimeter, SEM and AFM techniques. The dominant wear mechanisms and surface
topographies of the worn discs were studied with a SEM. The microroughness tests carried out by mechanical stylus method used Taylor Hobson Surtronic 25 rugosimeter to verify new and worn disc (perpendicular to sliding direction on worn surfaces). To evaluate the developed changes in topography during HFRR tests, SEM and AFM equipments were used. Before observation, the disc specimens were ultrasonically rinsed with ethyl alcohol. The SEM was operated at accelerating voltages of 30 kV. Representative SEM micrographs of the wear tracks were obtained at 100x and 1000x magnifications.
3. Results and Discussion
In this section are presented the lubricity results obtained in function of WSD number, as proposed by standards, and also considering other parameters such as coefficient of friction and topographic analysis of wear tracks by roughness, AFM and SEM. These data were obtained by considering seven repetitions of HFRR test.
3.1.
Lubricity: wear scar diameter (WSD) and
coefficient of friction (COF)
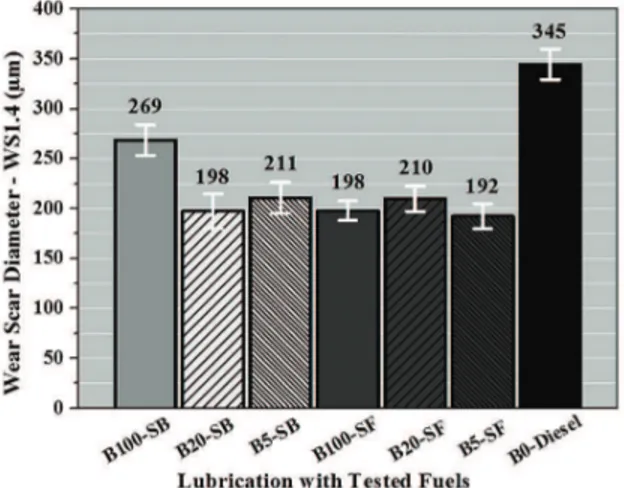
The WSD and COF average data are exhibited in Figures 2 and 3, respectively. The COF and WSD are effective correlated parameters to evaluate the lubricity of biodiesel. According to ASTM D975:201019, the WSD
number (or WS1.4) is the main parameter to measure the diesel/biodiesel lubricity and it is compared to the European regulation (DIN EN 590)20, which establishes a maximum
WSD of 460 µm. Figure 2 shows WSD values obtained by optical microscopy, with 100 x magnification, it was used to examine the wear scar of the ball surfaces after each test. Based on these results, B0-Diesel presented highest values (345 ± 15 µm) and, consequently, a smaller lubricity than the biodiesel fuels and their blends, however it was smaller than the maximum value of 460 µm, requirements defined in the World Fuel Charter World Fuel Charter.
Table 3. Description of fuels on ball-disc contact.
Fuels Description
B0-Diesel Mineral conventional diesel fuel, 100 % of diesel oil, S1100
B100-SB 100 % ethyl ester of soybean oil
B20-SB 20 % ethyl ester of soybean r oil + 80 % B0-Diesel
B5-SB 5 % ethyl ester of soybean oil + 95 % B0-Diesel B100-SF 100 % ethyl ester of sunflower oil
B20-SF 20 % ethyl ester of sunflower oil + 80 % B0-Diesel B5-SF 5 % ethyl ester of sunflower oil + 95 % B0-Diesel
Thus, the lubricity tests demonstrated that incorporating of biodiesels in small (5%) or medium (20%) percentage, without a conventional lubricity additive, improves the lubricant properties of the fuel, which their wear scars were around 200 µm. Similar results were observed by16,21-23.
Lapuerta et al.23 when they studied the lubricity of ternary
fuel blends (ethanol-biodiesel-diesel). They verified that the addition of small biodiesel concentrations (2 %wt/wt, approximately) improved the lubricity much more than adding 30 % wt/wt (WSD of 257 µm). Also, Muñoz et al.16
measured the WSD of biodiesel made from vegetable oil previously used for frying and purified in the laboratory. The blends with 5, 10 and 100% of biodiesel showed WS1.4 of 312 µm, 283 µm and 322 µm, respectively.
It is also possible to conclude that WSD is an approximated measure and it is susceptible to high variations depending on the measurement method, as it can be observed in Figure 2. Due to this fact, this paper analyses the lubricity
based on tribological properties and microscopy techniques. According to Figure 3, the coefficient of friction decreased with an increase in the content of the ethyl esters; the lowest values were found for pure biodiesels (B100-SB and B100-SF). The initial values are high until first 25x103 cycles
for the lubricated tests by B0-Diesel and B100-SB and 100-SF, while the blends of both biodiesel fuels offered the highest stability of friction than these other fuels. In this graph, the medium values of COF were higher to B0-Diesel (0.122) than the soybean (0.079) and sunflower (0.078) biodiesel fuels and their respective blends with 20% (0.088 and 0.086) and 5% (0.099 and 0.097). Furthermore, it should be considered that these biodiesel fuels have greater ability to protect the surfaces of pieces than B0-Diesel (S1100), due to their high contents of oxygenated compounds and fatty acids. Thus, the oxygen present in biodiesel can accelerate the generation of Fe3O4 film, which is a good lubricant24.
3.2.
Worn steel disc surface analysis
Figures 4 and 5 show representative SEM micrographs of wear tracks on disc specimens lubricated with mentioned fuels using HFRR test. The wear tracks were generated by ball rubbing against each disc. The first column presented the micrographs with 100 times magnification of full scar and its length value; the arrows indicate the direction of ball movement. The second and third columns show wear tracks with 1000 times of the center (area a) and lateral prow (area b) of the scars. The morphologies demonstrated that the dominant wear mechanisms were adhesion and abrasion.
The abrasion wear is noted by prow formation and ploughing on disc specimens, while the adhesive wear is represent by materials transfer resulting from strong metal-to-metal contact with these fuels. Crockett et al.25 found
in their experiments with commercial diesel fuel, using the HFRR test, which the iron required for decomposition of the hydrocarbons must come from the wear particles formed during sliding. Abrasive wear was generated by Figure 2. WS1.4 number after 225,000 cycles of lubricity HFRR.
difference between hardness of ball and disc and lubrication conditions. When the difference on hardness is greater than 20% (see Table 2), the abrasion can occur; and its intensity depends on the lubrication conditions, i.e., viscosity, sliding speed and normal load. So, increasing the normal load on the contact, decreasing the sliding speed or decreasing the lubricant viscosity all tend to reduce film thickness, and consequently, abrasion26 is greater.
From the micrographs obtained (Figures 4 and 5), diesel fuel produces more deposits (black points) when compared with biodiesel and their blends fuel. Nevertheless, according to Arifin et al.27, is not only the fuel type that can affect the
fuel deposition, other factors are impingement interval, hot surface temperature, and heat transfer of deposits. These factors depend on adhesion force, which arises mainly from Van der Waals and capillary forces acting between two contacting surfaces and it depends on surface reactivity and affinity to fluid of the interacting surfaces. Sukjit et al.28
employed the energy dispersive spectrometer (EDS) to report the main chemical composition of almost all the black residues on the test disc was carbon. According to them, carbon formation is a result of the heat generated during fretting between the specimen surfaces which leads to acceleration of the adsorption process from the chemical reactions of the hydrocarbons in the fuels, which are good lubricating properties when the fuel can be adsorbed onto the worn surfaces.
promote a reduction of about 12% on length of wear scar. Komvopoulos et al.29 used the micrographs analysis to
study the tribological performance of the tribofilms and their association with wear mechanisms. According to their observation, the increasing in the wear resistance of the steel surfaces depends strongly on the type of additives, tribofilms composition, and temperature.
Sulek et al.22 suggested that wear can be characterized
by analyzing the profile of the wear scar, by such measures it can be confirmed that the wear is not a monotonic function of the concentration of ester. Figures 6 and 7 show the superficial roughness of these discs, with non-contact region (on the left) and worn condition, i.e., wear profiles measured perpendicular to the friction path (on the right). The roughness profiles are presented with their Ra and Rz parameters for non-contact region, and maximum depth and area of scar after lubricated tests with studied biodiesel/ diesel fuels. Ra is an arithmetic roughness average and Rz is an average peak-to-valley height.
According to the profiles in Figures 6 and 7, the positive influence of biodiesel in the wear can be seen due to the lowest values of“maximum depth”and “area” of the scar presented in the profiles (on the right). So, for all cases, it was noted that the region of the worn disc lubricated with B0-Diesel offered the highest maximum depth and area of scar, respectively 4.45 µm and 1191 µm2. These results
indicated that abrasion under the B0-Diesel was larger than that of the biodiesels and their blends, which were conformed to the results of SEM.
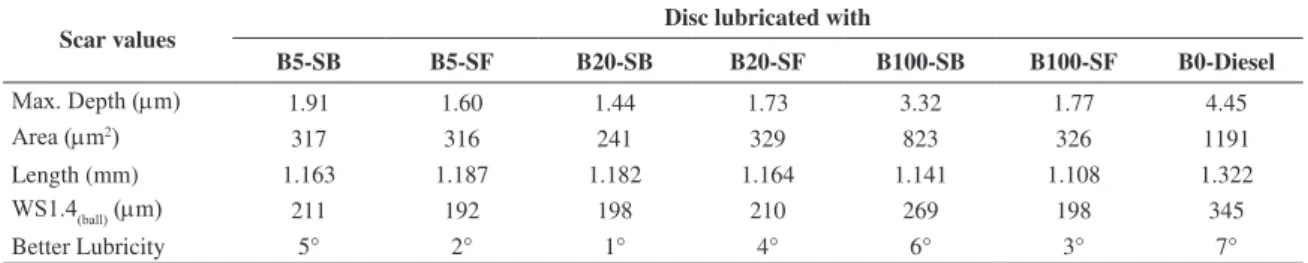
So, these results confirmed the previous analysis (WS1.4 averages values, Figure 2). Surface roughness played an important role on the abrasion characteristics. The Table 4 summarizes the values of disc scar obtained by SEM and roughness analyses and their comparison with average WS1.4. According to these results, low values of the maximum depth and area of the disc scars indicate better fuel lubricity. The last line is used to classify the fuel performance. It appears that ester blends in fuel oil considerably reduces the depth of a wear scar compared to the B0-Diesel. Therefore, the use of B20-SB presented the best lubricity; at the other extreme, it is confirmed that the B0-Diesel offers the worst among the investigated lubricity fuels. However, B100-SB offered the second worst performance; this corroborates with the WSD values (Figure 2).
Figures 4 and 5 showed that numerous plowing grooves parallel to the sliding direction were observed on the wear tracks; however only 2D images are not sufficient to show the intensity of wear; so, the topographic images are necessary to a detailed wear observation. Asperities are referred to peaks in a profile (two dimensions) and in a surface map (three dimensions). Nano and microroughness include those features intrinsic to the production process. These are considered to include traverse feed marks and other irregularities within the limits of the roughness sampling length30.
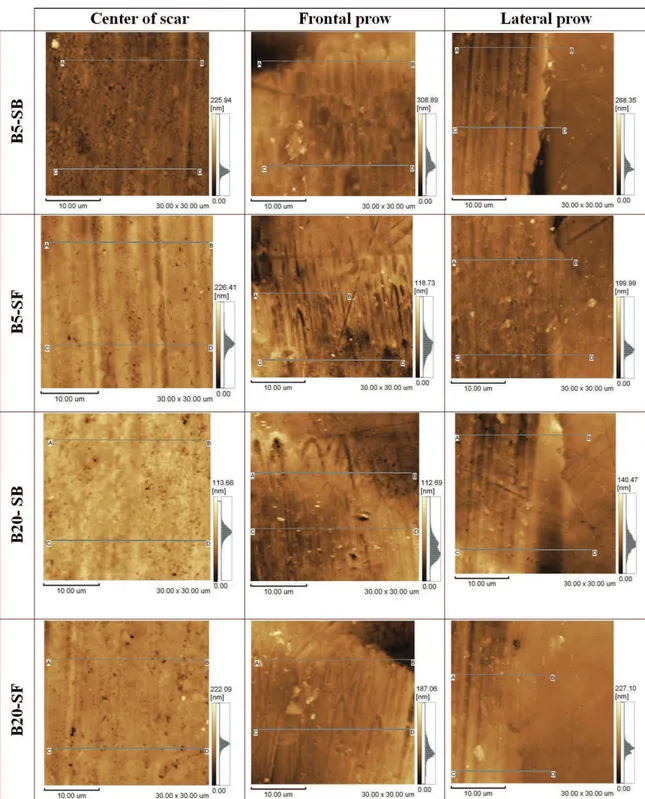
tests. Figures 8 and 9 show topographic images with textures of wear tracks of steel discs using areas of 30 µm x 30 µm obtained by contact mode of separation distance between 10 to 100 nm of the cantilever and analyzed surface. The presented line segments were used to calculate the nanoroughness parameters showed in Table 5. These data have a direct correspondence with the intensity of wear of these areas.
In Figures 8 and 9 are presented homogeneous areas and with the predominant ploughing wear form; abrasion is the main mechanism observed in the prow formation and in track surface. Therefore, the topographic image of disc, that was lubricated by B0-diesel oil, exhibited peaks and valleys repeated along the friction direction. After the B0-diesel test, it was also observed that the scuffing phenomena
occurred to the disc, and then the maximum roughness of disc was found to be increased up to 212 nm. However, after the B100, B20 and B5 blends tests, it was clearly observed that the texture images were changed because of biodiesel concentrations in the blends. Smoother and shallower peaks and valleys were observed for tested discs with biodiesel blends, mainly for B20-SB and B20-SF.
According to Table 5, the Ra and Rz nanoroughness values of these disc surfaces initially decreased with increasing biodiesel content in the blends. The B100-SF exhibits the smaller Ra value, while B0-diesel shows the highest Ra values. The addition of 20% of biodiesel in the diesel improves the results of roughness significantly. This result is according to the previous analyses (WS1.4, SEM and roughness evaluation).
Figure 7. Roughness profile after lubricity tests with diesel and biodiesel fuels: on the left, new disc; on the right, role area of scar.
Table 4. Analysis of lubricity performance by the roughness and SEM techniques.
Scar values Disc lubricated with
B5-SB B5-SF B20-SB B20-SF B100-SB B100-SF B0-Diesel
Max. Depth (µm) 1.91 1.60 1.44 1.73 3.32 1.77 4.45
Area (µm2)
317 316 241 329 823 326 1191
Length (mm) 1.163 1.187 1.182 1.164 1.141 1.108 1.322
WS1.4(ball) (µm) 211 192 198 210 269 198 345
Better Lubricity 5° 2° 1° 4° 6° 3° 7°
Fuel Location Ra (nm) Rz (nm)
Line A-B C-D A-B C-D
B20-SB Center 6.55 5.28 47.31 32.62 Frontal 10.18 10.25 57.15 44.85 Lateral 15.53 14.88 68.25 60.87 B5-SB Center 9.18 6.63 68.29 54.77 Frontal 40.21 15.03 181.45 78.26 Lateral 22.37 10.68 141.7 78.58 B20-SF Center 8.9 9.73 73.65 108.87 Frontal 14.97 9.45 102.65 57.59 Lateral 9.29 16.48 75.4 65.22 B5-SF Center 12.01 10.52 88.92 81.51 Frontal 6.65 13.11 34.99 72.31 Lateral 4.89 11.2 36.64 91.89
Fuel Location Ra (nm) Rz (nm)
Line A-B C-D A-B C-D
4. Conclusion
Based on results obtained in this research, some conclusions can be drawn:
• To determine the lubricity just as function ofWS 1.4 don´t demonstrate the real fuel lubrication performance, because it is susceptible to high variations due to the measurement method;
• Thecoeficientoffrictionshowsthatbiodieselpure are more effective on friction reduction, indicating a better formation of lubricant film. This result is not compatible with WS1.4 analyze that presents high values;
• Itwaspossibletonotethatthemaximumdepthand area of scar showed proportional relationship with the WS1.4 number. The small values can be observed for use of biodiesel blends (5-20%);
• SEMandAFMtechniquesaregoodtoolstoevaluate tribological performance of different fuel. They give about intensity and nature of wear. The adhesion and abrasion were mainly wear mechanism observed in
the HFRR test. When diesel was used as fuel, the severe wear was observed, however the biodiesel addition decrease the wear and give a smooth surface;
• The use of the HFRR for studies in diesel fuel performance can be significantly increased when profile and surface evaluation is performed. The standard evaluation method delivering WS1.4 value turned out to be insufficient to evaluate the tribological performance.
Acknowledgements
We would like to thank the CAPES, LabPasma, LCM, NUPEG II, NEPGN and Tribolgy and Dynamic laboratories. Also, the authors wish to express their thanks to Dr. Cleiton Rubens Formiga Barbosa, Dr. Djalma Ribeiro da Silva, Dr. Eduardo Lins de Barros Neto, Dr. Clodomiro Alves Jr. and Dr. Danilo Cavalcante Braz from the Federal University of the Rio Grande do Norte, for their assistance in the present work.
References
1. Dunn RO and Knothe G. Alternative diesel fuels from vegetable oils and animal fats. Journal of Oleo Science. 2001; 50(5):415-426. http://dx.doi.org/10.5650/ jos.50.415
2. Knothe G and Dunn RO. Biofuels derived from vegetable oils and fats. In: Gunstone FD and Hamilton RJ, editors.
Oleochemical manufacture and applications. Sheffield: Sheffield Academic Press; 2001. p. 106-163.
3. Tavares MLA, Queiroz N, Santos IMG, Souza AL, Cavalcanti EHS, Barros AKD et al. Sunflower biodiesel: use of P-DSC in the evaluation of antioxidant efficiency. Journal of Thermal Analysis Calorimetry. 2011; 106(2):575-579. http://dx.doi. org/10.1007/s10973-011-1357-4
4. Knothe G, Gerpen JV, Krahl J and Ramos LP. Manual de biodiesel. São Paulo: Edgard Blücher; 2006.
5. Agarwal D, Kumar L and Agarwal AK. Performance evaluation of a vegetable oil fuelled compression ignition engine.
Renewable Energy. 2008; 33(6):1147-1156. http://dx.doi. org/10.1016/j.renene.2007.06.017
6. Freitas SM and Fredo C. Biodiesel à base de óleo de m a m o n a : a l g u m a s c o n s i d e r a ç õ e s . I n f o r m a ç õ e s Econômicas. 2005; 35(1):37-42.
7. Knothe G and Steidley KR. Lubricity of componentes of biodiesel and petrodiesel: the origino f biodiesel lubricity.
Energy & Fuels. 2005; 19(3):1192-1200. http://dx.doi. org/10.1021/ef049684c
8. Farias ACM, Santana JS, Oliveira Filho MF, Santana JS, Barbosa CRF and Medeiros JTN. Os combustíveis verdes do Brasil - avaliação da lubricidade do biodiesel b5 e óleos de rícino e coco. Holos. 2011; 3(27):4-17.
9. American Society for Testing and Materials - ASTM. D 6079: Standard test method for evaluating lubricity of diesel fuels by the high-frequency reciprocating rig (HFRR). West Conshohocken; 2005.
10. Farias ACM. Análise da lubricidade do biodiesel brasileiro de ésteres etílicos de soja e girassol. [Dissertação]. Natal: Universidade Federal do Rio Grande do Norte; 2011. 11. Barbour RH, Rickeard DJ and Elliott NG. Understanding diesel
lubricity. SAE International; 2000. SAE Technical Paper. http://dx.doi.org/10.4271/2000-01-1918
12. Wei D and Spikes HA. The lubricity of diesel fuels. Wear: an international journal on the science and technology of friction lubrication and wear. 1986; 111(2):217-235. http://dx.doi. org/10.1016/0043-1648(86)90221-8
13. Dimitrakis WJ. The importance of lubricity. Hydrocarbon Engineering. 2003; 8:37-39.
14. Hu J, Du Z, Li Cand Min E. Study on the lubrication properties of biodiesel as fuel lubricity enhancers. Fuel. 2005; 84:1601-1606.
15. Bučinskas RSV. Tribological properties of biodiesel fuel and its mixtures with diesel fuel. In: Proceedings of the 6th International Scientific Conference TRANSBALTICA; 2009; Vi l n i u s . L i t h u a n i a : Vi l n i u s G e d i m i n a s Te c h n i c a l University; 2009. p. 24-27.
16. Muñoz M, Moreno F, Monné C, Morea J and Terradillos J. Biodiesel improves lubricity of new low sulphur diesel fuels.
Renewable Energy. 2011; 36(11):2918-2924. http://dx.doi. org/10.1016/j.renene.2011.04.007
17. Pehan S, Jerman MS, Kegl M, Kegl B. Biodiesel influence on tribology characteristics of a diesel engine.
Fuel. 2009; 88(6):970-979. http://dx.doi.org/10.1016/j. fuel.2008.11.027
18. International Organization for Standardization - ISO. ISO 12156-1:2007 (en). Diesel fuel – Assessment of lubricity using the high-frequency reciprocating rig (HFRR) – Part 1: Test method. 2nd ed. Geneva: ISO; 2013. p. 1-12.
19. American Society for Testing and Materials – ASTM. ASTM D 975: Standard specification for diesel fuel oils. West Conshohocken; 2005.
20. Deutsches Institut für Normung – DIN. DIN EN 590:2010. Automotive fuels - Diesel - Requirements and testmethods. New Jersey: DIN; 2005.
21. Suarez PA, Moser BR, Sharma BK and Erhan SZ. Comparing the lubricity of biofuels obtained from pyrolysis and alcoholysis of soybean oil and their blends with petroleum diesel.
Fuel. 2009; 88(6):1143-1147. http://dx.doi.org/10.1016/j. fuel.2008.11.017
22. Sulek MW, Kulczycki A and Malysa A. Assessment of lubricity of compositions of fuel oil with biocomponents derived from rape-seed. Wear. 2010; 268(1-2):104-108. http://dx.doi. org/10.1016/j.wear.2009.07.004
23. Lapuerta M, Garcia-Contreras R and Agudelo JR. Lubricity of Ethanol-Biodiesel-Diesel Fuel Blends. Energy & Fuels. 2010; 24(2):1374-1379. http://dx.doi.org/10.1021/ ef901082k
24. Sukjit E and Dearn KD. Enhancing the lubricity of an environmentally friendly Swedish diesel fuel MK1.
Wear. 2011; 271(9-10):1772-1777. http://dx.doi.org/10.1016/j. wear.2010.12.088
25. Crockett RM, Derendinger MP, Hug PL and Roos S. Wear and electrical resistance on diesel lubricated surfaces undergoing reciprocating sliding. Tribology Letters. 2004; 16(3):187-194. http://dx.doi.org/10.1023/B:TRIL.0000009729.15103.5c 26. Hutchings IM. Tribology: friction and wear of engineering
materials. 1th ed. Cambridge: Edward Arnold; 1992. 27. Arifin YM, Furuhata T, Saito M and Arai M. Diesel and
bio-diesel fuel deposits on a hot surface. Fuel. 2008; 87(8):1601-1609. http://dx.doi.org/10.1016/j.fuel.2007.07.030
28. Sukjit E, Herreros JM, Dearn KD, García-Contreras R and Tsolakis A. The effect of the addition of individual methyl esters on the combustion and emissions of ethanol and butanol -diesel blends. Energy. 2012; 42(1):364-374. http://dx.doi. org/10.1016/j.energy.2012.03.041
29. Komvopoulos K, Pernama AS, Ma J, Yamaguchi ES and Ryason PR. Synergistic effects of boron-, sulfur-, and phosphorus-containing lubricants in boundary lubrication of steel surfaces. Tribology Transactions. 2005; 48(2):218-229. http://dx.doi.org/10.1080/05698190590927479