Color and Shade Parameters of Ultramarine Zeolitic
Pigments Synthesized from Kaolin Waste
Raquel Aranha de Menezes*, Simone Patrícia Aranha da Paz, Rômulo Simões Angélica,
Roberto de Freitas Neves, Sibele Berenice Castella Pergher
Grupo de Mineralogia e Geoquímica Aplicada, Instituto de Geociências, Universidade Federal do Pará – UFPA, Rua Augusto Corrêa, 1, Guamá, CEP 66075-110, Belém, PA, Brazil
Received: June 20, 2013; Revised: February 23, 2014
Ultramarine pigments were successful synthesized from zeolite A obtained from kaolin waste. This waste has been used as an excellent source of silicon and aluminum for zeolite synthesis because of its high kaolinite concentrations and low contents of other accessory minerals. The cost is naturally less than the industrialized product. Color additives (Sulfur and Sodium Carbonate) were mixed with different proportions of zeolite A and further calcined for 5 h at 500 °C. They were characterized by XRD and XRF in addition to visual classification by color and shade. These products show colors from blue to green at different shades, both influenced by the amount of additives and cooling rate after calcination. Thus, a different quantity of the same additives in the same zeolitic matrix provides an increase in the color intensity. Cooling rate after calcination induces the color change which is substantially important in the pigments production.
Keywords: kaolin waste, zeolite A, pigments
1. Introduction
The state of Pará is home to three large plants that process kaolin for paper coatings and are responsible for 97% of the national production of that material1. The
paper industry requires extremely fine white kaolin, which results in the accumulation of kaolinic material that does not meet the required specifications from the particle size separation and whitening stages2,3. This waste is composed
predominantly of kaolinite, and its use as a source of silicon and aluminum in the synthesis of zeolites, including zeolite A, has become technologically feasible4-6. Zeolite A is a
hydrated aluminum silicate composed of alkali metals and alkaline earths that has porous characteristics favorable to the production of ultramarine pigments7-15. The crystal
structure of this zeolite allows for a cleaner production process because its sulfur gas emissions are almost zero. In contrast, the traditional process of producing this pigment uses kaolin and results in a great deal of pollution; therefore, it is being replaced by other processes16,17.
To prepare ultramarine zeolite pigments, zeolite A is calcinated between 500 and 800 °C with different concentrations of sulfur and sodium carbonate. The reaction between the sulfur and sodium carbonate produces sodium polysulfides that diffuse through the pores and cavities of the zeolite A and act as chromophores18,19. The resulting color
can vary from blue to green, depending on the chemical composition of the starting material, reagent concentrations, temperature and time of calcination, and other factors.
The sulfur radicals S–
2 and S–3 present in zeolites, which
are responsible for its yellow and blue colors, respectively,
can also produce a green color when both radicals are present in certain proportions. According to Gobeltz et al.20,
the reaction between sulfur and sodium carbonate should follow Equation (1). Side reactions that are responsible for the formation of the previously described sulfur radicals are described by Equations (2), (3), and (4)21-23.
3Na2CO3 + 10S ↔ 2Na2S4 + Na2S2O3 +3CO2 (1)
S8 + 3O2–→ S
2O32– + S22– + S–4 (2)
3S42–↔ 2S 3 2– + S
62– (3)
S62–↔ S
3– (4)
The color of zeolite pigments is influenced by the constant S/zeolite (m/m) ratio and the varying S/Na2CO3 (m/m) ratio. Proportions of 2024,25, 4021,22, or 60 %17 sulfur
relative to the mass of zeolite are commonly used, and the S/Na2CO3 ratio is defined by considering that an excess of sodium carbonate favors the formation of S–
3 and an excess
of sulfur favors the formation of S–
2. Given this background
on the subject, the objective of this study was to obtain ultramarine pigments from zeolite A derived from kaolin waste in the Amazon region and determine the influence of the reagent concentrations and cooling rates after calcination on the color and shade of the final product.
2. Experimental Procedure
Zeolites A derived from kaolin waste were obtained by hydrothermal synthesis, under reflux4,6 as follows: 200 g of
of 5 mol/L NaOH solution (Vetec) at 95 °C in a 1 L glass reactor with mechanical stirring for 2 h, after reaction, the samples were rinsed until pH approximately 7 with distilled water and was dried at 105 °C for 24h.
The methodology adopted for the synthesis of ultramarine zeolite pigments was that described by Kowalak and Jankowska24, in which 1 g of zeolite A derived from
kaolin waste was mixed with elemental sulfur (S, Synth) and sodium carbonate (Na2CO3 99%, Nuclear) in a porcelain crucible with additive (S/Na2CO3) to zeolite ratios varying from 10 to 50% m/m, without reductive agent. A molar ratio of 1 was maintained for the S/Na2CO3 additives. The mixture was homogenized and calcinated at 500 °C, in ambient pressure, for 5 hours, in porcelain crucibles closed. After calcination, the products were cooled, washed with distilled water, and dried at 105 °C for 24 hours.
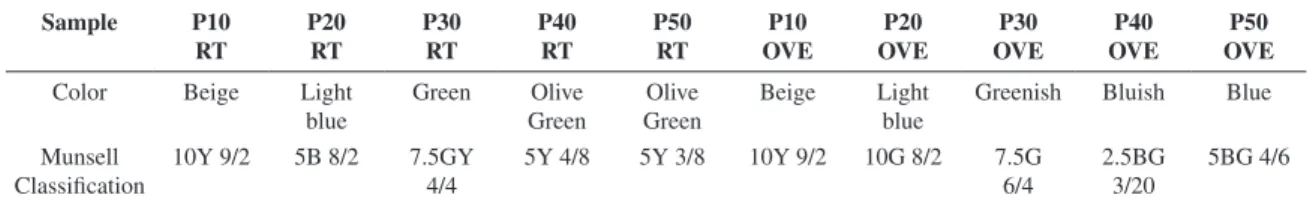
Two cooling methods were evaluated: 1) cooling at room temperature in a desiccator and 2) cooling in an oven at a cooling rate of 1 °C/min. The products were weighed before and after washing and were characterized by XRD (X´Pert Pro MPD diffractometer) and XRF (Axios Minerals, sequential spectrometer), both of which from PANalytical. Visual classification of the products’ colors and shades was performed based on the Munsell Color System. The PXX-AAA nomenclature was adopted as follows: “P” represented the product, “XX” the percentage of additives relative to the quantity of zeolite, and “AAA” the cooling method (RT - room temperature or OVE - oven).
3. Results and Discussion
3.1.
Kaolin waste and zeolite A
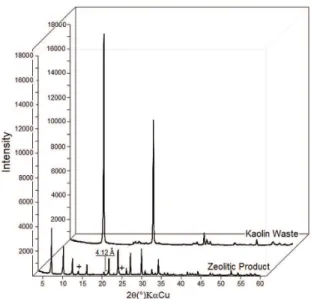
Figure 1 shows a mineralogical analysis of the kaolin waste and zeolitic product. Kaolinite was the only phase detected in the waste, demonstrating that the material was composed of one mineral and that mineral impurities, if present, were below the limits of detection. The principal phase in the zeolitic product was zeolite A, for which the d531 = 4.12 Å (21.34° 2θ) determined the sodium type (zeolite 4A). The peaks marked with “+” in the figure indicate the presence of sodalite.
The chemical analysis of the kaolin waste (Table 1) confirmed the mineralogical analysis presented above. The waste material was essentially composed of kaolinite with a Si/Al ratio approximately equal to 1, which is typical of this clay mineral. The total concentration of Fe2O3 and TiO2 was less than 1%. These results illustrated the potential use of this waste material as a source of silicon and aluminum for the synthesis of zeolite A. Table 1 also indicates that the values obtained for the zeolitic product confirmed the earlier analysis of the crystalline phase. The product was predominantly composed of sodium-type zeolite A and a small quantity of sodalite, which was also of the sodium type. The product showed an elevated percentage of sodium and a Si/Al ratio of approximately 1, which was typical of a zeolite with a low concentration of Si.
3.2.
Zeolitic pigments
The colors and shades of the pigments (Table 2) were influenced by the quantity of additives utilized in the synthesis and the cooling method after calcination. The
P10-RT and P10-OVE products maintained the same color as the reaction mixture. Neither the quantity of additives nor the cooling method resulted in any visible change due to the formation of an insufficient quantity of polysulfide chromophores or the formation of polysulfides that were not chromophores. A color gradient was first observed in the 20% additive product that increased in intensity as the proportion of additives increased. A color change was also observed that was related to the cooling method: the products that cooled more rapidly (RT) were green, and those that cooled more slowly (OVE) were blue.
In accordance with the results shown in Figure 2, it can be concluded that the initial LTA structure of the zeolite A was maintained after the pigments were produced and that the crystalline Na2SO4 phase (---- peaks) was formed in the process. Additionally, the products containing the same quantity of additives had identical diffraction patterns, even when subjected to different cooling methods. Thus, the following structural discussion is made for only one of the methods, OVE, although it is valid for both.
The decrease in the products’ diffraction intensities relative to the starting zeolite was greater for increased quantities of additives. The d622 = 3.70 Å of the zeolite A showed different shifts for each quantity of additives within
Figure 1. Diffraction patterns of kaolin waste and zeolitic product.
Table 1. Chemical analysis of kaolin waste and zeolitic product.
Components Kaolin waste Zeolitic product
SiO2 46.13 33.30
Al2O3 38.97 27.65
Fe2O3 0.57 0.39
TiO2 0.3 0.18
Na2O - 20.02
K2O <0.1 <0.1
P2O5 <0.1
-LOI 13.99 18.43
the highlighted region from 23 to 25° 2θ: the P10-OVE and P20-OVE products displayed rightward shifts with a broadening of the peak’s base, and the P30 to P50-OVE products displayed leftward shifts. The P30-OVE contained a double peak, highlighting a transition phase or a mixture of two phases, while the P40-OVE and P50-OVE had the most intense shades, and this shift was probably due to the greater incorporation of the polysulfide S3-, which was responsible
for the blue color at this (these) site(s).
The chemical compositions of the products (Table 3) show the same Si/Al ratio as the starting material, which,
together with the diffraction measurements, confirms the conservation of zeolite A and sodalite. There was a reduction in the concentration of sodium relative to the starting zeolite product due to the formation of sodium sulfate, which was removed by washing. The sulfur content in the pigments increased in proportion to the increase in the initial quantity of elemental sulfur used. The P40 and P50 products did not show differences in sulfur content such as those observed for the lower quantities of P10 to P30, which indicated a saturation limit. Therefore, the difference between the shades of P40 and P50 -RT and -OVE products, if one
Figure 2. Diffraction patterns of zeolitic product and OVE series pigments.
Table 2. Color and shade of the zeolitics pigments synthetized. The products with 10% of additives exhibited the same color of the
reactional mixture.
Sample P10
RT
P20 RT
P30 RT
P40 RT
P50 RT
P10 OVE
P20 OVE
P30 OVE
P40 OVE
P50 OVE
Color Beige Light
blue
Green Olive
Green
Olive Green
Beige Light
blue
Greenish Bluish Blue
Munsell Classification
10Y 9/2 5B 8/2 7.5GY
4/4
5Y 4/8 5Y 3/8 10Y 9/2 10G 8/2 7.5G
6/4
2.5BG 3/20
5BG 4/6
Table 3. Chemical analysis of zeolitic pigments.
Sample SiO2 Al2O3 Fe2O3 TiO2 Na2O SO3 K2O CaO LOI
P10-RT 30.89 25.50 0.37 0.21 16.83 6.62 <0.1 <0.1 19.56
P20-RT 28.98 23.92 0.37 0.21 17.40 11.24 <0.1 <0.1 17.82
P30-RT 25.23 21.10 0.31 0.15 18.99 18.95 <0.1 <0.1 15.22
P40-RT 24.31 20.31 0.27 0.12 19.09 22.07 <0.1 <0.1 13.80
P50-RT 23.87 20.09 0.26 0.12 19.53 23.36 <0.1 <0.1 12.70
P10-OVE 30.70 25.32 0.41 0.18 16.88 6.66 <0.1 <0.1 19.61
P20-OVE 27.71 23.26 0.33 0.20 18.18 13.28 <0.1 <0.1 16.98
P30-OVE 25.60 21.60 0.30 0.16 19.06 18.00 <0.1 <0.1 15.18
P40-OVE 24.14 20.33 0.28 0.15 19.47 22.03 <0.1 <0.1 13.51
P50-OVE 23.43 19.95 0.30 0.16 19.75 23.50 <0.1 <0.1 12.81
existed, was almost imperceptible compared to the shades present in the P20, P30, and P40 -RT and -OVE products.
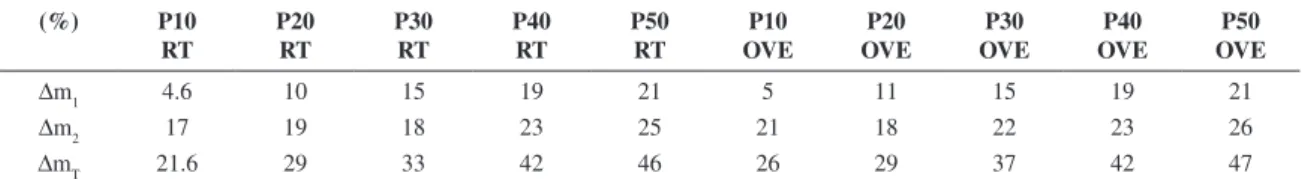
The loss of mass after calcination and washing is shown in Table 4. It was observed that the loss of mass increased with increasing quantities of additives, and the loss during calcination from the liberation of CO2 gas was caused by heating Na2CO320 and by the dehydration of the zeolite A
and sodalite4. The loss of mass during washing was due to
the leaching of sodium sulfate and the remaining soluble reagents.
The most significant factors in the formation of polysulfide are related to the following factors: reactional mixture, temperature and reaction time. The manipulation of such factors causes the melting of sulfur and consecutive homolytic dissociation reactions with further chromophores formation. For the yellow chromophores (S–
3), the homolytic
dissociation will induce the formation of blue chromophores (S62–) only if an appropriate reaction time is adopted,
otherwise it may cause partial formation of blue species, which will impart a green color to the material due to the mixture of the two chromophores17.
Since the equilibrium with ambient temperature was faster for AMB samples, the reaction was stopped quickly and therefore did not favor the formation of S–
3. This was
the reason why the blue color was not observed in these
samples. It is also possible that S–
3 chromophores have been
partly formed and that part of the S62– chromophores were
not dissociated, giving rise to the typical green color for these samples. On the other hand, for the MUF samples the cooling rate was lower, and therefore, the reaction conditions favor the formation of S–
3 chromophores.
4. Conclusion
This study indicated that it was possible to obtain ultramarine pigments from zeolite A derived from kaolin waste successfully, even with quantities of S/Na2CO3 below those generally reported in the literature. It is important to note that different quantities of the same additives in the same zeolite matrix cause an increase in color intensity and that the cooling rate after calcination causes a change in color, both of which are important in the production of pigments. This study will also be of benefit to those seeking another use for kaolin waste.
Acknowledgments
The authors are grateful to CNPq, National Council of Science and Technology Development – Brazil, Edital MCT/ CT-Mineral/VALE/CNPq Nº 12/2009 (550.297/2010-3) for financial support.
Table 4. Loss of mass during calcination and product washing.
(%) P10
RT
P20 RT
P30 RT
P40 RT
P50 RT
P10 OVE
P20 OVE
P30 OVE
P40 OVE
P50 OVE
∆m1 4.6 10 15 19 21 5 11 15 19 21
∆m2 17 19 18 23 25 21 18 22 23 26
∆mT 21.6 29 33 42 46 26 29 37 42 47
∆m1 (after calcinations), ∆m2 (after washing), ∆mT (total).
References
1. Brasil. Ministério de Minas e Energia. Departamento Nacional de Produção Mineral. Sumário Mineral. Brasília: Ministério de Minas e Energia; 2010. Availabre from: <http://www.dnpm. gov.br>. Acess in: 11/07/2011.
2. Carneiro BS, Angélica RS, Scheller T, De Castro EAS and Neves RF. Caracterização mineralógica e geoquímica e estudo das transformações de fase do caulim duro da região do Rio Capim, Pará. Cerâmica. 2003; 49:273-244. http://dx.doi. org/10.1590/S0366-69132003000400008
3. Barata MS and Angélica RS. Caracterização dos resíduos cauliníticos das indústrias de mineração de caulim da amazônia como matéria-prima para produção de pozolanas de alta reatividade. Cerâmica. 2012; 58:36-42. http://dx.doi. org/10.1590/S0366-69132012000100007
4. Maia AAB, Saldanha E, Angélica RS, Souza CAG and Neves RF. Utilização de rejeito de caulim da Amazônia na síntese da zeólita A. Cerâmica. 2007; 53:319-324. http://dx.doi. org/10.1590/S0366-69132007000300017
5. Maia AAB, Angélica RS and Neves RF. Estabilidade térmica da zeólita A sintetizada a partir de um rejeito de caulim da Amazônia. Cerâmica. 2008; 54:345-350. http://dx.doi. org/10.1590/S0366-69132008000300012
6. Paz SPA, Angélica RS and Neves RF. Síntese hidrotermal de sodalita básica a partir de um rejeito de caulim termicamente ativado. Química Nova. 2010; 33(3):579-583. http://dx.doi. org/10.1590/S0100-40422010000300017
7. Serry HS and Walton HF. The ion-exchange properties of zeolites. II- Ion exchange in the synthetic zeolite Linde 4-A. The Journal of Physical Chemistry. 1967; 67(5):1457-1465. http://dx.doi.org/10.1021/j100864a042
8. Borgstedt EVR, Sherry HS and Slobogin JP. Ion-exchange behavior of zeolite NaA and maximum aluminum zeolite NaP. Progress in Zeolite and Microporous Materials. 1997; 105:1659-1666. http://dx.doi.org/10.1016/S0167-2991(97)80813-0 9. Rakoczy RA and Traa Y. Nanocrystalline zeolite A: synthesis,
ion exchange and dealumination. Microporous and Mesoporous Materials. 2003; 60:69-78. http://dx.doi.org/10.1016/S1387-1811(03)00318-4
10. Ishikawa A, Sakurazawa Y, Shindo J, Shimada M, Ishimaru T, Ishikawa S et al. Phase separation in hydrated LTA zeolite. Microporous and Mesoporous Materials. 2005; 78:169-180. http://dx.doi.org/10.1016/j.micromeso.2004.10.006
B127:89-101. PMid:16076523. http://dx.doi.org/10.1016/j. jhazmat.2005.06.027
12. Jamil TS, Ibrahim HS, El-Maksound IHA and El-Wakeel ST. Application of zeolite prepared from Egyptian kaolin for removal of heavy metals: I. Optimum conditions. Desalination. 2010; 258:34-40. http://dx.doi.org/10.1016/j. desal.2010.03.052
13. Zhao Y, Zhang B, Zhang X, Wang J, Liu J and Chen R. Preparation of highly ordered cubic NaA zeolite from halloysite mineral for adsorption of ammonium ions. Journal of Hazardous Materials. 2010; 178:658-664. PMid:20172651. http://dx.doi. org/10.1016/j.jhazmat.2010.01.136 PMid:20172651. 14. Varela-Gondía FJ, Berenguer-Murcia A, Lozano-Castelló D
and Cazorla-Amorós D. Zeolite A/carbon membranes for H2 purification from a simulated gas reformer mixture. Journal of Membrane Science. 2011; 378:407-414. http://dx.doi. org/10.1016/j.memsci.2011.05.026
15. Kowalak S, Wróbel M, Gołębniak N, Jankowska A and Turkot B. Zeolite matrices for pigments. Studies in Surface Science and Catalysis. 1999; 125:753-760. http://dx.doi.org/10.1016/ S0167-2991(99)80283-3
16. Jankowska A and Kowalak S. Synthesis of ultramarine analogs from erionite. Microporous and Mesoporous Materials. 2008; 110:570-578. http://dx.doi.org/10.1016/j. micromeso.2007.07.007
17. Gobeltz N, Ledé B, Raulin K, Demortier A and Lelieur JP. Synthesis of yellow and green pigments of zeolite LTA structure: identification of their chromophores. Microporous and Mesoporous Materials. 2011; 141:214-221. http://dx.doi. org/10.1016/j.micromeso.2010.11.016
18. Gobeltz N, Demotier A, Lelieur JP and Duhayon C. Encapsulation of the chromophores into the sodalite structure during the synthesis of the blue ultramarine pigment. Faraday
Transactions. 1998; 94:2257-2260. http://dx.doi.org/10.1039/ a801526k
19. Arieli D, Vaughan DEW and Goldfarb D. New Synthesis and Insight into the Structure of Blue Ultramarine Pigments. Journal of the American Chemical Society. 2004; 126:5776-5788. PMid:15125670. http://dx.doi.org/10.1021/ja0320121 20. Gobeltz N, Demortier A and Lelieur JP. Identification of
the Products of the Reaction between Sulfur and Sodium Carbonate. Inorganic Chemistry. 1998; 37:136-138. http:// dx.doi.org/10.1021/ic970962f
21. Kowalak S, Jankowska A and Łączkowska S. Color modification of ultramarine analogs prepared from zeolites. Studies in Surface Science and Catalysis. 2004; 154:1633-1640. http://dx.doi.org/10.1016/S0167-2991(04)80688-8 22. Kowalak S, Jankowska A and Łączkowska S. Preparation of
various color ultramarine from zeolite A under environment-friendly conditions. Catalysis Today. 2004; 90:167-172. http://dx.doi.org/10.1016/j.cattod.2004.04.023http://dx.doi. org/10.1016/j.cattod.2004.04.023
23. Afanasiev P, Rawas L and Vrinat M. Synthesis of dispersed Mo sulfides in the reactive fluxes containing liquid sulfur and alkali metal carbonates. Materials Chemistry and Physics. 2002; 73: 295-300. http://dx.doi.org/10.1016/S0254-0584(01)00396-0
24. Kowalak S and Jankowska A. Application of zeolites as matrices for pigments. Microporous and Mesoporous Material. 2003; 61:213-222. http://dx.doi.org/10.1016/S1387-1811(03)00370-6