*e-mail: [email protected]
1. Introduction
The hydroreining process used to obtain low sulfur diesel presents some serious problems in the diesel properties, reducing other compounds that handle the lubricity, such as polyaromatics, nitrogen and oxygen1,2. This reduction in lubricity promotes a harmful effect on the injection system, which has led to the development of several standards to ensure acceptable levels of fuel lubricity. The addition of biodiesel in low sulfur diesel is important to restore the lubricating properties.
Lubricity is commonly evaluated by the wear scar diameter (WSD) measured in the x and y-axes, using a reciprocating sliding ball against a stationary lat disc of AISI 52100 steel immersed in a luid. Such evaluation is performed using the HFRR method (High Frequency Reciprocating Test Rig)3. The HFRR is a simple, rapid and cheap technique to
determine the lubricity of diesel and biodiesel fuels. Because of this it has become a widespread method, and it has been used by automotive and oil industries4.
High levels of lubricity imply in low wear scar, ensuring the formation of effective interfacial lubricant ilm that implies in the separation of contact surfaces5. The allowed
maximum values of WSD have been established by American and European standards as 520 µm (ASTM D 975) and 460 µm (EN 590) at 60 °C, respectively6.
Regarding the evaluation of various diesel and biodiesel fuels, including their volumetric mixtures using the HFRR
method, the literature is quite extensive. Knothe7 used this method to measure the lubricity of SME (soybean oil methyl ester) and ULSD (ultra-low sulfur diesel). The WSDs were 141 µm and 651 µm, respectively, showing that the lubricity of biodiesel fuel is higher than diesel. In addition, Moser et al.8 found that the addition of only 2% and 5% of
the SME in ULSD improved its lubricity, which decreased the WSDs from 551 µm to 212 µm and 171 µm, respectively. It was observed that lubricity is dependent on the sulfur and biodiesel contents. However, it is necessary to review other aspects too.
The work of Farias et al.9 determined the lubricity of
fuels (diesel, B5 and B20 blends of soybean and sunlower oil ethyl esters) and its correlation with wear surfaces in micro and nano scales using SEM, AFM and a rugosimeter. Based on their results, they concluded that the utilization of these techniques could complement the evaluation of lubricity as suggested by ASTM3.
Several researchers consider the analysis of vibration signals as an effective way to study friction and wear. Furthermore, friction generates vibration in various ways, but the vibration also inluences the friction, so both magnitudes are considered as being dependent on each other. According to Zhu et al.10, the signals of friction and vibration contain
much information that can relect the characteristics and behaviors of the tribological system. They were analyzed by several signal processing. The analysis in the frequency domain was used to enhance the information contained in
Correlation Between Fuel Lubricity and Vibration Signals
Obtained in Ball-disc Analysis Using Fourier Transform
Aline Cristina Mendes de Fariasa*, Alexandre Augusto Souza Medeirosa,
José Josemar de Oliveira Júniorb, Salete Martins Alvesa,b
aTribology and Dynamic Laboratory, Department of Mechanical Engineering,
Universidade Federal do Rio do Norte – UFRN, CEP 59072-970, Natal, RN, Brazil
bScience and Technology School, Universidade Federal do Rio do Norte – UFRN,
CEP 59072-970, Natal, RN, Brazil
Received: December 12, 2014; Revised: October 20, 2015
During the contact between metallic surfaces in mechanical systems, some dynamic characteristics present signiicant changes as the vibration signal patterns. The acquisition and characterization of these signals, by the use of Fourier Transform (FT), are non-intrusive tools in the evaluation of lubricity. This study aimed to evaluate dynamically the fuels lubricity (diesel S50, biodiesel and its blends) by the reciprocating sliding of a ball against a lat disc (AISI 52100 steel). After that, the vibration signals were evaluated by statistical test and FFT (Fast Fourier Transform) and STFT (Short-Time Fourier Transform) analyses and veriied their associations with parameters supplied by ASTM D6079. The results present a correlation between lubricity, frequency spectrum and the parameters of proiles from the worn disc surface. In addition, the evolution of wear scars presented an inluence of the biodiesel content in these fuels.
vibration signals, and it was applied in stationary signals to reveal the frequency components of the signal.
Souza11 analyzed time and frequency spectra of
vibration signals emitted by new and defective engines. In this evaluation, it was possible to deine a mechanical pattern to identify functional defects in the engines, since the frequency for defective was different from that emitted by new engines. Amarnath & Lee12 presented the results of
experimental wear and oil degradation assessments in spur gears under fatigue test conditions. They used the Fourier transform infrared radiation (FTIR) with vibration signal analysis and obtained a good understanding of tribological and vibration parameters by application of root mean square (RMS), crest factor and kurtosis parameters, which indicated the wear progression on gear tooth surfaces.
Based on those aspects, it is noted that it is very common the evaluation of vibration signals, using signal processing techniques, for monitoring of component failures. However, the literature does not report the utilization of these signals for analysis of fuel lubricity. In this case, the vibration analysis can be another method to improve the evaluation of lubricity.
In this sense, this work aimed to establish correlations between wear, friction and vibration signals obtained during ball on lat disc contact lubricated with fuels (diesel, biodiesel and B10 and B20 blends). The evaluation lubricity was made by the wear development using WSD and wear scar proiles and by the analysis of vibration in time domain and frequency spectra obtained with FFT and STFT.
2. Material and Methods
This research used LSD diesel (B0S50 until 50 ppm of sulfur) from ALESAT Combustíveis S.A., SME biodiesel (B100SB) and their B10SB and B20SB blends (prepared by the addition of 10% and 20% (vol.) biodiesel to diesel, respectively).
The AISI 52100 steel materials used to evaluate the lubricity of fuels are composed of the ball (ø = 6 mm, Ra = 0.05 µm and hardness HRC = 62) and a lat disc with a hardness HV30 = 190, which were assigned by INA
Bearings of Schaefler Group. The lat disc was machined to a dimension of 10 mm in diameter and a thickness of 3 mm. After, it was sanded and polished with abrasive alumina solution (ø 0.3 µm) with a inal roughness Ra of approximately 0.008 µm. The AISI 52100 steel chemical composition (Table 1) was determined by X-ray luorescence (EDX-720 Shimadzu).
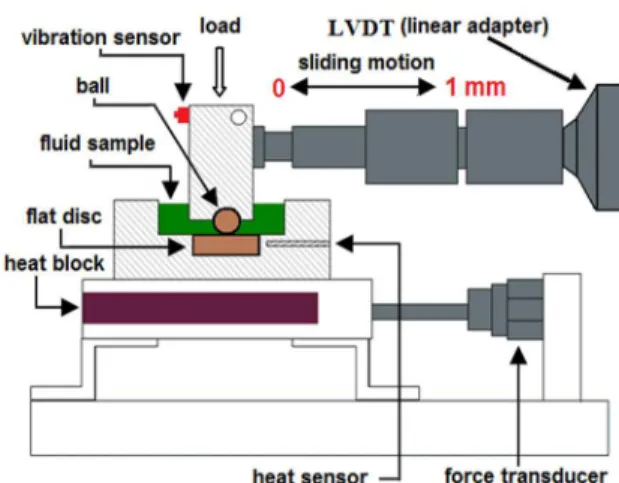
The tribological tests were carried out in triplicate using the HFRR (PCS Instruments) (Figure 1) equipped with a data acquisition board (National Instruments, model NI cDAQ-9172). The tests consisted of reciprocate sliding (1 mm to 10 Hz, 0.02 m/s) of the ball with a 10 N load on the lat disc, both immersed or not in 2 mL of fuel and heated at 60 °C. Table 2 shows the test conditions labelled by the N1, N2 and N3 parameters, which are related to the test time, cycle number and displacement distance.
During the experiment, the friction and vibration signals were acquired using the following sensors:
• Piezoelectric force transducer ixed under a disc holder to determine the friction coeficient;
• Uniaxial vibration sensor (Brüel & Kjaer 4518-001) at a sensitivity of 9.931 mV/g, set on the ball holder to measure the vibration in direction of sliding (X) axis, which was coupled to a vibrating module (NI9233).
The signals of friction coeficient were obtained by HFRPC software and were imported to Origin 8.0 software.
The vibration signal was acquired by LabView software and processed with Matlab R2012b. With this software were
analyzed some statistical parameters (mean, RMS, crest factor and kurtosis) in time domain and the spectrogram STFT and FFT (frequency domain) algorithms. These analyses were necessary to identify and extract speciic characteristics to correlate them with the fuel lubricity.
After the HFRR test, the WSD ball was measured by optical microscopy (magniication 100X) while the disc surface roughness proiles were obtained by a portable rugosimeter (Taylor Surtronic 25 Hobson).
3. Results and Discussion
3.1. Lubricity analysis: coeficient of friction and
wear scar
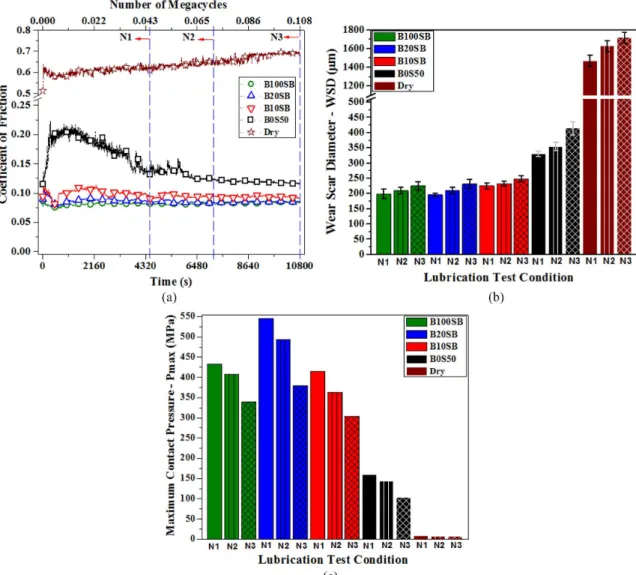
The coeficients of friction obtained during tribological tests with fuels mentioned above are shown in Figure 2a. Besides the wear scar diameter measured on the balls (Figure 2b) and the respective maximum Hertzian contact pressure (Figure 2c) calculated after the tests in N1, N2 and N3 conditions (Table 2).
Table 1. Chemical composition of AISI 52100 steel by XRF.
%Fe % Cr % Mn % Si % C % Al
96.87 1.36 0.38 0.33 0.99 (Bal.) 0.07
Figure 1. Schematic HFRR lubricity test. Table 2. Fixed parameters of HFRR lubricity test.
Parameter N1 N2 N3
Test time (second) 4500 7200 10800
It was observed in Figure 2a that coeficients of friction in the dry condition showed inverse behavior when compared to lubricated test with B0S50. In the dry test occurred the greatest impact between the asperities, consequently, the temperature rises in the contact. This can provide the oxide ilm formations, which rapidly disintegrate due to their fragile characteristics. This process generates wear particles due to the metal-to-metal contact and increases the coeficient of friction because of the plowing effect.
In the lubrication with B0S50, the maximum contact pressure had more inluence on the friction’s behavior, once maximum contact pressure (Figure 2c) decreased with an increase in the contact area (or WSD number, Figure 2b). The use of B100SB, B20SB and B10SB fuels showed few variations in the coeficient of friction (Figure 2a) whose values were very similar to each other, especially between B100SB and B20SB. Furthermore, the WSD increased as a function of N1, N2 and N3 conditions but its value was reduced with the increase in biodiesel content present in the blends. The maximum contact pressure presented an
inverse relationship with the WSD and cycle numbers. It was expected since this pressure is inversely proportional to the contact area. Hence, the increase in the biodiesel content inluenced the lubricity positively, providing scars and friction coeficients lower than those generated by B0S50. Therefore, it was considered that soybean oil biodiesel fuels (B100SB) and B10SB and B20SB had a greater ability to protect the metal surfaces than the B0S50 fuel.
Sukjit & Dearn13 attributed this ability to the high content
of oxygenated compounds and fatty acids present in biodiesel. They can promote the rapid rise in the contact region of the Fe3O4 ilm by absorption of their fatty acids, and this ilm is also considered a good lubricant. The low lubricity performance of B0S50 was mainly due to the desulfurization process, which promotes the removal of compounds to the inherent diesel self-lubrication1,2. However, the dry contact ball-disc condition was considered the most severe since the friction and wear values are approximately one order of magnitude higher than in the lubricated condition.
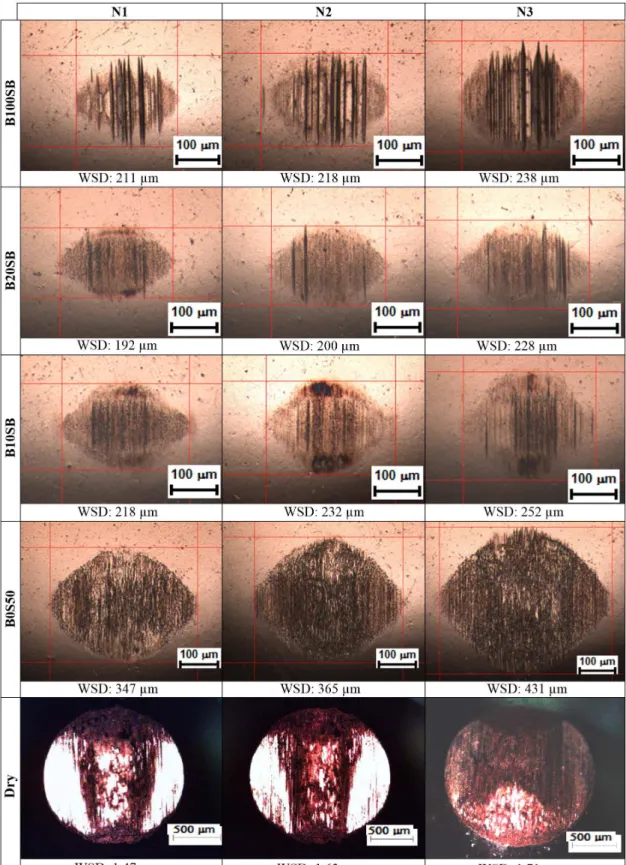
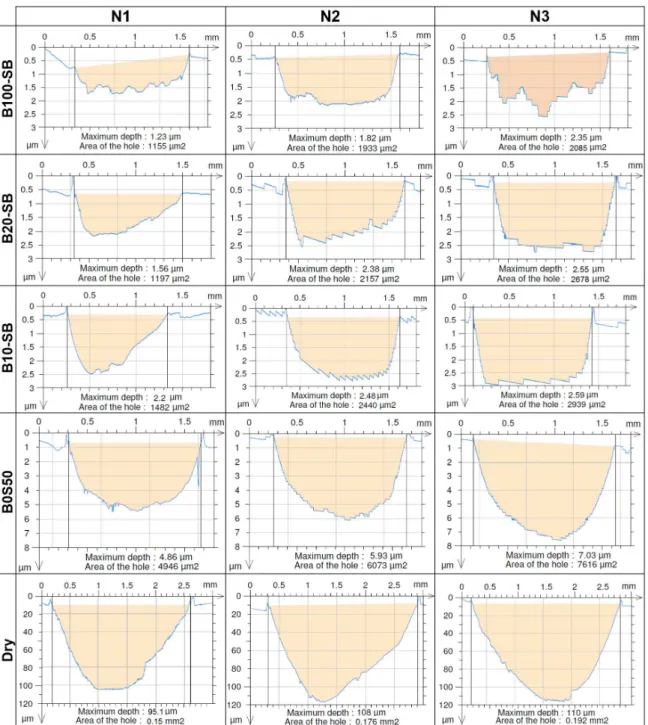
Analysis of ball wear scar images (Figure 3), and longitudinal proiles of disc wear scars (Figure 4) agreeing with the behavior of the coeficient of friction and WSD observed in Figure 2. According to Figure 3, the generated ball
scars had a typical morphology of abrasive wear mechanism. This mechanism improved the boundary lubrication process by the formation of grooves that to hold more luid in the contact region, decreasing friction and wear. It was also
veriied the presence of oxides on the ball scar, suggesting the occurrence of adhesive wear mechanism.
Figure 4 presents the maximum depth (µm) and the scar area (μm2) measured in the longitudinal direction of
the sliding, which increased in function of the reduced biodiesel content and with the time test. This characteristic was also mentioned in studies made by Sulek et al.14 and Farias et al.15, in which the coeficients of friction, the Ra
roughness parameters and scars proiles decreased with the use of biodiesel blends with high biodiesel content or pure biodiesel.
3.2. Vibration analysis in the time and frequency
domains
The analysis of physical system can be made from the temporal representation of vibration (m/s2). Since changes in
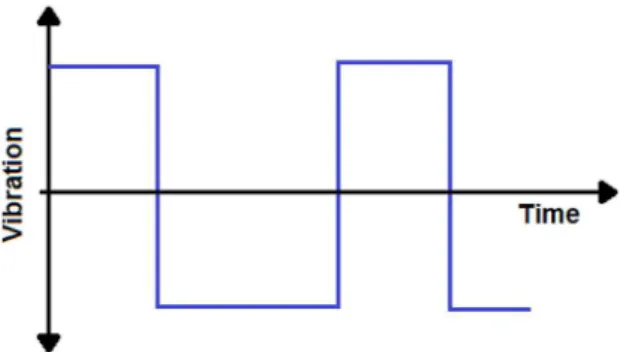
vibration amplitudes indicate that under friction, the system is not linear, or, in other words, there are changes in the frictional contact condition. According to Dautzenberg & Kals16, the shape of the theoretical vibration signal (Figure 5) is different from the experimental signal (Figure 6), which can be attributed to the different distribution of obstacles found on the contact surfaces.
Physically, the diagram in Figure 6b represents the period of one sliding stroke of 1 mm, with an initial increase in acceleration, which reaches the maximum value near of half stroke (0.5 mm); after, a deceleration occurs until reaching the end of stroke (1 mm). This process generates one vibration acceleration peak in the time domain. The same behavior is repeated in the return path to generate vibration trough. The region between peaks and troughs corresponds to the brake time, where the ball stop on the edge of the lat disc wear track.
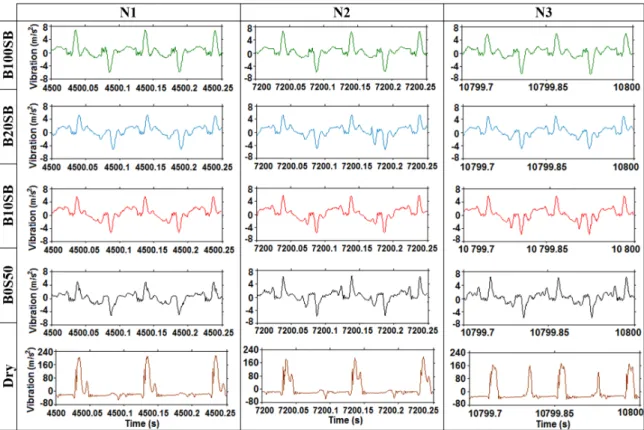
The vibration signal (m/s2) obtained during the experiment
were processed to generate graphs in time (Figure 7 and 8) and frequency (Figures 9 and 10) domains. Figure 7 shows the temporal vibration signal to each test condition (N1, N2 and N3) using a window of 0.25 s.
As illustrated in Figure 7, the temporal analysis showed that B100SB, B20SB and B10SB fuels condition present a visual vibration graphs very similar between them and a few different of the vibration standard obtained by B0S50 fuel condition. This conclusion corroborates with results of coeficient of friction obtained by these fuels. The fact
of B0S50 was more irregular can be related to different acceleration and deceleration rates, which were disturbed by the presence of large amount of grooves, depth and length scar, and the presence of surface ilm materials elements (Figure 3 and 4). For the dry (no lubrication) test, the shape of the peak and valley of vibration was the most irregular, and had the largest amplitudes, due to high friction present in this contact condition.
Chowdhury et al.17 studied the behavior of friction on medium carbon steel under horizontal vibration conditions. They attributed the increase in abrasive wear to groove penetration and the presence of plowing on the contact surfaces, which could have some effect on the rise of the coeficient of friction. The results revealed that the coeficient of friction and vibration amplitude are directly related and they increase in the horizontal direction. However, it is important to point out that the vibration may also be inluenced by grooves and scar depth because the real sliding on the wear tracks (Figure 3 and 4) is affected by presence of obstacles and depth.
The number of cycles (N1, N2 and N3) and the lubrication conditions affected the region known as brake time, Figure 7, where there is no sliding. A high instability was found in this region. This can be attributed to dificulty in keeping the ball at rest on the edge of the disc because of depths on disc wear scar. In the dry test, as expected, there was more severe wear and the formation of more irregular surface ilm, which further affected the stability in the brake time regions.
The visual analysis of time vibration signals is not suficient to evaluate the differences between each lubricant test condition. So, it was necessary to include some statistical parameters to add information about the behavior of vibration signals in time domain. Figure 8 presents graphs of mean, RMS, crest factor and kurtosis parameters for vibration signals calculated in windows of 0.25 s. This analysis aimed to investigate others features that were not observed in Figure 7.
Figure 5. Theoretical vibration signal in the time domain during the sliding.
Figure 7. Vibration signals in time domain as a function of lubricant and N1, N2 and N3 conditions.
The crest factor and kurtosis evaluations of the vibration shown in Figure 8 revealed that lubrication test condition with B0S50 tends to present greater variation between the N1 and N2 conditions. The mean and RMS analyses did not clearly establish differences for each lubrication condition. The crest factor and kurtosis analyses established differences and these results can be associated to the frictional behavior of each fuel (Figure 2a). The crest factor is the product between peak and RMS and it is associated with wear and friction evolutions. Kurtosis is a fourth statistical moment that provides a measure of vibrations peaks. Wear and friction evolution cause irregularities on surface discs and this promotes an increase in spikes in the vibration signature. In case of B0S50 lubrication condition, the changes in wear and friction levels contributed to a high increase of kurtosis values of N1 to N2 and N3 conditions.
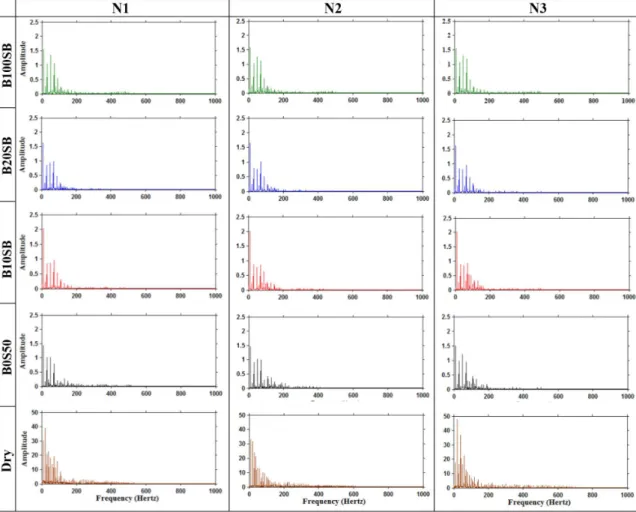
These statistical parameters provide complementary information about vibration analysis in time domain but they are not conclusive to explain the tribological variations in fuels studied. So, the vibration analyses considering the frequency domain obtained by the application of FFT and spectrogram analyses based in STFT are shown in Figure 9 and 10, respectively. Figure 9 presents the frequency spectra of the
vibration signals for each lubricant tests and N1, N2 and N3 conditions using a window of 2 s.
From the evaluation of spectra in Figure 9, it is clear that all conditions present a dominant frequency range from 1 to 200 Hz, i.e. frequency components with the highest amplitudes are localized between 1 and 200 Hz. There are some components in the high frequency band (for example until 600 Hz) that are much attenuated. This frequency band has peaks, which can be related to friction resulting from collisions between micro grooves and contact surfaces (Figures 3 and 4) and dependent on the lubrication conditions. The spectrograms generated by STFT for a windows of 10,800 s (test duration) are shown in Figure 10. From this analysis, it is not possible to afirm the presence of speciic bands for each lubricant. However, it is noted that there are signiicant differences for each lubricating condition. For example, B100SB and B10SB had a similar behavior between them with the highest frequency coeficients localized in range of 50-150 Hz and 400-600 Hz. This characteristic is not found for B20SB and B0S50 that also presented similar behavior between each other but the highest frequency are distributed in all range of 1-600 Hz. These variations can be related with topological changes in material surface.
Figure 10. Spectrograms of vibration signals of lubrication conditions, duration of test (10800 s).
4. Conclusions
From the analysis of the experimental results, it can be concluded:
(1) The B100SB, B20SB and B10SB fuels have a higher lubricity than B0S50. This could be proved by the formation of wear scar and the evaluation of
coeficients of friction. They are equivalent to each other and more stable than those generated by the use of B0S50 fuel.
it was affected by biodiesel content. This conirmed the low performance of B0S50.
(3) The analyses of vibration in time and frequency domains showed that there were a similar behavior in the fuels constituted by biodiesel, whose shape of vibration signature in time domain, the evaluation of statistical parameters and the amplitude of frequency components in the range of 1-200 Hz were almost the same. These can be correlated with the lubricity of these luids. However, the spectrogram presented a high similarity between B20SB and B0S50, with
the suggestion that this blend can have a dynamic behavior slightly closed with pure diesel.
Acknowledgements
The authors would like to acknowledge the inancial support from CAPES, CNPq and PPGEM/UFRN, INA Bearings of Schaeffler Group, ALESAT Combustíveis SA, to the technicians, engineers and professors from the laboratories (Tribology and Dynamics, NUPEG II, DEMAT, LCL and Chemistry lab of ECT) for the availability of the equipment.
References
1. Wei D and Spikes HA. The lubricity of diesel fuels. Wear.
1986; 235:111-217.
2. Nikanjam M, Henderson PT. Lubricity of low sulfur diesel fuels. Warrendale: Society of Automotive Engineers; 1993.
SAE Paper, No. 932740.
3. American Society for Testing and Materials – ASTM. ASTM D 6079: Standard test method for evaluating lubricity of diesel fuels by the high-frequency reciprocating rig (HFRR). West
Conshohocken: ASTM; 2005.
4. Knothe G. Evaluation of ball and disc wear scar data in the HFRR lubricity test. Lubrication Science. 2008; 20(1):35-45. http://dx.doi.org/10.1002/ls.51.
5. Farias ACM. Análise da lubricidade do biodiesel brasileiro de ésteres etílicos de soja e girassol. [Dissertation]. Natal:
Universidade Federal do Rio Grande do Norte; 2011. 6. Barbour RH, Rickeard DJ, Elliott NG. Understanding diesel
lubricity. Warrendale: SAE International; 2000. SAE Technical Paper. http://dx.doi.org/10.4271/2000-01-1918.
7. Knothe G. Biodiesel and the issue of diesel fuel lubricity. Lipid Technology. 2006; 18:105-109.
8. Moser BR, Cermak SC and Isbell TA. Evaluation of castor and lesquerella oil derivatives as additives in biodiesel and ultra low sulfur diesel fuel. Energy & Fuels. 2008; 22(2):1349-1352.
http://dx.doi.org/10.1021/ef700628r.
9. Farias ACM, Medeiros JTN and Alves SM. Micro and nanometric wear evaluation of metal discs used on determination of biodiesel fuel lubricity. Materials Research. 2014; 17:89-99. http://dx.doi. org/10.1590/S1516-14392014005000101.
10. Zhu H, Ge S, Cao X and Tang W. The changes of fractal dimensions of frictional signals in the running-in wear process.
Wear. 2007; 263(7-12):1502-1507. http://dx.doi.org/10.1016/j.
wear.2007.02.011.
11. Souza GF. Análise do funcionamento de motores Diesel utilizando wavelets. [Dissertation]. Campinas: Universidade Estadual de Campinas; 2011.
12. Amarnath M and Lee S-K. Assessment of surface contact fatigue failure in a spur geared system based on the tribological and vibration parameter analysis. Measurement. 2015; 76:32-44.
http://dx.doi.org/10.1016/j.measurement.2015.08.020.
13. Sukjit E and Dearn KD. Enhancing the lubricity of an environmentally friendly Swedish diesel fuel MK1. Wear.
2011; 271(9-10):1772-1777. http://dx.doi.org/10.1016/j. wear.2010.12.088.
14. Sulek MW, Kulczycki A and Malysa A. Assessment of lubricity of compositions of fuel oil with biocomponents derived from
rape-seed. Wear. 2010; 268(1-2):104-108. http://dx.doi.
org/10.1016/j.wear.2009.07.004.
15. Farias ACM, Mello VS, Medeiros DRS, Araújo ERV, Medeiros JTN and Alves SM. Avaliação desgaste de discos metálicos utilizados na determinação de lubricidade de combustíveis biodiesel. In: Anais do XX Congresso Brasileiro de Engenharia e Ciência dos Materiais; 2012; Joinville, Brasil. São Paulo:
Metallum Congressos Técnicos e Científicos; 2012. Available from: <http://www.metallum.com.br/20cbecimat/>. Access in: 28 Jun. 2014.
16. Dautzenberg JH and Kals JAG. A model for vibration during
dry sliding friction. Annals of the CIRP. 1986; 35(1):417-421.
http://dx.doi.org/10.1016/S0007-8506(07)61919-2.
17. Chowdhury MA, Helali MM and Toufique Hasan ABM. Hasan ABMT. The frictional behavior of mild steel under horizontal vibration. Tribology International. 2009; 42(6):946-950. http://