F
ACULDADE DE
E
NGENHARIA DA
U
NIVERSIDADE DO
P
ORTO
Data Models for Smart City IoT
Manuel João Gonçalves Vieira de Castro
Mestrado Integrado em Engenharia Informática e Computação
Supervisor: Professor Ana Aguiar (PhD)
© João Vieira de Castro, 2017
Data Models for Smart City IoT
Manuel João Gonçalves Vieira de Castro
Mestrado Integrado em Engenharia Informática e Computação
Aprovado em provas públicas pelo Júri:
Presidente: José Magalhães Cruz (Professor)
Vogal Externo: José Maria Fernandes (Professor)
Supervisor: Ana Aguiar (Professor)
____________________________________________________
Resumo
Numa era onde as sociedades caminham para soluções mais sustentáveis nas suas infra-estruturas, a Internet of Things está a capacitar o sector das smart cities, desempenhando um papel cada vez mais importante em áreas como a qualidade ambiental, o controlo do tráfego, a segurança e a saúde pública. A Ubiwhere encontra-se neste momento a desenvolver soluções de software no âmbito da plataforma de cidades inteligentes Citibrain, responsável pela recolha, processamento, armazenamento e distribuição de informação sensorial e serviços web ligados, na sua maioria, às áreas da mobilidade e qualidade ambiental. No entanto, devido à natureza diversa dos sensores e da informação recolhida, os dados obtidos estão, geralmente, em formatos diferentes, impondo grandes barreiras à interoperabilidade dos dados, dificultando as tarefas de integração de sistemas no desenvolvimento de software. Isto representa um grande problema para quem desenvolve aplicações, devido à grande quantidade de tempo e esforço envolvidos na adaptação das mesmas a estes formatos.
Esta tese propõe uma framework para comparar e classificar modelos de dados existentes para a Internet of Things. FIWARE, OGC SensorThings, oneIoTa, CitySDK, W3C Generic Sensor, OData, e IPSO Smart Objects são comparados com o objectivo de determinar a melhor alternativa para as soluções Citibrain. É feita uma caracterização dos modelos relativamente aos sectores das smart cities aos quais se aplicam e ao seu nível de abstracção. Este estudo preliminar é concluído com a seleção de modelos capazes de representar toda informação relativa às soluções Citibrain – FIWARE, SensorThings, Generic Sensor, oneIoTa e IPSO Smart Obejcts.
Numa fase seguinte, um conjunto de criterios é selecionado para uma avaliação mais profunda dos modelos de dados, usando métricas como os overheads introduzidos tanto no processamento dos dados como na comunicação do sistema, a quantidade e qualidade da documentação existente para cada modelo, assim como a facilidade de implementação. Para o cálculo destas métricas, é criado um tradutor semântico capaz de transformar os dados Citibrain em qualquer um dos modelos estudados em pormenor. Para concluir a análise, uma fórmula pesada é criada, capaz de traduzir a avaliação feita num único valor, para uma fácil comparação dos modelos. O método desenvolvido é então aplicado aos cinco modelos seleccionados, com o intuito de eleger a melhor solução para a Citibrain.
Aplicando os pesos que melhor expressam os requisitos da Citibrain, Fiware atingiu os melhores resultados e foi seleccionado para a implementação de uma aplicação dashboard com uma arquitectura cliente-servidor. Esta aplicação serve como uma prova de conceito do estudo efectuado e é responsável por mostrar ao seu utilizador informação real recolhida pelos sensores Citibrain.
Abstract
In a time where societies are committed to move towards more sustainable solutions in what concerns their infrastructures, the Internet of Things is empowering the smart city sector, playing an increasingly important role in areas such as environment quality, mobility, security and public health. Ubiwhere is currently partaking in the development of Citibrain, a smart cities platform, responsible for the gathering, processing, storage and distribution of sensorial information and web services related, in their majority, to the fields of mobility and environment quality. However, due to the diverse nature of the sensors and the collected information, the obtained data is conveyed in various formats, posing great barriers to data interoperability. This represents a problem for developers, due to the amount of time and effort needed to adapt applications to this heterogeneous data.
This thesis proposes a framework to compare and rank existing data models for the Internet of Things in the smart city sector. FIWARE, SensorThings, CitySDK, oneIoTa, OData, W3C Generic Sensor, and IPSO Smart Objects are compared to determine which one is the best fit for Citibrain’s solutions. A characterization of the data models is performed, regarding the smart city sectors they apply to, and their level of abstraction. This preliminary study is then concluded with the selection of the models capable of depicting all Citibrain’s solutions’ data – FIWARE, SensorThings, oneIoTa, W3C Generic Sensor and IPSO Smart Objects.
In the following stage, a set of criteria is selected for a deeper evaluation of the data models, making use of metrics such as the overheads introduced in both the data processing and communication aspects of the system, the amount and quality of available documentation and support, and the models’ easiness of implementation. For the calculation of the metrics covered by the framework, a semantic translator is created, capable of converting all Citibrain’s data into the studied data models. To conclude the analysis, a weighted formula is devised, capable of translating the performed evaluation into a single value, for an easier comparison of the models. The five selected models are then put through the developed evaluation process, in order to elect the de facto best solution for Citibrain.
Applying the weights that express Citibrain’s requirements, FIWARE achieved the best results in the analysis, and was selected for the database implementation of a client-server dashboard application. The dashboard served as a proof-of-concept, and is responsible for displaying real information gathered from Citibrain’s sensors.
Acknowledgements
This dissertation marks the culmination of my academic journey. As such, I would to like to thank all the people that somehow influenced me and fomented my personal growth through these last years.
Firstly to my supervisor, Professor Ana Aguiar, for the guidance and invaluable insights throughout this project. Secondly to my co-supervisor, Ricardo Vitorino, for the opportunity to develop this project, and all the expertise passed onto me. I would also like to say a big thank you to the whole Ubiwhere team, for making me feel at home, and specially to João Garcia and Pedro Diogo for the constant promptitude for helping me with the more technical aspects of the project. To all my friends, new and old, as well as my professors and classmates at FEUP, I express my gratitude for the companionship during these years.
Lastly, but most importantly, to my family, and, more specifically, to my parents and my sister for the support throughout the entirety of this journey, and for always being by my side.
“Free time is the enemy of progress.” Casey Neistat
Contents
Introduction ... 1
1.1 Context ... 1
1.2 Motivation and Goals ... 2
1.3 Contributions ... 3
1.4 Dissertation Structure ... 4
The IoT and Smart City Semantics ... 5
2.1 Data Interoperability in IoT Systems ... 5
2.2 The Semantic Web Approach ... 6
2.2.1 Linked Data ... 8
2.2.2 Ontologies ... 9
2.2.3 Empowering Ontologies with Linked Data ... 10
2.3 Data Model Evaluation ... 11
2.3.1 Definition of Criteria ... 11
2.3.2 Quantification of Qualitative Criteria... 14
2.4 Conclusions ... 15
Data Models: Exploring a Solution for Citibrain ... 17
3.1 Problem Overview... 17
3.2 Data Models and Sematic Interoperability ... 20
3.2.1 Requirements ... 20
3.2.1.1 Smart Air Quality 21 3.2.1.2 Smart Parking 22 3.2.1.3 Smart Traffic 23 3.2.1.4 Smart Waste 24 3.2.2 Methodology ... 25 3.2.3 Solution Architecture ... 26 3.2.3.1 Database 26 3.2.3.2 Semantic Translator 27 3.2.3.3 Entity Interaction 27 3.2.4 Proof-of-Concept Client ... 28
3.2.4.2 Smart Parking Management Interface 30 3.2.4.3 Smart Traffic Management Interface 31 3.2.4.4 Smart Waste Management Interface 31
3.2.5 Implementation... 33
3.2.6 Selection of Data Model Evaluation Criteria ... 33
Data Models for the IoT... 35
4.1 CitySDK ... 36
4.2 FIWARE ... 36
4.3 W3C Generic Sensor ... 37
4.4 IPSO Smart Objects ... 38
4.5 OData ... 41
4.6 oneIoTa ... 41
4.7 OGC SensorThings ... 42
4.8 Conclusions ... 43
Criteria for Data Model Evaluation ... 46
5.1 Formulation of Evaluation Criteria ... 46
5.1.1 Qualitative Evaluation ... 46
5.1.2 Quantitative Evaluation ... 48
5.2 Quantification of Evaluation Criteria ... 48
5.2.1 Quantitative Metrics ... 49
5.2.2 Qualitative Metrics ... 49
5.2.3 Data Model Overall Quality ... 51
5.3 Final Considerations on the Evaluation... 54
Data Models: A Deeper Analysis ... 56
6.1 FIWARE Data Model... 57
6.1.1 Qualitative Analysis ... 58
6.1.2 Quantitative Analysis ... 59
6.1.3 Other Considerations ... 60
6.2 Generic Sensor Data Model ... 61
6.2.1 Qualitative Analysis ... 62
6.2.2 Quantitative Analysis ... 63
6.3 IPSO Smart Objects Data Model... 64
6.3.1 Qualitative Analysis ... 65
6.3.2 Quantitative Analysis ... 66
6.4 oneIoTa Data Model... 67
6.4.1 Qualitative Analysis ... 68
6.4.2 Quantitative Analysis ... 70
6.5.1 Qualitative Analysis ... 71
6.5.2 Quantitative Analysis ... 73
6.6 Conclusions ... 74
Conclusions and Future Work ... 78
7.1 Goal Achievement ... 78
7.2 Contributions ... 79
7.3 Analysis Limitations ... 79
7.4 Future Work ... 80
References ... 81
Data Model Evaluation Measurements ... 84
List of Figures
Figure 1: Citibrain’s vertical solutions [3] 2 Figure 2: Data Models and IoT Middleware [6] 3 Figure 3: The four challenges of data interoperability [9] 6 Figure 4: Evolution of the market size from the Internet of Things to the Semantic
Web of Things [11] 7
Figure 5: Citibrain's generalized entity architecture 20 Figure 6: Citibrain's Smart Air Quality solution's entity architecture 22 Figure 7: Citibrain's Smart Parking solution architecture 23 Figure 8: Citibrain's Smart Traffic solution architecture 23 Figure 9: Citibrain's Smart Waste solution architecture 24 Figure 10: Solution's Architecture 26 Figure 11: Entity Interaction for Data Conversion 27 Figure 12: Entity Interaction for Data Retrieval 28 Figure 13: Solution's main interface 29 Figure 14: Dashboard's Air Quality Management Interface 30 Figure 15: Dashboard's Parking Management Interface 30 Figure 16: Dashboard's Traffic Management Interface 31 Figure 17: Dashboard's Waste Management Interface 32 Figure 18: Dashboard's Waste Container Interface 32 Figure 19: Generic Sensor Architecture 37 Figure 20: IPSO/LWM2M's Object Model Architecture 40 Figure 21: SensorThings Sensing Profile Core Entities [29] 43 Figure 22: Fiware's implemented core entities 57 Figure 23: Generic Sensor Implemented Core Entities 61 Figure 24: IPSO Smart Objects’ Implemented Core Entities 65 Figure 25: oneIoTa Implemented Core Entities 68 Figure 26: Comparison of Data Models Implementation Times 75
List of Tables
Table 1: Information potentially retrieved from cities [4] 18 Table 2: Data Model Entity Mapping 44 Table 3: Comparison of the data models’ abstraction level 45 Table 4: Data Model Evaluation Framework Metrics and Quantification 53 Table 5: Data Model Suitability Evaluation 77
Abbreviations
CoAP Constrained Application Protocol CRUD Create, Read, Update and Delete HTTP Hypertext Transfer Protocol
ICT Information and Communication Technology IoT Internet of Things
IDE Integrated Development Environment IPv6 Internet Protocol version 6
JSON JavaScript Object Notation
LOD Linked Open Data
LOV Linked Open Vocabularies LWM2M Lightweight Machine-to-Machine OMA Open Mobile Alliance
OWL Web Ontology Language POI Points of Interest
RAML Restful API Modeling Language RDF Resource Description Framework REST Representation State Transfer SWoT Semantic Web of Things URI Universal Resource Identifier
WoT Web of Things
Chapter 1
Introduction
2
Created in the beginning of the 21st century, the concept of smart city, “a city in which
information and communication technologies (ICT) is merged with traditional infrastructures, 4
coordinated and integrated using new digital technologies” [1], has been in constant refinement. With recent improvements in ICT, resulting in ubiquitous Internet access and lower prices in 6
mobile devices and sensors, the Internet of Things (IoT) became an ever-increasing market, tightly linked with the empowerment of the smart city sector [2].
8
However, due to the vastness and heterogeneous nature of the data obtained from the many activities taking place in a city, creating smart city solutions can be a rather complex process. 10
Combining the diverse nature of the data with the diversity of data providers, developers who constantly need to adapt their solutions in order to be compliant with both these formats and the 12
ever increasing number of protocols, standards and middleware platforms, face challenges of great magnitude.
14
This work focuses on the study of data models for the IoT as a solution for the standardization of the information provided by different sensors measuring data of different 16
nature. Such standardization serves as a means to achieve the much needed data interoperability among smart city IoT platforms.
18
1.1 Context
This dissertation is conducted in partnership with Ubiwhere1, a Portuguese software
20
company based in Aveiro, Portugal. Ubiwhere’s business activity focuses on four main sectors, (i) Telecommunications and Future Internet, (ii) Sustainable and Efficient Resource Management, 22
Introduction
(iii) Transports, Travel and Tourism, and (iv) Knowledge, Collaboration and Education. More specifically, this project falls under the umbrella of Citibrain, a commercial joint venture 2
composed of Ubiwhere and two other Portuguese information and technology (IT) companies: Micro I/O2, and Wavecom3. Citibrain provides Internet of Things solutions that use the same stack
4
and technological architecture (from now on referred to as vertical solutions) in the domains of mobility and environment quality, with the purpose of converging as a platform for smart cities. 6
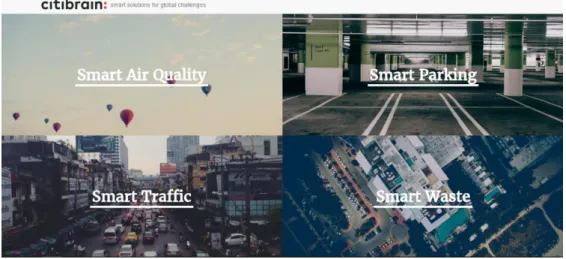
Smart Air Quality Management, Smart Waste Management, Smart Parking Management and Smart Traffic Management are the four vertical solutions currently offered by Citibrain, which 8
will be described in detail in subsequent chapters. 10
Figure 1: Citibrain’s vertical solutions [3] 12
1.2 Motivation and Goals
The motivation behind this study arises from the data heterogeneity problem present across 14
current IoT systems. Due to the diversity of the sensed information and the diverse formats it is conveyed in, coupled with the vastness of existing standards and protocols, there are great efforts 16
and time spent by the developers in order to manually adapt their applications to these incongruous formats and to ensure compatibility across systems [4]. Thus, to contribute to 18
overpass this situation represents a meaningful challenge.
2 www.microio.pt 3 www.wavecom.pt
Introduction
3
One solution for the mentioned problem is the standardization of the way different systems describe knowledge about the domains they focus their activity in. This dimension of 2
interoperability can be achieved with the use of data models - information structures whose main goal is to organize data elements and standardize the way they relate to their properties and with 4
each other.
When applied to the area of the IoT, data models allow many-to-many interactions between 6
applications and things (devices), provide standard interfaces for things and software, and also structure data to enable reasoning approaches to deduce new knowledge [5].
8
10
Figure 2: Data Models and IoT Middleware [6] 12
With this motivation in mind, this project will consist of a study of data models for the IoT as a means to achieve semantic interoperability – the ability of systems to communicate and 14
exchange data with unambiguous, shared meaning [7]. The bulk of the work will consist in (i) a research of currently available data models for smart city IoT, (ii) the identification and selection 16
of valid criteria for the evaluation of said models, and (iii) the definition of a formula capable of translating all these metrics into a single value, providing an effective methodology for the 18
quantification of a data model’s suitability for an IoT platform. This knowledge will then be used for the evaluation of the discovered data models, with the aim of finding the one that best suits 20
Citibrain’s platform.
1.3 Contributions
22
The main contributions of this dissertation include: (i) a description and characterization of a set of data models, (ii) the definition of valid criteria for the evaluation of data models, (iii) the 24
Introduction
solutions, based on the chosen criteria in the previous point, and (iv) the development of a dashboard application to validate the study, using the most suitable data model for the server 2
communication.
1.4 Dissertation Structure
4
The current report, after this Introduction, includes a Chapter 2, consisting of an analysis of the state of the art of data interoperability in smart cities, detailing (i) the different challenges of 6
data interoperability in IoT systems, (iii) the semantic web approach to data interoperability, and (iii) the process of evaluating data models, including a study on the quantification of qualitative 8
criteria.
Chapter 3 contains a deeper explanation of the problem and its solution, detailing Citibrain’s 10
solutions’ architecture and requirements definition, the methodology used throughout the development of the project, the solution’s architecture, a description of the developed proof-of-12
concept client, and the identification of the data model evaluation phases.
In Chapter 4 a description of the seven discovered data models for smart city IoT is 14
presented, namely FIWARE, OCG SensorThings, CitySDK, OData, W3C Generic Sensors, oneIoTa and IPSO Smart Objects, culminating in the selection of five models for a further study. 16
Chapter 5 presents a description of the developed data model comparison framework, composed of the selection of data model evaluation metrics, the creation of a formula, translating 18
the criteria into a value, as well as some considerations regarding the devised framework. Chapter 6 contains an in-depth analysis of the five selected data models in the study made 20
in chapter 4, with the purpose of calculating a data model’s suitability for Citibrain’s vertical solutions. Both a qualitative and a quantitative analysis of the data models are performed, and the 22
chapter is concluded by the selection of a data model to be used by Citibrain, and in the development dashboard application that serves as a proof-of-concept of the performed study. 24
Finally, Chapter 7 contains the conclusions of the dissertation, including some closing remarks on the achievement of the proposed goals, the main contributions of this thesis, the 26
Chapter 2
The IoT and Smart City Semantics
2
This chapter reviews previous work in the field of the IoT, related to its smart city sector and quality evaluation of data models.
4
In a first step, a study in the field of data interoperability is performed, including a description of its four main challenges, as well as the added value purveyed by semantic 6
interoperability. Then, a brief description of the semantic web is carried out, mentioning the importance of two of its technologies, namely Linked Data and Ontologies, and how they apply 8
to the IoT. Finally, an analysis of data model evaluation techniques is carried out, collecting metrics of already defined evaluation frameworks, and also addressing the issue of quantification 10
methods of qualitative criteria
2.1 Data Interoperability in IoT Systems
12
In their 2015 paper, Serrano et al. [8] identify four main challenges regarding data interoperability in IoT systems:
14
Technical Interoperability – concerning heterogeneous software and hardware, such as communication protocols;
16
Syntactical Interoperability – concerning both different data formats and different software for the development of ontologies and semantic datasets;
18
Semantic Interoperability – concerning ontology heterogeneity, differences in terms used to describe data, as well as the meaning of the exchanged data according to the 20
The IoT and Smart City Semantics
Organizational Interoperability – concerning heterogeneity of different infrastructures.
2
Figure 3: The four challenges of data interoperability [9] 4
According to Consoli et al. [10], the “large, heterogeneous data sources in smart cities make 6
the problem even harder, as different semantic perspectives must be addressed in order to cope with knowledge source conceptualizations”. In the same paper, answers to these challenges are 8
pointed out, through the employment of semantic web standards and practices. The authors consider that syntactical interoperability, which regards the used data formats, can be achieved 10
by the adoption of universal knowledge representation languages, such as Resource Description Frameworks (RDF), Web Ontology Languages (OWL) or Linked Open Data (LOD). Besides, it 12
is proposed that semantic interoperability, which regards the meaning of the exchanged data and the different terms used to describe it, may be achieved through the use of a uniform data 14
representation, as well as the formalization of all the concepts into a holistic data model.
2.2 The Semantic Web Approach
16
In recent years, the Internet of Things or, more precisely, its connectivity service - the Web of Things, started integrating semantic web technologies [11]. The Semantic Web, an extension 18
of the Web through standards provided by the World Wide Web Consortium aims at, according to Berners-Lee et al [7], providing structure and meaning to the web pages’ content, thus creating 20
an “environment where software agents roaming from page to page can readily carry out sophisticated tasks for users”. In the same paper, the authors describe the Semantic Web as an 22
extension of the current Web, where information and data can be processed automatically, with the contents also being destined to be read and comprehended by machines, instead of being only 24
human-readable as is the case with the current Web. By adding logic to the Web, and giving computers access to structured collections of data and sets of inferences rules, computers become 26
The IoT and Smart City Semantics
7
answer questions, making use of technologies such as universal knowledge representation languages.
2
By merging the notions of Semantic Web and the Web of Things, a new concept was formed, the Semantic Web of Things (SWoT). The SWoT envisions the integration into the physical world 4
of information which is simultaneously rich in semantic terms, and easily accessible; it also aims at connecting smart objects and digital entities. According to Jara et al.[11], the SWoT’s purpose 6
is the enablement of “knowledge-based systems to achieve high degrees of autonomous capability for information storage, management, and discovery, therefore providing transparent access to 8
information sources”, in a reality dominated by constrained devices, with low memory capacity, little processing capabilities and low throughput wireless links [7].
10
12
Figure 4: Evolution of the market size from the Internet of Things to the Semantic Web of Things [11]
14
Jara et al. [11] identified the three main interoperability challenges to be solved in order to 16
complete the transition from the IoT to the SWoT: Heterogeneous device integration; 18
Device abstraction;
Syntactic and semantic interoperability. 20
In the same paper, the authors also address possible solutions for the challenges. For the 22
support of heterogeneous devices, the IoT containsa common addressing space (such as IPv6, gateways or middleware), which allows the connection of all types of smart devices and things to 24
The IoT and Smart City Semantics
By using web technologies, such as RESTful architecture, that define a communication layer where the resources are identified by a Universal Resource Identifier (URI), device abstraction 2
can be attained. These URIs, besides providing abstraction, according to Jara et al. [11], are also able to “define semantic descriptions following structures such as Web Linking”.
4
Regarding syntactic and semantic interoperability, two semantic web technologies have been playing an important role in the SWoT: Linked Data and Ontologies, which will be described in 6
the next subsections.
2.2.1 Linked Data
8According to Berners-Lee [7], for the Semantic Web to properly function, “computers must have access to structured collections of information and sets of inference rules that they can use 10
to conduct automated reasoning”. Linked data consists of, according to Bizer et al. [12], a “set of best practices for publishing and connecting structured data on the Web”. In the same paper, the 12
authors also note that while, traditionally, data published on the web consists of dumps of raw data in formats such as CSV, XML or HTML tables, sacrificing a great part of its structure and 14
semantics, there has been a progression of the Web into a new space. This new version of the web can be defined as a space where not only the documents are connected through hyperlinks, but 16
also as a space where the information, concepts and definitions contained in them are also linked, becoming sharable, extensible and easily re-usable.
18
The concept of Linked Data saw its inception in 2006, when Tim Berners-Lee published a set of four rules for “publishing data on the web, in a way that all published data becomes part of 20
a single, global, data space” [12][13]:
1. Use URIs as names for things; 22
2. Use HTTP URIs so that people can look up those names;
3. When someone looks up a URI, provide useful information, using the standards (RDF, 24
SPARQL);
4. Include links to other URIs so that they can discover more things. 26
These basic rules were named Linked Data Principles, and provide means for data 28
publication on the Web and to connect it between different data sources, allowing the linkage of data in different sources, with the employment of RDF and the Hypertext Transfer Protocol 30
(HTTP) [14]. Linked Data is becoming an increasingly important part of the current smart city solutions, due to its interoperable nature and means of data representation. Consoli et al. [10], in 32
the case of Catania, were able to develop a single Linked Open Data model, containing all the city’s information, regarding its roads and urban transportation, public lighting maintenance 34
The IoT and Smart City Semantics
9
waste management and urban fault reporting, by converting this heterogeneous information into RDF, using mainly TABELS and Java scripts. The model was later complemented with a common 2
ontology, developed in OWL, which described the city’s business processes. The result was a semantic model that allowed the use of data extracted from different sources and unified under a 4
shared semantic model, creating a platform for developing applications based on geo-location, real-time road traffic analysis and public transport management.
6
2.2.2 Ontologies
According to the World Wide Web Consortium, regarding the Semantic Web, vocabularies 8
and their more complex formal counterpart, ontologies, “define concepts and relationships used to describe and represent an area of concern” [15].
10
The main roles of a vocabulary on the Semantic Web are, on one hand, to promote data integration, by resolving ambiguities on the terms of different data sets, and on the other hand, 12
when new knowledge enables the discovery of new relationships [14].
Chandrasekaran et al [16] identify two major ontology classes regarding Knowledge Base 14
Systems:
Ontology as vocabulary, characterizing vocabularies as providing “a set of terms with 16
which to describe the facts in some domain, while the body of knowledge using that vocabulary is a collection of facts about a domain”;
18
Ontology as content theory, characterizing ontologies as content theories, given their contributions to a domain – identifying the sorts of objects, their properties, as well as 20
the relations between them. 22
In the same paper, the authors classify ontological analysis as a method for the clarification of the structure of knowledge. Within a domain, its ontology provides the central part of the 24
information defined by it, and, without ontologies or the existence of the concepts defined by them, the existence of a vocabulary capable of representing the domain’s knowledge is an 26
unviable task.
According to Gyrard et al. [8], the rise of popularity of the ontologies is due to its capacity 28
of easing the interoperability among applications, services, software and platforms and for describing domain knowledge. The authors identify the main benefits of using ontologies as (i) 30
exchanging data between systems, (ii) providing interoperability among systems, (iii) designing and sharing knowledge, and (iv) simplifying operations.
32
The British Standards Institution developed a smart city concept model [17], able to describe all the entities, actors, occurrences and observations of a city through the use of ontologies. The 34
The IoT and Smart City Semantics
resulting model is able to provide complete syntactical interoperability among the sectors of a city, leaving doors open for the goal of semantic interoperability.
2
Gyrard et al. [18] proposed LOV4IoT, a dataset comprising circa 300 projects based on ontologies, referencing and classifying metrics such as (i) their applicative domains, (ii) the used 4
sensors, (iii) the status and the information on the used ontologies, (iv) the reasoning that allows high level abstraction deductions, and (v) papers associated with the project [19]. Besides the 6
classification of ontologies, the aim of the dataset was to promote the reuse of concepts in the development of new ones, with the final goal of attaining interoperability both among city sectors 8
and among cities. The authors also proposed the Machine-to-Machine Measurement (M3) Framework, responsible for the generation of IoT application templates, based on the users’ 10
employed sensors and domains, and based on the ontologies present in LoV4IoT.
2.2.3 Empowering Ontologies with Linked Data
12While ontologies are able to both provide terms to describe the facts in some domains and characterize their objects, properties, and relationships [16], there is still a lack of consistency 14
between different domains. While the reuse of ontologies, as proved by Gyrard et al. [18], may ease the interoperability of information between systems, such interoperability is achieved by the 16
reuse of already existing ontologies and vocabularies. A wider level of data interoperability may be achieved with the employment of the Linked Data principles, through a process called 18
Ontology Alignment, which consists in the creation of relations between entities of different
ontologies [20]. With the establishment of such consistency among ontologies in different 20
domains, a new level of data interoperability is created, which can be achieved without sacrificing a system’s identity and already defined and implemented concepts and relations.
22
Parundekar et al.[20] devised an alignment algorithm for ontologies, which uses data analysis and statistical techniques for class-matching among different ontologies. Besides data 24
consistency among systems, the developed algorithm was also able to generate new, more refined ontologies for sources defined with simple ontologies, through the alignment of said systems with 26
systems with more complex ontologies. The authors’ algorithm was then tested in Liked Data sources from geospatial, genetics and zoology domains. The methodology was applied to five 28
pairs of data sources, constructed with six different ontologies: (i) DBpedia, (ii) LinkedGeoData, (iii) Geospecies, (iv) Bio2RDF ‘s MGI, (v) Bio2RDF ‘s GeneID, and (vi) Geonames. The 30
algorithm was able to discover circa 800 equivalences and 29000 subset relationships among the five pairs of source domains.
The IoT and Smart City Semantics
11
2.3 Data Model Evaluation
Over the years, the process of evaluating data models has been quite difficult to define and 2
characterize. According to Maier [21], since data modeling has a varying nature, no actual general concept can be given for the evaluation of data models. According to Moody et al. [22], one of 4
the biggest problems presented in the design of data modeling solutions is the substantial alternative designs that can be developed for a given problem. Hence, the process of data 6
modeling should not be seen as a deterministic search process for the “correct data model”, but as a “process of searching for alternative solutions. In order to get the best result, it is important 8
to explore alternative models rather than simply adopting the first and most obvious solution.” Maier [21] defended that the evaluation of data modeling needs to be focused on criteria reflecting 10
the quality of the modeling process and take into account different application scenarios of said modeling within an organization.
12
2.3.1 Definition of Criteria
William C. McGee [23], in his 1976 paper, devised a method for measuring a data model’s 14
quality, comprised of two main phases, firstly the identification of a set of model evaluation criteria (consisting in desirable attributes of a model), and secondly, the assignment of individual 16
values to each item of the aforementioned criteria. Combining the weighted individual values of each criterion, one could easily calculate the model’s suitability for a given data representation 18
problem.
Accompanying this methodology, McGee defined twelve evaluation measurements, 20
dividing them into two main groups: use criteria, measuring the model’s ease of use, and
implementation criteria¸ measuring the ease of the model’s implementability as well as the
22
efficiency of the resulting implementation.
Regarding use criteria, the following metrics were defined: 24
Simplicity: A simple data model is described as having the “smallest possible number of structure types, composition rules and attributes”;
26
Elegance: A model is considered elegant if is capable of achieving a direct modeling capability with the least possible number of structures types, composition rules, and 28
attributes;
Picturability: All the structures defined in the data model should be able to be displayed 30
in a graphic format;
Modeling directness: The entities and relations presented in the model should have the 32
The IoT and Smart City Semantics
Modeling uniqueness: A model “should not provide equivalent direct modeling techniques”, i.e., ideally, a model should provide only one way of modeling a certain 2
situation that can be formulated with the terms defined in its knowledge base, in order to attain maximum performance;
4
Provision of schemas: A model should contain structure schemas which allow data definition;
6
Implementation independence: Data models usually contain convenient features for the implementers that are not necessary for the information modeling itself. Since these 8
usually result in program dependence on them, they should be avoided;
Overlap with co-resident models: A model should merge smoothly with other already-10
existing models;
Partitionability: A model should contain structures that simplify the processes of 12
partitioning data;
Non-conflicting terminology: The terminology used by a data model should never 14
conflict with already established terminology; 16
Regarding implementation criteria, two metrics were defined:
Proximity to the base model: considered by the author as one of the most important 18
model attribute from both an implementation and performance standpoint, a model should never be far from its implementation base, since whenever “structures of the 20
model have exact counterparts in the base, it is unnecessary to develop procedures for transforming model structures into base structures and vice versa”;
22
Applicability of safe implementation techniques: A model should allow the use of already proved and well-understood implementation techniques.
24
Moody et al. [22], devised a comparison framework composed of five main constructs: 26
Qualities: Defined as desirable properties or dimensions of value in data models, with the goal of the evaluation process being the maximization of the model regarding such 28
properties;
Stakeholders: The authors consider the contemplation of the unique needs of the 30
different stakeholders who interact with the data models highly important. Therefore, in order to correctly classify a data model, one needs to have in mind the perspectives of 32
The IoT and Smart City Semantics
13
owners and customers, as well as the data analyst’s, the application users’, and the data administrators’;
2
Metrics: The authors define “consistent and objective” ways of classifying the quality of a data model. While there is the possibility that several different measures exist for 4
the same quality, an overall measurement may be attained, through the combination of the ratings for all the metric relating to it;
6
Weighting: Another important construct defined by the authors, is the attribution of weights to each of the model’s qualities, representing said quality’s importance on the 8
scope of the project;
Strategies: Finally, the authors conceptualize strategies for the improvement of the data 10
model. Instead of focusing solely on the model’s qualities and flaws, one should also focus on defining methods for improving the models.
12
In the same paper, to complement the aforementioned framework, the authors provide a set 14
of qualities to have in mind for the evaluation of the data models:
Simplicity: Regarding the aspects of size and complexity of the data model, namely the 16
number of contracts required, the authors note that, as a general rule, the simpler models are usually the best ones, since they provide more flexibility, easier implementations, 18
and are easier to understand. According to the authors, “One of the major goals of data modeling should be to search for simpler and more powerful ways of representing the 20
data, rather than just documenting user requirements”. Proposed metrics for this quality are the measurement of the data model complexity, measured by the number of entities 22
plus the number of relationships in the data model;
Completeness: Regarding the ability of the data model to “meet all user information 24
and functional requirements”, complete and correct requirements information is considered to be a crucial prerequisite for a successful development of information 26
systems. Proposed metrics for this quality consist of ratings given by user and industry specialists, process mapping and package comparison;
28
Flexibility: To be considered flexible, a data model should be easily adaptable to changes in the requirements. This quality is rather important since the “ability of a 30
system to adapt to changes in its environment is widely considered as one of its most important characteristics”. Metrics for the evaluation of this quality include senior 32
The IoT and Smart City Semantics
Integration: To be defined as easily integrable, there needs to be a consistency of the information defined in the data model with the rest of the organization’s data. Metrics 2
for this quality consistent in a characterization of corporate data model conflicts; Understandability: this concept can be characterized as the “ease with which the 4
concepts and structures in the data model can be understood by the users of the model”. Evaluation metrics for this characteristic consist in ratings provided by users, data 6
administrators, and application developers;
Implementability: The implementability aspect of a data model can be defined as the 8
ease with which the data model can be implemented, regarding aspects as time, budget, resource and technology constraints of the project.
10
2.3.2 Quantification of Qualitative Criteria
One of the most widely used methods of quantification of qualitative measurements is the 12
employment of a Likert Scale. This psychometric tool was first devised in 1932 by psychologist Rensis Likert as a means to “measure ‘attitude’ in a scientifically and validated manner” [24], 14
where attitude can be defined as a preferential way of “behaving/reacting in a specific circumstance rooted in a relatively enduring organization of belief and ideas” [24].
16
The Likert scale consists of a series of four or more questions (Likert items), each having a set of possible responses (originally five options), usually ranging from strong approval to strong 18
disapproval of the concept. These responses are then combined in order to create an attitudinal measurement scale [25], objectively reflecting the test subject’s opinion on a certain phenomenon. 20
Although five is the most common number of answers provided for a Likert item, some variations are also widely used. One example of said variations is the adoption of an even 22
(asymmetric) scale, in order to remove the neutral answer (middle of the scale). This variation is often used when the researcher wishes to avoid the central tendency bias, a phenomenon that 24
occurs when the survey participants wish to avoid expressing an opinion or because of respondent
fatigue (which occurs when survey participants become tired of the survey task) [26]. Another
26
frequent variant of the five point scale is the use of a seven or nine point scale. These types of scales are used when the researcher wishes to offer a bigger spectrum of options to his test 28
audience, thus offering the participant the possibility of choosing a more precise answer, resulting in a greater probability of fitting the subject’s perspectives.
30
Joshi et al [24] identified three principles for the correct construction of a Likert scale 1. The minimum score one can secure for the first three items of a scale is 3
32
The IoT and Smart City Semantics
15
3. All the scale items can be clubbed while satisfying the content and criterion validity 2
In its majority, due to the restrictions implied by the third principle, a new concept was created, in order to apply the same principles of the Likert Scale to a set of non-related questions. 4
This kind of scale is called a Likert-type scale, and is used in situations where there is no attempt by the researcher to combine the responses from the items into a composite scale, but rather when 6
the primary objective of the researcher is to study the opinions, beliefs or feelings a certain phenomenon causes in the test audience, instead of the generalization of the stance of the 8
participants.
In their 2015 paper, Joshi et al. [24] also differentiate the process of data analysis based on 10
the type of scale used. When dealing with Likert-type scale data, the values assigned to the items express a greater than relationship, with the size of the comparison being undefined. Given the 12
uncertainty of this measurements, the authors consider this type of data to fall under the ordinal measurement scale. Due to this fact, the authors recommend the use of descriptive statistic tools, 14
such as “modes or median values for central tendency and frequencies for variability”.
On the other hand, when dealing with Likert scale data, the items are created by calculating 16
a composite score from four or more items through the use of a sum or a mean, the authors state that the composite score should be analyzed at the interval measurement scale. For the 18
interpretation and analysis of the results, the authors recommend the use of descriptive statistical tools, such as “the mean for central tendency and standard deviations for variability”.
20
2.4 Conclusions
Great efforts are currently being made in the fields of data interoperability within IoT, and 22
more precisely smart city systems.
The concept model developed by the British Standards Institute, mentioned in Section 2.2.2, 24
provides a good starting point for the task in hands since the achievement of syntactic interoperability is the basis for the achievement of semantic interoperability. However, and 26
according to the authors, “Sharing data across a city requires more than the interoperability covered by the SCCM.” [17]. The LOV4IoT solution, presented by Gyrard et al. [18], also offers 28
some advancements in the fields of data interoperability, by being able to aggregate ontology based projects among smart city sectors and finding common grounds between them. However, 30
the platform is currently unavailable, thus providing no contributions for this thesis.
The solution for the problem previously mentioned will take into account the research and 32
study of currently available data models for the IoT, and the construction of a comparison framework in order to categorize them. While the works developed by Moody [22], Maier [21] 34
and, most importantly, by McGee [23] provide a good stepping stone for the evaluation of data models, they can be considered dated and not focused on the intricacies of the problems presented 36
The IoT and Smart City Semantics
by IoT systems and subsequent communication protocols. In order to cover these unaddressed dimensions, additional criteria will be devised for the development of the framework.
2
Chapter 3
Data Models: Exploring a Solution
2
for Citibrain
This chapter contains an overview of the problem to be addressed in this dissertation, and 4
exposes the developed solution, detailing its methodology, architecture and the definition of evaluation criteria for the data models.
6
3.1 Problem Overview
Smart city data is obtained through sensory devices that measure different types of 8
observations, such as light, movement or temperature. These sensors provide data of different and changing quality, and, with this data often being continuous, the feed will result in different 10
validity and availability over time, translating to highly dynamic data streams [4].
Smart city data is also vast and heterogeneous in nature: being obtained from many different 12
sectors (e.g.: traffic information, home automation, environment quality); being of different nature even within the same sector, i.e. to measure environment quality one would have to access 14
metrics such as humidity, temperature and gas concentration levels in the atmosphere; as well as having different update rates.
16
Bischof et al. [4] identify three different types of update rate related to the data obtained from a city:
18
Static Data: Data never or rarely updated (e.g.: points of interest); Semi-Dynamic Data: Data updated periodically (e.g.: cultural events); 20
Data Models: Exploring a Solution for Citibrain
Table 1: Information potentially retrieved from cities [4] 2
Data Category Owner (Data Publisher) Data Description Sampling
Transport Traffic Authority Maps of Cities (Roads, Street Names, POIs, etc) Static
Municipality Public Transport Schedules Semi-Dynamic Traffic Authority Transport Authority Updates
(Roadwork, traffic status, etc) Dynamic
Air Quality Environment Agency Particle Concentration Dynamic
Traffic Traffic Authority Number of vehicles passing
between two points, speed Dynamic
City Events Cultural Groups Entertainment (movie/theater
plays) Semi-Dynamic
Municipal Services Municipality Library Data Dynamic
Private Company Parking Meters Dynamic
Citizen Data Private Individuals
Social Media Information: Tweets, Status updates and blog posts, popular places (“check-ins”)
Semi-Dynamic Household Energy Consumption Semi-Dynamic
Health Data Private and Public
Relevant information about potential or confirmed sources of health threats
Dynamic
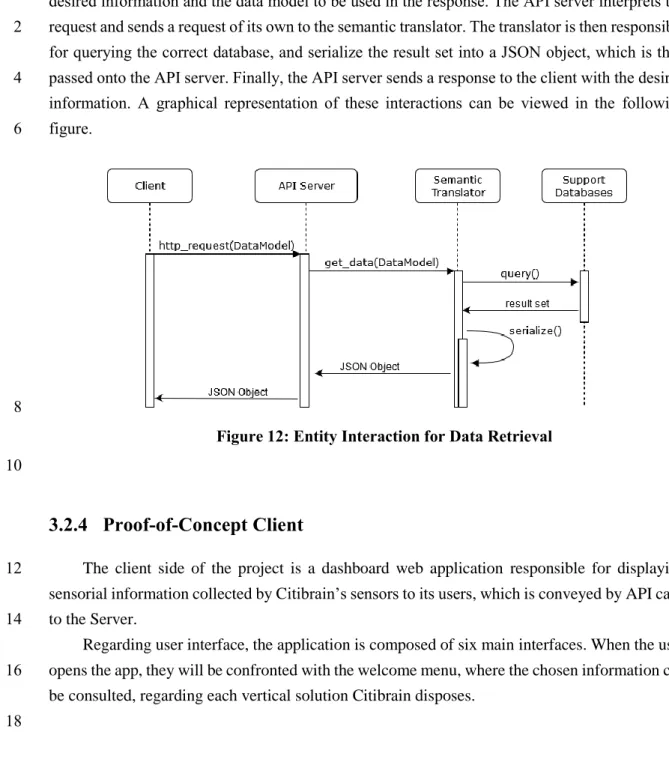
After being collected, this data is usually transferred over several systems, being integrated 4
into several lower-level (as is the case for complex sensors) or high-level (end-user) applications, as well as being made available via query or publish/subscribe services [4]. All these processes 6
create additional levels of heterogeneity. For a better understanding of this smart city data flux, the following example will illustrate a concrete use case for the measurement of air quality in a 8
city zone. An air quality sensor is usually a complex sensor, composed of several smaller sensors, responsible for measuring metrics such as temperature, gas concentration, luminance, 10
precipitation, and noise levels. The complex air quality sensor is then responsible for the aggregation of the information provided by the small sensors, and sending it to an air quality 12
management system, which will analyze the data and adapt it into the platform’s data models. Besides the analysis by the management system, the processed, structured information is usually 14
made available by the platform to websites, mobile applications and in the aforementioned publish/subscribe services, in the form of an API server. All these operations manipulate the 16
sensed data and add different types of metadata (headers, representational terms) in order to better adapt the information to the systems, but, at the same time, creating barriers to the interoperability 18
between the system and outer systems.
Extracting meaningful information from a smart city is a somewhat complex task, given the 20
co-existence of the aforementioned levels of heterogeneity created by the information flux and the overall volume of the obtained data. Then, research on the processes of data interoperability 22
Data Models: Exploring a Solution for Citibrain
19
As a result of the vastness and diversity of data, combined with the ever-increasing size of the IoT market, the heterogeneity problem goes even further. As the IoT, and specifically the 2
smart city market continues to grow and get increasingly more attention by both the industry and the research community, IoT-powered applications are being rapidly developed in a great number 4
of domains, such as environment, mobility, and healthcare. In order to keep track with this growth, companies and organizations have been betting in the development of new applications for the 6
IoT, often resulting in the emergence of heterogeneous architectures, standards, middleware platforms and applications [27].
8
Kazmi et al. [27] identified three areas of the IoT where heterogeneity is introduced through the aforesaid developments, and highlighted some efforts currently being made by organizations: 10
Architectures and Standards: Organizations and consortiums such as Fiware4, Open
Mobile Alliance5, Eclipse IoT6, the World Wide Web Consortium (W3C)7, IPSO
12
Alliance8, the European Telecommunications Standards Institute (ETSI)9, and the
Internet Engineering Task Force (IETF)10 have been developing new standards towards
14
the harmonization of device communication.
Middleware Platforms: In order to ease the collection of data from homogeneous and 16
heterogeneous sources, a number of middleware platforms have been developed, such as Hayo11, Cisco Flare12, and SensorWare13. These platforms provide a plethora of
18
functionalities, such as the collection of data from physical sensors, the transformation of such data into new structures and the enablement of interfaces for applications, and 20
are usually also combined with other ICT technologies such as cloud computing. One of the bigger goals of these platforms is the encouragement of end-users to connect their 22
IoT devices to the cloud infrastructure and the enablement of APIs for the attainment of sensory information and the development of applications.
24
Applications: Recent times have witnessed the development of many IoT applications, either for research purposes or for commercial ones. These applications are often 26
developed for very specific domains of a smart city, such as smart parking or waste management solutions, and very frequently make use of numerous IoT devices. 28 4 www.fiware.org 5 openmobilealliance.org 6 iot.eclipse.org 7 www.w3.org 8 www.ipso-alliance.org 9 www.etsi.org 10 www.ietf.org 11 www.hayo.io 12 developer.cisco.com/site/flare 13 sensorware.sourceforge.net
Data Models: Exploring a Solution for Citibrain
3.2 Data Models and Sematic Interoperability
This section contains a description of the proposed solution developed during this project. 2
Firstly, a description of Citibrain’s current platform is made, characterizing the platform’s vertical solutions and its database structure. Secondly, the used methodology is explained, describing with 4
detail the four phases that compose the project development, as well as the adopted approach for the evaluation and selection of the most suitable data model for Citibrain. Finally, the solution’s 6
architecture is presented, unfolding the several layers that compose it, how it integrates Citibrain’s current architecture, as well as the definition of the technological stack used in the development 8
of the final product.
3.2.1 Requirements
10As stated in previous chapters, Citibrain currently offers four vertical solutions in the fields of mobility and environment quality: Smart Environment Management, Smart Parking 12
Management, Smart Traffic Management and Smart Waste Management.
Sharing the same stack and technological architecture, Citibrain’s architecture defines three 14
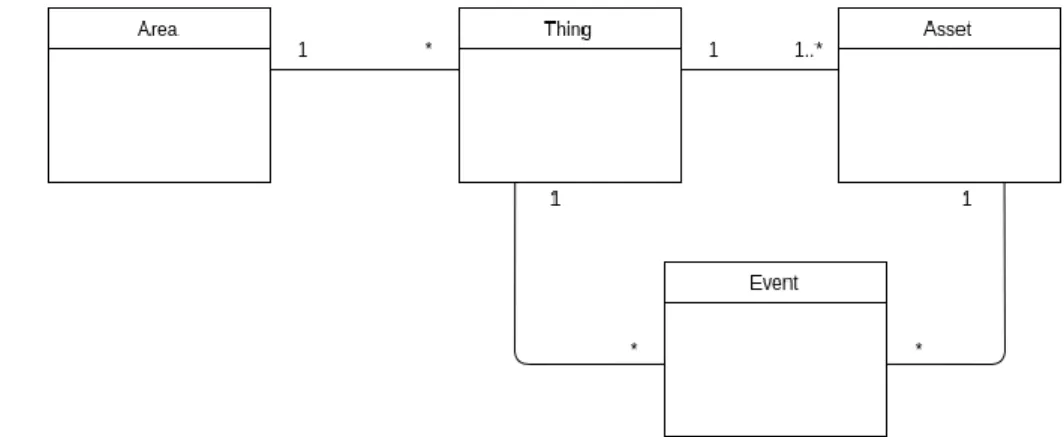
main data model entities for each vertical solution – Area, Thing, and Event - as well as a horizontal entity, Asset, which is present across all solutions.
16
18
Figure 5: Citibrain's generalized entity architecture 20
An Area represents a geographically delimited space, delineated by a polygon, containing one or more Things, physical objects or places whose features of interest are the subject of the 22
Assets’ measurements. Assets represent Citibrain’s sensory devices, which are responsible for the
detection of changes in the Thing’s status, with those measurements resulting in Events. 24
Citibrain’s Assets contain seven main attributes: (I) uuid, an Universally Unique Identifier, (ii) type, a variable of the type String which identifies if the device is either a sensor or an actuator, 26
(iii) name, identifying the Asset by a sequence of characters, (iv) is_active, a boolean value indicating if the device is currently working at its full capacities, (v) location, a geofield of the 28
Data Models: Exploring a Solution for Citibrain
21
type Point, indicating the device’s current geographical location by GPS coordinates, (vi) battery, an integer value representing the battery status of the device, and (vii) status, representing the 2
device’s possible states – ready, active, inactive or under repair. The details of the four vertical solutions’ specific entities, as well as their relations are described in the next subsubsections. 4
Due to the system agnostic nature and overall platform independence of data models, Citibrain’s requirements for new data structures consist only in the ability of the model to 6
represent all solution’s entities and relations. Other relevant characteristics of the solution comprise the minimization of overheads introduced by the models in the conversion, storage, and 8
communication protocols of the current platform.
3.2.1.1 Smart Air Quality 10
Citibrain’s environment management solution has the purpose of monitoring a city zone’s 12
overall air quality. This vertical solution is composed of several small sensing stations, installed in the urban infrastructure, such as vertical signing, street lighting or electrical posts, which are 14
capable of drawing indicators on air quality, noise pollution levels, temperature, atmospheric pressure, humidity and luminosity. These stations communicate in real time with the Air Quality 16
Management System through Wi-Fi or GPRS, and are powered energetically by the structure they
are installed in. 18
Regarding the solution’s architecture, Citibrain’s Smart Air Quality defines two main entities: Assets, representing sensors, and EnvironmentEvents, representing measurements 20
performed by the sensors. An EnvironmentEvent is characterized by a timestamp, a datetime field representing the time and date of the measurement’s occurrence, and 15 different measurements: 22
(i) temperature, measured in degree Celsius, (ii) precipitation, measured in Impulses, (iii) noise
level, measured in Decibels, (iv) particles, measured in percentage opacity, (v) carbon dioxide,
24
measured in parts per million, (vi) ozone, measured in Volt, (vii) humidity, measured in percentage, (viii) wind speed measured in Kilometer per hour, (ix) light, measured in Lux, (x) 26
solar radiation, measured in watt per square meter, (xi) carbon monoxide, (xii) nitrogen dioxide,
(xii) volatile organic compounds, (xiii) processed ozone, and (xv) processed nitrogen dioxide, all 28
measured in Volt.
These entities and their relations can be observed in the figure bellow. 30
Data Models: Exploring a Solution for Citibrain
Figure 6: Citibrain's Smart Air Quality solution's entity architecture 2
3.2.1.2 Smart Parking 4
Citibrain’s Smart Parking solution has the objective of optimizing the searching task of available parking spots to its users, diminishing the emission of pollutants into the atmosphere. 6
This solution is composed by six main features, (i) sensor-based vehicle detection, providing information about parking place availability, which is sent in real time to the parking management 8
system, (ii) a communication gateway, (iii) digital parking panels, for informing the drivers about the number of available parking spots in certain zones, (iv) payment options, such as kiosks, 10
mobile applications and SMS, (v) a mobile application for drivers, indicating available places and mapping routes to them, and (vi) an parking management system, responsible for the management 12
of all parking related data.
Besides Assets, which represent magnetic sensors capable of wireless communication 14
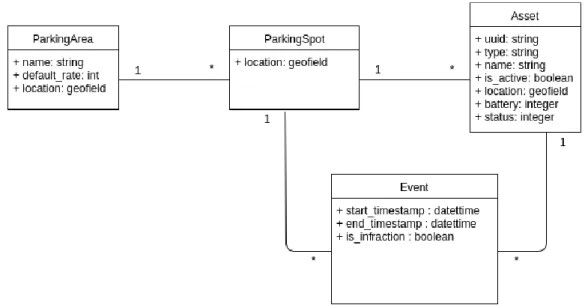
through various protocols, Citibrain’s Smart Parking Management defines three entities,
ParkingArea, ParkingSpot and ParkingEvent. ParkingArea represents a street zone with parking
16
spots, and contains three fields, the name of the zone, the default rate in euros per hour, and
location, a geographical polygon composed of three or more GPS coordinates. Parking Spots
18
represent geographical Points in space where parking is allowed, and ParkingEvents represent periods of time where a car was parked in a ParkingSpot. These events are characterized by three 20
fields, start timestamp, a datetime field indicating the moment a car parked in the spot, end
timestamp, a datetime field indicating the moment a car left the parking spot, and is infraction, a
22
boolean field indicating if the car is parked illegally in the spot. The described entities and their relations can be observed in the figure below.
24 26
Data Models: Exploring a Solution for Citibrain
23
Figure 7: Citibrain's Smart Parking solution architecture 2
3.2.1.3 Smart Traffic 4
Citibrain’s Smart Traffic Solution has the goal of evaluating the current traffic flow in a city’s roads, in order to understand the citizen’s movement within a city’s premises. The vertical 6
solution is composed of two main features: (i) sensory devices, responsible for transmitting the volume and flow of traffic through gateways, and (ii) a central system, responsible for inferring 8
inputs from the sensor networks and detecting and predicting traffic congestion.
This vertical solution contains two main entities, assets, corresponding to installed sensors 10
throughout the city, and traffic events representing measurements provided by the sensors. These events are characterized by two fields, a timestamp, indicating the time and date the observation 12
was performed, and count, an integer indicating the volume of cars counted since the last measurement.
14
16
Figure 8: Citibrain's Smart Traffic solution architecture 18
Data Models: Exploring a Solution for Citibrain
3.2.1.4 Smart Waste 2
Citibrain’s Smart Waste Solution has the objective of analyzing the filling level of a city’s waste containers, in order to optimize garbage collection. The vertical solution contains three 4
main characteristics, (i) the efficient management of waste collection routes, (ii) real time monitoring of container status via ultrasound or infrared measurements, and (iii) temperature 6
monitoring of the container or box
This solution is composed by two main actors: collection points, which consist of containers 8
with sensors responsible for informing about their occupational state and overall well-being, and the waste management system, responsible for processing the collection point’s information and 10
sending the most efficient routes to the collection trucks, with the goal of decreasing fuel costs. Regarding the database structure, besides Assets, the solution defines three main entities, 12
WasteArea, representing a geographical area containing several waste containers, and
characterized by a name, a geographical polygon defined by three or more GPS points, and a fill 14
level alert. The WasteContainers are defined by their shape, height and capacity, and contain
information relating their geographical location (GPS point) and the date and time of the last 16
waste collection (last_collection). The measurements performed by the sensors inside the containers are denominated WasteEvents, and are characterized by a timestamp of the 18
observation, the container’s fill level, temperature and information about their status (is_turned_over), indicating if the container has been tampered with. The described entities and 20
their relations can be consulted in the figure below. 22
Figure 9: Citibrain's Smart Waste solution architecture 24
![Figure 2: Data Models and IoT Middleware [6]](https://thumb-eu.123doks.com/thumbv2/123dok_br/15581743.1049329/26.892.276.648.354.657/figure-data-models-and-iot-middleware.webp)
![Figure 4: Evolution of the market size from the Internet of Things to the Semantic Web of Things [11]](https://thumb-eu.123doks.com/thumbv2/123dok_br/15581743.1049329/30.892.87.754.385.1130/figure-evolution-market-size-internet-things-semantic-things.webp)
![Table 1: Information potentially retrieved from cities [4]](https://thumb-eu.123doks.com/thumbv2/123dok_br/15581743.1049329/41.892.118.768.196.594/table-information-potentially-retrieved-cities.webp)