F
ACULDADE DEE
NGENHARIA DAU
NIVERSIDADE DOP
ORTOData Mining for Rational Drug Design
Catarina Isabel Peixoto Candeias
Mestrado em Engenharia Biomédica Supervisor: Rui Camacho
c
Data Mining for Rational Drug Design
Catarina Isabel Peixoto Candeias
Mestrado em Engenharia Biomédica
Faculdade de Engenharia da Universidade do Porto
Resumo
Atualmente existe uma crescente incidência de doenças no mundo e por isso, existe uma maior quantidade de medicamentos disponíveis para promover uma maior eficiência nos sistemas de saúde. Assim, a importância dos novos medicamentos é indiscutível para a vida humana e, conse-quentemente traduz-se numa maior competência a nível profissional, trazendo muitos benefícios para a sociedade em geral. Por acréscimo, o seu uso consciente conduz também a uma decrescente necessidade de outros cuidados de saúde mais prolongados e de custos mais elevados.
Os fármacos desencadeiam um efeito terapêutico que proporciona uma melhoria de qualidade de vida, no entanto, para sintetizar um fármaco novo, a indústria farmacêutica tem que percorrer um longo, complexo e oneroso processo.
Um dos problemas de saúde que tem vindo a crescer exponencialmente corresponde às doenças neurodegenerativas. Este crescimento veio então aumentar a necessidade de descobrir e desen-volver novos fármacos que possam combater este problema. O processo de conceção de fármacos para este tipo de doenças, em que o fármaco tem que alcançar o Sistema Nervoso Central (SNC), é ainda mais demorado devido à complexidade do cérebro, à tendência dos fármacos para provo-carem efeitos adversos graves e principalmente devido à existência da Barreira Hemato-Encefálica (BHE).
O processo de conceção de fármacos é constituído por diversas etapas até atingir a fase final que corresponde aos testes clínicos. Uma das fases do processo testa cinco propriedades impor-tantes de um medicamento, conhecida como fase dos testes ADMET (Absorção, Distribuição, Metabolismo, Excreção e Toxicidade). Estes testes são geralmente muito dispendiosos pois são efetuados em animais.
Com base no historial dos testes ADMET e informação sobre a estrutura e propriedades da molécula do princípio ativo de um fármaco, a informática pode dar um importante contributo para atenuar o problema dos custos elevados e do tempo gasto no processo de desenho de fármacos. Um dos pontos em que o Data Mining pode ser relevante é em evitar ou reduzir a fase em que as moléculas mais promissoras são testadas em animais, ou seja, com base nos resultados anteriores, o Data Mining pode ser utilizado para prever que moléculas vão apresentar resultados mais viáveis. O trabalho desta dissertação consiste no estudo de técnicas de Data Mining e avaliação das suas potencialidades para melhorar o processo de desenvolvimento de novos fármacos, e sobretudo contribuir para o melhoramento e redução dos custos dos testes ADMET.
Particularmente, consiste na utilização de dois conjuntos de dados: dados com informação sobre a toxicidade das moléculas e dados com informação sobre moléculas que conseguem ultra-passar a Barreira Hemato-Encefálica.
Abstract
Currently there is an increasing incidence of diseases in the world and therefore, there is a greater quantity of medicines available to promote a greater efficiency in the health systems.
Thus, the importance of new medicines is indisputable for human life and, consequently trans-lates into greater professional competence, bringing many benefits to society. In addition, its conscious use also leads to a decreasing need for other, longer and more expensive health care.
Drugs trigger a therapeutic effect that provides an improvement in quality of life. However, to synthesize a new drug, the pharmaceutical industry has to go through a long, complex and costly process.
One of the health problems that has been growing exponentially corresponds to neurodegen-erative diseases. This growth increased the need to discover and develop new drugs that could counteract this problem. The drug design process for this type of disease, in which the drug has to achieve the Central Nervous System (CNS), is even more time-consuming due to the complex-ity of the brain, the tendency of the drugs to cause serious adverse effects and mainly due to the existence of the Blood-Brain Barrier (BBB).
The process of drug design consists of several steps until reaching the final phase that corre-sponds to the clinical tests. One of the process steps consists on testing five important properties of a drug, known as ADMET (Absorption, Distribution, Metabolism, Excretion and Toxicity) tests. These tests are usually very expensive because they are done on animals.
Based on the ADMET tests historical and information on the structure and properties of a drug’s active principle molecule, Informatics can make an important contribution to alleviating the problem of high costs and time spent in the drug design process. One of the points in which Data Mining may be relevant is to avoid or reduce the phase where the most promising molecules are tested on animals. Based on the previous results, Data Mining can be used to predict which molecules are going to present more viable results.
The work of this dissertation consists of the study of Data Mining techniques and evaluation of its potentialities to improve the process of development of new drugs, and above all to contribute to the improvement and reduction of the costs of ADMET tests. In particular, it consists of the use of two data sets: data with information about the toxicity of molecules and data with information on molecules that can overcome the Blood-Brain Barrier.
Acknowledgment
First of all, I would like to thanks to my supervisor Rui Camacho for all the support that he gave me during this project. Mainly I would like to thank him for all the availability, patient and support shown. I’m sure that without his help and knowledge, it would be more difficult for me.
Secondly, I would like to thanks my family, specially my mother, for giving me the encour-agement and strength that I needed to achieve this.
Generalizing, I would like to express my sincere gratitude to those who, directly or indirectly, have contributed to achieving this work.
Finally, I want to thank the project "NanoSTIMA: Macro-to-Nano Human Sensing: Towards Integrated Multimodal Health Monitoring and Analytics / NORTE-01-0145-FEDER-000016" funded by Northern Regional Operational Program (NORTE 2020), under the agreement of PORTUGAL 2020, and through the European Regional Development Fund (European Regional Development Fund (ERDF) for the provision of data used to the realization of this project.
Catarina Isabel Peixoto Candeias
“Recomeça... se puderes, sem angústia e sem pressa e os passos que deres, nesse caminho duro do futuro, dá-os em liberdade, enquanto não alcances não descanses, de nenhum fruto queiras só metade.”
Miguel Torga
Contents
1 Introduction 1 1.1 Contextualization . . . 1 1.2 Objectives . . . 2 1.3 Dissertation structure . . . 3 2 State of art 5 2.1 Development of new drugs . . . 52.1.1 Basic concepts . . . 5
2.1.2 Rational Drug Design . . . 7
2.2 Molecular descriptors . . . 10 2.3 Data Mining . . . 15 2.4 Ontologies . . . 29 2.5 Related work . . . 31 2.6 Chapter summary . . . 33 3 Experimental evaluation 35 3.1 Work plan contextualization . . . 35
3.2 Data preparation . . . 36
3.3 Cases studies . . . 36
3.3.1 Toxicity Experiments . . . 36
3.3.2 Blood-Brain Barrier penetration Experiments . . . 43
4 Results and discussion 49 4.1 Toxicity Experiments . . . 49
4.2 Blood-Brain Barrier penetration Experiments . . . 54
5 Conclusions and Future work 59 5.1 Satisfaction of results . . . 59
5.2 Future work . . . 60
References 61
List of Figures
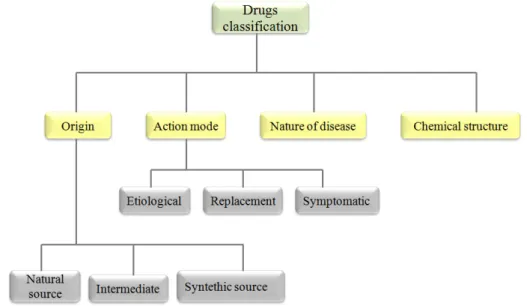
2.1 Schematic representation of possible criteria to classify drugs. Adapted from5. . . 6
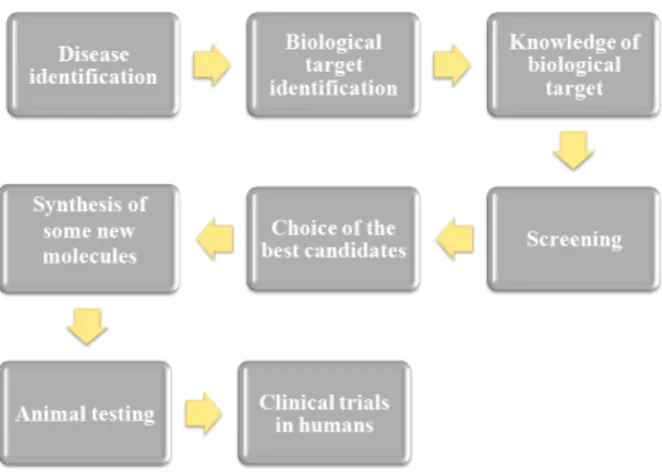
2.2 Different steps of the development of new drugs. Adapted from [1]. . . 8
2.3 Five transport routes through BBB. Extracted from [2]. . . 10
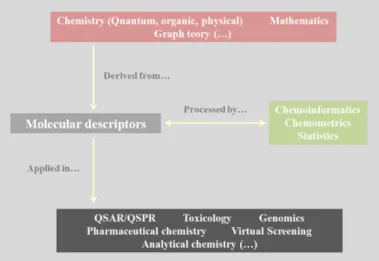
2.4 Representation of molecular descriptors origin, processing and applications. Adapted from10. . . 11
2.5 An overview of the steps that compose the KDD process. Extracted from [3]. . . 16
2.6 Phases of CRISP-DM process. Extracted from37. . . 18
2.7 An example of the Hold-Out method using 80% of the examples for training and 20% for testing. . . 27
2.8 An example of the 2-fold Cross Validation method. . . 28
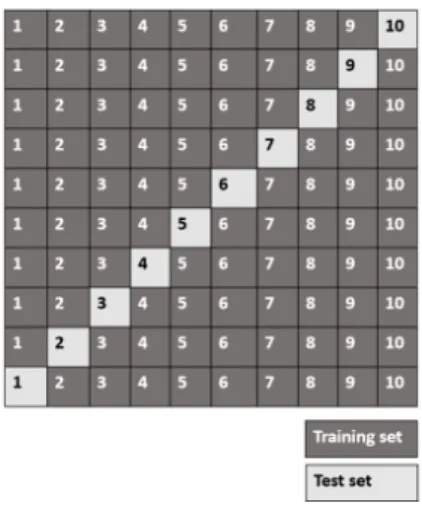
2.9 An example of the specific case of Leave-One-Out Cross Validation method. . . . 28
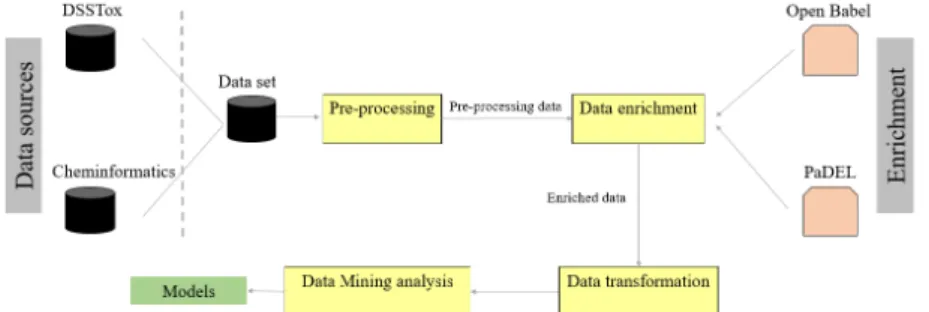
3.1 Brief explanation of the work that was developed. . . 35
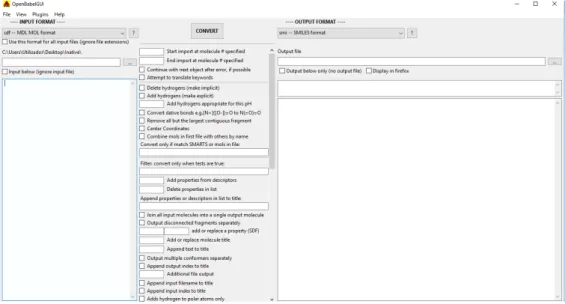
3.2 Representation of the graphic interface of the OpenBabel software. . . 38
3.3 Representation of the graphic interface of the PaDEL software. . . 38
3.4 Classification process without feature selection. . . 39
3.5 Sample of the output of the "Set Role" operator for CPDBAS data set. . . 40
3.6 Sub-process of "Cross Validation" operator. . . 40
3.7 Classification process with feature selection. . . 41
3.8 Sample of the output of the "Weight by Correlation" operator for CPDBAS data set. 41 3.9 Representative histogram of the activity of molecules. . . 45
3.10 Sample of the file corresponding to the attribute ’class’. . . 45
3.11 Linear Regression process. . . 46
3.12 Classification process for BBB penetration data. . . 47
4.1 Results of the accuracy for CPDBAS data set (without and with feature selection) and the four classification algorithms under study. . . 51
4.2 Results of the accuracy for the two EPAFHM data sets and the four classification algorithms. . . 54
4.3 Accuracy for the four algorithms under study. . . 57
List of Tables
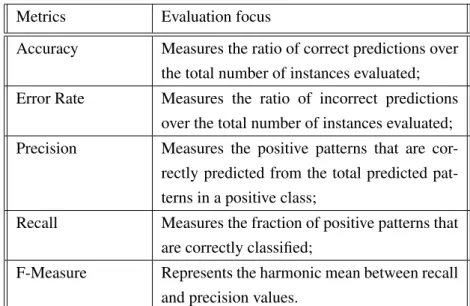
2.1 Metrics for classification evaluations. Adapted from [4]. . . 25
2.2 Example of a confusion matrix. . . 26
3.1 Methodology for toxicity experiments. . . 37
3.2 Methodology for regression experiments of BBB penetration data set. . . 43
3.3 Methodology for classification experiments of BBB penetration data set. . . 44
4.1 Results of the classification experiment (without feature selection) for CPDBAS data set. . . 50
4.2 Results of the classification experiment (with feature selection) for CPDBAS data set. . . 50
4.3 Results of the accuracy averages for each of the algorithms used. . . 51
4.4 Results of the classification experiment (with feature selection) with SVM algo-rithm for the two EPAFHM data sets. . . 52
4.5 Results of the classification experiment (with feature selection) with k-NN algo-rithm for the two EPAFHM data sets. . . 52
4.6 Results of the classification experiment (with feature selection) with Decision Tree algorithm for the two EPAFHM data sets. . . 52
4.7 Results of the classification experiment (with feature selection) with Random Forest algorithm for the two EPAFHM data sets. . . 53
4.8 Results of the regression experiment with Linear regression algorithm for BBB penetration data set. . . 54
4.9 Results of the regression experiment with SVM algorithm for BBB penetration data set. . . 54
4.10 Results of the regression experiment with k-NN algorithm for BBB penetration data set. . . 55
4.11 Results of the classification experiment (without gray area) for Blood-Brain Bar-rier penetration data set. . . 55
4.12 Results of the classification experiment (with gray area) for Blood-Brain Barrier penetration data set. . . 56
4.13 Results of the classification experiment (with gray area) with SVM algorithm. . . 56
Abbreviations and Symbols
ABI Adaptive Business Intelligence
ADMET Absorption, Distribution, Metabolism, Excretion and Toxicology AI Artificial Intelligence
AUC Area Under the Curve BBB Blood-Brain Barrier
ChEBI Chemical Entities of Biological Interest CML Chemical Markup Language
CMS Common Maximum Substructure CNS Central Nervous System
CPDBAS Carcinogenic Potency Database Summary CRISP-DM Cross-Industry Standard Process of Data Mining
DBSCAN Density-Based Spatial Clustering of Applications with Noise
DM Data Mining
DOGMA Developing Ontology-Grounded Methods and Applications DSSTox Distributed Structure-Searchable Toxicity
EPAFHM EPA Fathead Minnow
FDA Food and Drug Administration ILP Inductive Logic Programming InChI International Chemical Identifier
IUPAC International Union Of Pure and Applied Chemistry KDD Knowledge Discovery in Databases
KIF Knowledge Interchange Format k-NN k-Nearest Neighbors
MAE Mean Absolute Error MDL Molecular Design Limited MED Mid-continental Ecology Division NLM National Library of Medicine NMR Nuclear Magnetic Resonance NTP National Toxicology Program OWL Web Ontology Language
PACT-F Preclinical And Clinical Trials knowledge base on bioavailability PKKB PharmacoKinetics Knowledge Base
RDD Rational Drug Design
RDF Resource Description Framework RMSE Root Mean Squared Error SAR Structure-Activity Relation SDF Structure Data Format
SMILES Simplified Molecular Input Line Entry System xv
xvi ABBREVIATIONS AND SYMBOLS
SVM Support Vector Machine
TEHIP Toxicology and Environmental Health Information Program VMD Visual Molecular Dynamics
WEKA Waikato Environment for Knowledge Analysis W3C World Wide Web Consortium
WHO World Health Organization WWW World Wide Web
Chapter 1
Introduction
In this chapter, a context for the work is provided, the domain problem is identified and the main goals of the dissertation are specified.
1.1
Contextualization
In recent years, an enormous number of drugs has contributed to an increase in efficiency in health systems, promoting an improvement in quality of life of the population and also a decrease in the mortality rate.
Drugs are molecules that when introduced into the human body produce a therapeutic effect. However, the impact of drugs use causes some controversy in society. On the one hand, drugs may increase the average life time expectancy of people and allow curing some diseases leading to an improved quality of life. On the other hand, they can increase health-care costs if used incorrectly, and also lead to adverse effects [1].
The discovery of new drugs is related to scientific and technological innovations. The major advances in some areas such as chemistry and biology, and a better understanding of targets and molecular mechanisms that lead to the onset of diseases, have made possible the discovery of remarkable therapeutic formulations [1].
One drawback of the design of new drugs is that it is a process highly complex, long (about five to twelve years) and costly [1]. When the process refers to the design of drugs for the Central Nervous System (CNS), it can take even longer (up to 16 years).
Regarding the success rate of the drugs for CNS being approved, the percentage is much lower, about 8%, while drugs for the cardiovascular system, for example, have a success rate of 20%1.
Furthermore, the discovery of new drugs is not always achieved. Normally the main cause for that is the lack of efficacy, the existence of toxicity in preclinical trials and any uncertainty in clinical trials [5]. Rational Drug Design (RDD) is an interdisciplinary process that requires the collaboration of researchers with very different skills [6]. RDD aims at a fast and cheap
1Alzheimer’s Drug Discovery Foundation. Available inwww.alzdiscovery.org/, accessed last time in
22-11-2016
2 Introduction
development of new drugs and can strongly benefit from two research areas: Chemoinformatics and Knowledge Discovery in Databases (KDD)2.
With the advancing of times, technologies using computers play a crucial role in all health-related areas. The increase of technological knowledge leads to greater development in this area. Although Informatics tools can be quite useful in more than one step of the drug design process, the focus of the study will be the contribution that Informatics, and Data Mining specifically, can do to the ADMET tests phase.
There are currently several computational methods to predict drug efficacy. These predictive tests help health care providers in choosing the best drug for each situation, and may avoid future problems and adverse effects in patients. With the use of these tools, the time required for the drug development process decreases substantially.
Data Mining uses historical data to construct predictive models. Since the amount of drug design related data in the Internet has increased at a very large pace in the last years, those data repositories can be used to improve KDD.
1.2
Objectives
The main goal of this dissertation is the use of Chemoinformatics and Data Mining tools in order to help in the KDD process which will lead to a reduction in time and cost of the development of new drugs. The approach adopted in this study is directed to a testing phase, in the process of development of new drugs, related to toxicity (ADMET tests) and is also directed to molecules behaviour for Blood-Brain Barrier penetration. Thus, several key points have to be studied and addressed.
In the first part of this project, the main objectives are to understand the basic concepts of drugs, molecular descriptors and their tools, and the overall process of RDD. Secondly, the goal is to explore the concepts of Data Mining tasks and tools, and describe some related work.
After this research, it is essential to investigate and explore Data Mining tools for predicting drug efficacy. The purpose is to use DM techniques in a simplified way to construct models to predict drug efficacy, in order to reduce the time spent designing a new drug.
Thus, it is extremely necessary to address the following two research questions: H1. Is DM useful to improve the drug design process?
H2. Can we provide extra domain knowledge to improve the DM construct model? The answer to these questions is debated in the conclusions of the work in Chapter5.
2KDD is a several step data analysis process, one of which is Data Mining (DM), where models are constructed.
Since Data Mining is one of the most important steps, KDD is often referred to as DM. From now on it will be used DM to refer to both the model construction step and the KDD process as a whole.
1.3 Dissertation structure 3
1.3
Dissertation structure
This report is divided into five chapters. This first chapter presents a general approach and contex-tualization of the theme, as well as the main goals of the work.
Chapter2introduces the basic concepts related to the state of art of the domain: drugs, molec-ular descriptors and Chemoinformatics tools. In that chapter are also explained several concepts concerning the RDD process, Data Mining algorithms, methodologies and tasks, and ontologies.
In Chapter3is presented the project implementation from the data preparation to the processes and algorithms used.
Chapter4describes the experiences, results achieved and some conclusions of these. Finally, the conclusions and future work are presented in Chapter5.
Chapter 2
State of art
This chapter introduces the reader to the state of the art of the domain of our study. It addresses the essential topics related development of new drugs and Chemoinformatics. It presents the overall process of Rational Drug Design (RDD), a description of the state of the art of the Data Mining and related work on the topic of the dissertation. A set of relevant concepts concerning ontologies are also described.
2.1
Development of new drugs
2.1.1 Basic concepts
Since ancient times, people seek in nature resources to relieve and treat the diseases that arise. In early days, therapeutic resources used were derived from plants and animals, among others. Later on, the search for active principles1of plants to create the first drugs2 improved matters3. Most drugs that are used in modern medicine, are the result of the progress achieved since the second world war in the field of synthetic organic chemistry and biotechnology4. The process of research and drug development has undergone several changes over time with the advances in molecular biology. A drug is defined as any substance other than food or an artefact, which is used for diagnosis, alleviation, treatment and cure of diseases, as well as for the prevention of them4. It can be defined as a chemical that interacts with a body part, to change an existing physiological or biochemical process, and may decrease or increase the function of an organ, tissue or cell, but it does not create new functions4, [1].
1An active principle is defined as the constituent of a drug that is widely responsible for conferring pharmacological
effect. Different drugs may have the same active principle.
2The concept of drug and medicine sometimes is confused. However, these are different concepts, since the medicine
is the final product containing the active ingredient (drug), presented in various pharmaceutical forms (capsule, liquid, among others.)
3"Conceitos gerais sobre medicamentos".Available in www.anvisa.gov.br/hotsite/genericos/
profissionais/conceitos.htm, accessed last time in 25-10-2016
4"Generalidades sobre os fármacos".Available inwww.manuaismsd.pt/?id=31, accessed last time in
25-10-2016
6 State of art
Drugs classification
There are several criteria to classify drugs as is possible to see in Figure2.1. They can be classified according to:
Origin
i) Natural source: inorganic, animal, vegetable (more prevalent). ii) Synthetic source.
iii) Intermediate: corresponding to products of fermentation and genetic engineering. Action mode
i) Etiological drugs: treat the cause of a disease; almost all belong to the class of chemothera-peutics used to treat infections and parasitic diseases.
ii) Replacement drugs: to overcome for the deficiency of a substance; this deficiency may be due to poor diet, or physiological disorders; substitution treatment may be temporary or perma-nent.
iii) Symptomatic drugs: alleviate the symptoms of a disease; they are used to attenuate or neutralize disorders resulting from a pathological condition.
Nature of the disease: classification adopted by World Health Organization (WHO) that dis-tinguishes the drugs by the organ in the body which they operate.
Chemical structure: allows for screening drugs analogs derived from the same compound, which facilitates the establishment of correlations between structure and activity5.
Figure 2.1: Schematic representation of possible criteria to classify drugs. Adapted from5.
5"Classificação de fármacos".Available in https:fenix.tecnico.ulisboa.pt/downloadFile/
2.1 Development of new drugs 7
2.1.2 Rational Drug Design
Drugs are used since ancient times for catalyzing chemical changes in the human body and for its development. With the widespread use of computers, a new approach for drug design emerged.
Rational Drug Design (RDD) is the process of creating new drugs with the aid of computa-tional methods. This design is based on information about chemical structures for computacomputa-tionally aided analysis and identification of chemical groups that are drug candidates [1].
Over time, drug design has been evolving into more organized processes that become crucial, and new techniques have been tested and used accordingly. After being made a market survey on the disease to be treated, the second step consists in identifying the biological target. The knowledge of the biological target is essential for drug design, because the developed molecules must comply with some minimal structural characteristics to bind to the active regions of the final target. Then it is important to identify the cellular localization of the target at the level of the cell membrane or intracellular. The initial prototype can be found in two distinct ways: based on the binder, that is, when there is prior knowledge of molecules that bind to the desired biological target molecule; and based on the structure, which means that, by methods such as x-ray crystallography or Nuclear Magnetic Resonance (NMR) spectroscopy, the three-dimensional structure of the target is known6, [7].
The design of the drug structure will depend on the organ it will act, so there are some struc-tural requirements. In addition to bind to the target, the drug must be able to interact with it so, a further step designated by screening, is required.
In the screening phase, different biological assays in molecular, cellular and organic levels, are made to define the activity and selectivity of the future drug candidate.
After these steps, the drug candidates that successfully surpass the screening procedures must be optimized. This optimization can be done by increasing the degree of activity, increasing the selectivity and passing successfully the tests of Absorption, Distribution, Metabolism, Excretion and Toxicology (called ADMET) [1].
One of the major problems with the ingestion of certain drugs is their side effects. Instead of binding to the biological target as intended, drugs can do the same with other undesirable molecules and then trigger chemicals processes which are not important for the treatment of dis-ease and may even raise other problems. So, it is important to reach a prototype with high selec-tivity, whose activity is reduced to the undesirable molecules [1].
The next step is to conduct ADMET tests in animals to assess each of the characteristics. The last stages of the drug design process are the clinical trials. These are conducted in humans and aim to strengthen the results about the safety of the drug, the recommended dosage and its effectiveness [1].
These clinical studies can be divided into four distinct phases:
6Biopharmaceutical Research Development.Available in http://phrma-docs.phrma.org/sites/
8 State of art
Phase I: the main objective of this phase is to evaluate the tolerance in humans and the recom-mended dosage. The patients are monitored for 24 hours, because the purpose is to evaluate the effect of the first dose.
Phase II: this phase aims to study the therapeutic efficacy of the dose range, the kinetics and metabolism.
Phase III: is intended to test the efficacy and safety over a large number of samples, which means, increasing the diversity of people in the tests. The studied drug is administered to a patient sample as similar as possible to the intended population after marketing.
Phase IV: as phase III, this phase aims to test the effectiveness and safety through a high number of samples. After the sale, the drug continues to be studied by pharmacovigilance, which aims to obtain information on their effects, their interactions with other medications and assess their safety. This phase belongs to the responsibility of the regulatory organization and corresponds to the drug study used in the medical practice [1].
Figure2.2summarizes all process of development of new drugs.
Figure 2.2: Different steps of the development of new drugs. Adapted from [1].
ADMET tests
The human body has many defence mechanisms to expel foreign bodies and to protect it from viruses, infections, etc. The five features of ADMET tests must be understood in order to develop a successful drug [1].
Absorption determines the ability of a compound to overcome the barriers of the human body and reach the target tissue or organ.
Distribution of a drug is usually through the bloodstream, and therefore, the effect of the drug on the target is related to plasma concentration. Different tissues and organs have different absorption capacities and do not have the same rate of blood flow. So, distribution determines the amount of drug which is administered.
2.1 Development of new drugs 9
Metabolism consists in enzymatic reactions to which the compounds are subject when they enter the organism. These reactions can be hydrolysis- that will inactivate the compound or make it more soluble- or oxidation/reduction reactions that will alter the chemical structure of the com-pound.
Excretion is the elimination of metabolites (resulting from the breakdown of molecules enter-ing the body) through urine, faeces or sweat.
Finally, the toxicity is the degree of damage that the drug can cause to the organism [1].
Drug design and the Blood-Brain Barrier
Designing drugs to act within the brain is a special case of the design process. The drug design process was already explained, but when referring to Central Nervous System (CNS) drugs, the success rate is much lower. This low rate has several causes, such as, the high degree of complexity of the brain, the problem of the side effects that drugs can cause in the CNS and the presence of the Blood-Brain Barrier (BBB) [8].
Blood-Brain Barrier is a highly selective permeable structure that protects the CNS7. This bar-rier consists of endothelial cells that form capillaries in the brain, and limits the entry of molecules due to the tight junctions formed by transmembrane proteins, negative polarity of the surface and the high level of efflux transporters. The tight junctions significantly reduce the permeation of ions and other small hydrophilic solutes through intercellular gap (paracellular route), thereby forming the physical barrier [9]. This barrier is a vital element in regulating the stability of the internal environment of the brain [10]. Thus, the BBB is very important for the CNS connection to periph-eral tissues, and acts as an interface that limits and regulates the exchange of substances between the CNS and the blood. Apart from the selective permeability functions that protect the CNS from damage, BBB has other functions such as providing a stable environment in neural function and maintaining an optimal ionic composition for synaptic signalling function by junction specific ion channels and transporters. The BBB also helps to maintain the separation between the central and peripheral transmitters, thereby reducing their communication [11,12,13].
This barrier excludes from the brain all large molecules and 98% of small-molecules of drugs [14]. Only small molecules with high solubility in lipid and a molecular weight of less than 400-500 Daltons can cross the BBB. Unfortunately, only a few brain diseases respond favorably to these drugs. Another problem of small molecules is that only a low percentage of them can cross the BBB in sufficient pharmacological quantities [15].
Drugs that are specific to the CNS must first cross the BBB. The clarification of drug transport mechanisms across the Blood Brain Barrier is important for improving the effectiveness of drugs into the CNS and reducing their toxicity [2,16,17].
The transport mechanisms through the BBB can occur in five ways and are represented in Figure2.3.
7"Barreira hematoencefálica".Available in www.oncoguia.org.br/conteudo/
10 State of art
Figure 2.3: Five transport routes through BBB. Extracted from [2].
One of these routes of transport (represented by letter ’a’ in the figure), is the paracellular and it corresponds to the diffusion of the polar solutes by the tight junctions.
Represented by letter ’b’ is transcelular lipophilic. This route represents the passive diffusion of lipid soluble agents and is related to some properties of the molecules.
The third route corresponds to the transport proteins (represented by letter ’c’). These pro-teins are in the endothelium and correspond to the entry of various nutrients and endogenous compounds.
Another pathway is receptor-mediated transcytosis (represented by letter ’d’ in the figure). It corresponds to the transport to the brain of some proteins, such as, insulin and transferrin.
Represented by letter ’e’, the fifth route is adsorptive transcytosis. There are native plasma proteins that are surrounded by positive charges, in order to increase the transport through this pathway.
BBB is very protective in nature. Thus, the inability of molecules of a drug to penetrate it is a significant impediment for the CNS drug candidates and must be taken into consideration early in the drug design process. This can be changed by an effort to develop knowledge concerning the BBB transport properties and molecular and cellular biology of the capillary endothelium of the brain. However, even if some pharmaceutical company decides to develop a BBB program there are few scientists with knowledge on the subject [2,9,14,16].
2.2
Molecular descriptors
The properties of a molecule contain all of the essential chemical information about it. However, only part of this information is extracted from experimental measurements, as the properties of a molecule do not result from the sum of the properties of its components. Due to this complexity, molecular structures cannot be represented by a single formal model. Thus, various molecular
2.2 Molecular descriptors 11
representations exist that can represent the same molecule8,9. Therefore, to facilitate this repre-sentation molecular descriptors were introduced. Molecular descriptors are designed to assist in the drug study process10.
V. Consonni and R. Todeschini8describe a molecular descriptor as "the final result of a logic and mathematical procedure which transforms chemical information encoded within a symbolic representation of a molecule into a useful number or the result of some standardized experiment." Thus, a molecular descriptor is the numerical description of some property of the molecule. These numbers represent various parts of the chemical information contained in different molec-ular representations. These descriptors are usually used to establish quantitative relationships between structure and properties, and biological activities11.
Currently, molecular descriptors play an essential role in scientific research, as can be seen in Figure2.4.
Figure 2.4: Representation of molecular descriptors origin, processing and applications. Adapted from10.
A proof of the interest of the scientific community by molecular descriptors is the number of descriptors that exist today. About 2000 descriptors are defined and can be calculated using spe-cific software. The different descriptors are distinguished by the complexity of the encoding infor-mation and the time required for calculation. Generally, computational requirements increase with what degree of discrimination is achieved, for example, the molecular weight does not transmit
8What is a molecular descriptor, Viviana Consonni and Roberto Todeschini, 2000.Available in www.
moleculardescriptors.eu/tutorials/T1_moleculardescriptors_what_is.pdf, accessed last time in 25-10-2016
9Molecular descriptors: An introduction, 2006. Available in http://infochim.u-strasbg.fr/CS3/
program/material/Todeschini.pdf, accessed last time in 24-11-2016
10Molecular descriptors and chemometrics: a powerful combined tool for pharmaceutical,
toxicologi-cal and environmental problems, Roberto Todeschini.Available in www.iamc-online.org/tutorials/T2_ moleculardescriptors_chemom.pdf, accessed last time in 25-10-2016
11An integrated web-based platform for molecular descriptor and fingerprint computation, March, 2015. Available
12 State of art
much on the properties of a molecule but is very quick to compute, while the quantum mechanics can provide accurate representations of properties but take longer time to be calculated [18,19].
There are several types of molecular descriptors:
3D descriptors: depend on the internal coordinates or absolute orientation of the molecule. 3D descriptors encode several aspects of the three-dimensional structure of the molecule. These descriptors are used in many studies because of the relevance that accompanies the relation-ship between the ligand conformation and its bioactivity;
2D descriptors: represent descriptors of single value calculated from the graph of the molecule and characterize the structures according to the size, degree of branching and the shape of the overall molecule;
0D and 1D descriptors: are very general, fast to calculate, and therefore do not describe suffi-ciently the molecule;
fingerprints: are a particular and complex type of molecular descriptors that represent the molec-ular structures and properties of molecules. These features are usually encoded as binary bit vectors, whose purpose is to reproduce (in several different ways), a characteristic pattern of the given molecule12, [19,20,21,22].
Chemoinformatics tools and data files formats
Chemoinformatics tools are quite valuable since they help to speed up and automate a lot of im-portant tasks of the RDD process. In this project were only used tools to compute molecular descriptors and tools to convert among data formats.
Tools for the calculation of molecular descriptors can transform chemical information which is encoded into a symbolic representation of the numbers in the molecule, or receive files with the chemical information of molecules and calculate the molecular descriptors.
Currently, the available tools to calculate molecular descriptors and for data conversion are: PaDEL Descriptor is an open source software used for the calculation of molecular descrip-tors and fingerprints. Through the chemical formula of a given substance, this software is able to translate it into mathematical values, which provide detailed information about the substance to be explored. It has the ability to calculate 1875 descriptors (1444 descriptors (1D, 2D) and 431 3D descriptors) and 12 types of fingerprints. It is a program developed using the Java13language and consists of a library and an interface component14.
OpenBabel is a chemoinformatics tool designed to read various chemical data formats. It is an open source software. It can be used for several purposes, such as, filtering, conversion,
12"Descritores moleculares para aprendizagem automática".Available inhttp://joao.airesdesousa.com/
agregacao/slides_2013/descritores_QSPR_slides.pdf, accessed last time in 24-11-2016
13Java is a programming language and computing platform.
14Padel-descriptor, 2014.Available inwww.yapcwsoft.com/dd/padeldescriptor/, accessed last time in
2.2 Molecular descriptors 13
analysis and storage of molecular modeling data. This tool is commonly used for the proliferation of multiple formats of chemical files, since it has the capacity to convert about 110 formats15, [23]. PowerMV is a software used for statistical analysis, molecular viewing, calculation of de-scriptors and similar researches. It supports files in SDF format and properties of molecules can be exported to Excel to generate custom reports16.
MODEL (Molecular Descriptor Lab) is a software that allows the calculation of structural and physico-chemical properties of molecules from its 3D structure [24].
JOELib is a software used for the chemical conversion of file formats. It is a chemoinformat-ics library programmed in Java and has an interface with external programs17.
Visual Molecular Dynamics (VMD) is a computer program used for molecular analysis and for the analysis of large biomolecular systems using 3D graphics and embedded scripts. This program allows a modeling and analysis of several biological systems, such as proteins. VMD is very easy to use and run on MacOS X, Unix and Windows [25]. There is no limit on number of molecules or atoms viewed, supports more than 60 molecular file formats and has extensive documental support18.
These tools support files in various formats19.
Structure Data Format (SDF) belongs to the chemical data file formats developed by Molecular Design Limited (MDL). It is a chemical file format used to represent chemical structures and has the interesting feature of allowing the inclusion of extra associated data. Due to its characteristics, it is the most widely used standard for importing and exporting information on chemical data20.
Another format commonly used for molecule notation is the Simplified Molecular Input Line Entry Specification (SMILES). In this language there are two main types of symbols, atoms and bonds. This format has the advantage of presenting the information in an understandable and very compact way21. The SMARTS format is used to match chemical file substructures, using rules that are direct extensions of SMILES22.
Chemical Markup Language (CML) acts as a support for chemical substances, such as molecules, and also for reactions, spectros, analytical data, among others. Manages molecular information using Extensible Markup Language (XML)23and Java languages. This format has the advantage
15Open babel:The open source chemistry toolbox, 2011.Available inhttp://openbabel.org/wiki/Main_
Page, accessed last time in 12-10-2016
16Powermv.Available inwww.niss.org/research/software/powermv, accessed last time in 25-10-2016 17Joelib/joelib2.Available inhttps://sourceforge.net/projects/joelib/, accessed last time in
25-10-2016
18VMD program.Available inwww.ks.uiuc.edu/Research/vmd/, accessed last time in 20-01-2017 19There are, currently, around 100 file formats for chemoinformatics data.
20How to create SD/SDF files.Available in https://eurl-ecvam.jrc.ec.europa.eu/
laboratories-research/predictive_toxicology/qsar_tools/qrf/How_to_create_SDF_files. pdf, accessed last time in 18-11-2016
21SMI file extension.Available inwww.file-extensions.org/smi-file-extension-daylight-smiles-file,
accessed last time in 18-11-2016
22SMARTS - A Language for Describing Molecular Patterns.Available inwww.daylight.com/dayhtml/doc/
theory/theory.smarts.html, accessed last time in 18-11-2016
23XML is a language that defines a set of rules for encoding documents in a format that can be understood by humans
14 State of art
of using XML portability to help interoperate documents between the various entities of interest24. International Chemical Identifier (InChI) is a text identifier for chemicals. It is used to stan-dardize the coding of molecular information and to facilitate the search of this information, thus allowing an easier connection between the various data collections. This format was developed during a project of the International Union of Pure and Applied Chemistry (IUPAC)25.
Web repositories
There are many web repositories with available databases storing drugs efficacy tests. Some of them allow public access, others have a cost.
Distributed Structure-Searchable Toxicity (DSSTox) is a project that belongs to the Com-putational Toxicology Research Program of the United States Environmental Protection Agency. It is a repository that provides a fairly complete chemical resource, which contains toxicity data present on certain molecules and chemical structures26. This database is free, so it can be con-sulted by the general public, thus promoting research and development. The format of this data is the SDF, already explained above27.
US Food and Drug Administration (FDA) is a well-known regulatory agency of drugs that is responsible for ensuring the safety and efficacy of drugs in order to preserve the health of population. It has an open source database online28.
Pre-clinical And Clinical Trials knowledge base on bioavailability (PACT-F) is a database structure-based and consists of the results of human clinical trials and pre-clinical animal tests. PACT-F exists since 2005 and is currently the largest bioavailability database in the world and contains approximately 8296 clinical trial registrations. These records are described in detail on-line and contain the chemical structure of the various compounds, thus allowing scientists to relate this structure to bioavailability. PACT-F contains all the important information for the development of predictive models that will allow to study the bioavailability of the new compounds. PACT-F is a database that allows the development of computational models, selection of candidate drugs based on previous assays, exploring the various factors that affect bioavailability, identifying some structural patterns that may influence bioavailability and drug optimization29.
The National Library of Medicine (NLM) TOXNET is a free web repository, managed by the Toxicology and Environmental Health Information Program (TEHIP), which contains a group of databases related to chemicals, pharmaceuticals, general health and also toxicology. This repository can be used to search for chemical nomenclatures, chemicals, chemicals associated
24CML - Chemical Markup Language.Available inwww.ch.ic.ac.uk/rzepa/cml/, accessed last time in
18-11-2016
25THE IUPAC INTERNATIONAL CHEMICAL IDENTIFIER (INCHI).Available in https://iupac.org/
who-we-are/divisions/division-details/inchi/, accessed last time in 18-11-2016
26DSSTox.Available inhttps://datahub.io/dataset/dsstox, accessed last time in 30-11-2016
27DSSTox project.Available inwww.epa.gov/chemical-research/distributed-structure-searchable-toxicity-dsstox-database,
accessed last time in 30-11-2016
28U.S FOOD DRUG ADMINISTRATION.Available inwww.fda.gov/default.htm, accessed last time in
30-11-2016
2.3 Data Mining 15
with diseases, toxic effects of some chemicals for the health of humans or animals, among others. On the web page is available the list of all the databases that constitute TOXNET, with a brief description of each one30.
PharmacoKinetics Knowledge Base (PKKB) is a free web repository that contains a larger database extension with very relevant information concerning ADMET tests. This repository con-tains data from about 1685 drugs covering various test properties, such as, solubility, intestinal absorption, volume of distribution, urinary excretion, among others31.
ADMEdata is a web repository containing data sets obtained from different studies. The com-plete database has 597 compounds and about 9500 data points that allow the creation of predictive ADME models. This repository has available data sets on tests of absorption, distribution and also metabolism32.
Super Toxic is a web repository that contains information about known toxic compounds and uses that information to assess the property of unknown substances. Super Toxic database provides several search options by name and also by properties, such as, molecular weight or measured toxicity values. The use of these data enables the risk assessment of the new products to be minimized and their subsequent toxicity effects33.
Cheminformatics is a web repository that contains links to several chemoinformatics pro-grams as well as several data sets. All data sets are free for academic purposes. This web site contains data sets on the combination of more than one ADMET properties, toxicity, molecules that penetrate BBB, among others34.
Sometimes, repositories only present the names of the molecules and it is necessary to get their structure. ChemSpider is a free chemical structure database that allows structure search access and has many data sources for more than 58 million structures35.
2.3
Data Mining
In recent times, there has been an exponential growth in the information to which people have ac-cess through the Internet [26]. Most of the institutions (public and private), store computer data of their activities, creating large data repositories [27]. Companies have monitored the development of the technologies, and over the years have been collecting and storing a large amount of data continuously. In the 1990s, particular attention was paid to these stored data. It was realized that the data were being underutilized and that it could be an added value for the strategic positioning of the companies. However, the high volume of data stored in disparate structures has quickly
30TOXNET.Available inwww.nlm.nih.gov/pubs/factsheets/toxnetfs.html, accessed last time in
30-11-2016
31PharmacoKinetics Knowledge Base.Available inhttp://cadd.suda.edu.cn/admet/v, accessed last time
in 15-01-2017
32ADMEdata.Available inwww.admedata.com/, accessed last time in 15-01-2017
33Super Toxic project.Available in http://bioinf-services.charite.de/supertoxic/index.php?
site=home, accessed last time in 15-01-2017
34Cheminformatics.Available inhttp://cheminformatics.org/, accessed last time in 15-01-2017 35ChemSpider.Available inwww.chemspider.com/, accessed last time in 21-01-2017
16 State of art
become overwhelming. Thus, the need to create databases and database management systems arose [26]. Today, society is commonly referred to as being in the "information age". With the great expansion of the use of new technologies, the markets demand professionals to be prepared for this evolution. So, there has been an increase in tools to organize and manage all the data, allowing the discovery of information in databases which apparently did not exist or were hidden [28]. Due to the great need for data analysis tools without limitations, researchers resort to ideas and methods developed in Machine Learning36. This search for new ideas led to the emergence of a new area of research, Knowledge Discovery in Databases (KDD), currently also known as Data Mining (DM) [3,26].
Often, the concepts of DM and KDD are used as synonyms. Knowledge Discovery in Databases (KDD) is a non-trivial process of identifying, validating and recognizing data patterns that may provide valid information by generating useful and unexplored knowledge about a specific database. This process describes the extraction of knowledge from the data and generally consists of a set of various steps such as data cleansing, data integration, data selection, data transformation, data mining, evaluation of standards and finally, the evaluation of knowledge, as it is possible to see in Figure 2.5. Data Mining is a step of the KDD process, and is at the heart of the process of knowledge exploration. It is at this stage that the techniques and algorithms that will be used in the problem are applied, in order to extract data models [29].
Figure 2.5: An overview of the steps that compose the KDD process. Extracted from [3].
Data Mining aim to extract useful regularities from long data archives in two possible ways, directly in the form of "knowledge" - characterizing the relations of the variables of interest, or indirectly - as functions that allow prediction, classification or representation of the regularities, in the distribution of the data [26]. Data Mining in hospital databases and public health information systems makes it possible to discover relationships so that a prediction of future trends can be made, allowing a better characterization of the patient. However, some health professionals have difficulty understanding the data. This can probably happen due to the high rate at which data is generated, which leads to an inability of the human being to extract and interpret this data [27].
2.3 Data Mining 17
Data Mining is one of the most promising technologies today [30]. It aims to find hidden rela-tionships between data to allow predictions for the future. It is a process of extracting useful data from large volume databases, which means, it consists of the discovery of interesting knowledge, such as patterns, associations or anomalies [26].
Data Mining is considered as an extension of the traditional method of data analysis, since it consists of several analytical techniques. DM is used in many areas, from the most traditional to the most modern, due to the ease and speed of access to the data and the information needed. It has applications in the field of marketing, science, medicine, telecommunications, financial data analysis, retail industry, Adaptive Business Intelligence (ABI) among others. Thus, this may be the solution to the data analysis problems that many organizations face daily. However, this technology is still very recent, and so it is necessary to research to make it more efficient [31].
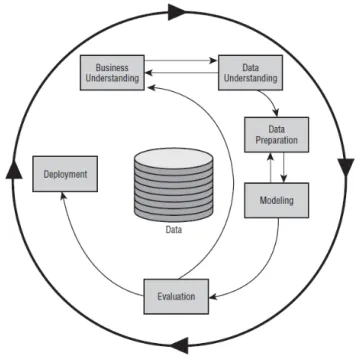
There are several processes that define and standardize the different phases and activities of Data Mining. The CRISP-DM (Cross-Industry Standard Process of Data Mining) [32] is the most used model due to the high information available in the literature and because it is currently con-sidered the most accepted standard [30]. This is divided into 6 cyclic steps and the flow is not unidirectional as can be seen in Figure2.6.
The phases of CRISP-DM are:
1. Business understanding - this step is important for understanding the different organizations that can use Data Mining, thus helping the next steps.
2. Data understanding - it is necessary to know the source from which the data came from, who collected them, what they mean, etc. Thus, once the objectives are defined, knowledge of the data is necessary.
3. Data preparation - data comes in various forms and formats. Due to the different possible sources, it is likely that the data is not prepared for the application of Data Mining methods. Data preparation can involve a number of activities, depending on the quality of the data. 4. Modelling - a model, in the area of Data Mining, is a computerized representation of real
observations. In this step DM algorithms are applied based on the intended objectives. 5. Assessment - this is considered the critical stage of the Data Mining process. It is necessary
the participation of experts and knowing of the business to do the evaluation. This phase is specific to help determine if the model is valuable and what can be done with it. To test the reliability of the models, some tests and validations must be performed. Indicators should also be obtained to assist in the analysis of results, such as confusion matrix, correction index, kappa statistic, mean absolute error, precision, F-measure, among others.
6. Deployment - in this step there is a need to organize and present knowledge in a way that the client can use. It involves several steps such as planning, monitoring and maintaining the
18 State of art
plan, producing the last report and reviewing the project. Usually, these steps are performed by the client37[30,33].
Figure 2.6: Phases of CRISP-DM process. Extracted from37.
Data Mining tasks
Generally, Data Mining is classified according to its ability to perform different tasks [30]. These tasks are very distinct as there are many types of patterns in a massive database. Thus, different methods and techniques are needed to meet different types of patterns.
Depending on the patterns we are looking for, Data Mining tasks can be classified into classi-fication, association rules discovery, clustering, outlier detection and regression [30,34,35].
Classification
Classification is one of the most common tasks and its final objective is to identify which class a particular record belongs to (through the analysis of previous records) [30]. It is a supervised learning method, that is, it uses sets that were previously classified to predict the classification of the new observation [36].
Classification defines a set of models that can be used to classify new objects. The models are constructed from a pre-analysis of the data set of a sample that possess objects classified in a correct form. These models can be represented in several forms, such as, Decision Trees, Random
37CRISP-DM.Available inwww.explore-thinking.com/bring-order-into-the-social-media-monitoring-process/,
2.3 Data Mining 19
Forest, Naivy Bayes, rule-based, k-Nearest Neighbors (k-NN), Support Vector Machine (SVM), among others [27,30,31,34,37].
Classification algorithms
Decision Trees: works as a tree-shaped flowchart, that is, it has the shape of an inverted tree that has its root at the top and is divided successively into several branches. The input attributes are represented by the inner nodes of the tree and each branch represents a possible result for this test. The lower nodes are called sheet nodes and represent the classes that the algorithm is attempting to predict38.
This method is quite simple to interpret, it does not require configuration parameters, it also does not require much data preparation and it can deal with missing values. As disadvantage, this algorithm can originate super-complex trees, causing overtting.
All decision tree algorithms follow a set of steps: - Selection of an attribute A in order to divide; - Subdivision of attribute A in disjoint subsets;
- A tree is returned with attribute A as a root and with a set of branches on the lower level. Each branch will have a descending sub-tree;
There are several algorithms designed for the construction of decision trees: ID3,C4.5,CART and CHAID. Different algorithms are distinguished by the criterion that decides which next node to be explored and the type of test performed at each node inside the tree [35,38]. In the classification experiments performed it was used the CART algorithm.
For the CART algorithm, the selection criterion used to choose the A node to be explored is Gini Index or Gini impurity metric. The node having the least impurity is chosen and the impurity is calculated by the formula:
GiniIndex( f ) =
J
∑
i=1
f i(1 − f i) (2.1)
where, J represents the number of classes and fi corresponds to the fraction of items labeled with class i.
As a general rule, the decision tree algorithm ends its recursion when all data examples have the same label value. However, there are also other conditions that may lead recursion to end: when there are less than a number of instances or examples in the current sub tree (this problem can be adjusted through the parameter "minimum size for split"), when no attribute achieves a given minimum gain, relative to the existing tree before that division (a
38Classification And Regression Trees for Machine Learning, by Jason
Brownlee, 2016. Available in http://machinelearningmastery.com/
20 State of art
solution for this problem can be set via the "minimal gain parameter"), and lastly, when the maximum depth is reached (this can be adjusted through the "maximal depth parameter") [35,38].
Random Forest: corresponds to a large number of decision trees. Each observation is fed into each decision tree. The number of decision trees generated is specied by the programmer. The resulting model is a voting model among all the generated decision trees. For exam-ple, a certain attribute "x" belongs to class "1" if was predicted by most trees generated as belonging to class "1" [35].
Each decision tree is generated in the same way as the decision trees specified in the previous algorithm. The only difference is that for each division, random forest selects the node from a random set of nodes, instead of being selected from among all available nodes to be branched (decision trees algorithm)39.
Naive Bayes: is an algorithm based on the Bayes’ theorem. This is a supervised learning algo-rithm that assumes that the presence (or absence) of a given attribute is not related to the presence (or absence) of any other attribute40, [39].
Given a role = label ’C’ attribute of classes c1, c2, ..., cn and an attribute vector ’a’ cor-responding to all other attributes, the conditional probability of a class ci can be defined as:
P(C = ci|a) = P(C = ci) ∗ P(a|C = ci)
P(a) (2.2)
Rule-based classification: has the structure -if- condition -then- conclusion and is sometimes retrieved from a decision tree [27,40]
k-NN: corresponds to a test of structural similarity between test and training objects. The lower the distance, the more similar these compounds will be. This technique uses a space rep-resentation of instances in order to classify different instances of unknown classes. More specifically, k-NN has its training elements in space, each associated with the class to which it belongs. In order to classify the test elements, it is necessary to verify the votes of the nearest neighbors, and the new element is classified by the most frequent answers. If k = 1, the element is classified with the class corresponding to its nearest neighbor (and so on for the various values of k) [35].
39Random Forests Algorithm, Michael Walker, 2013. Available in www.datasciencecentral.com/
profiles/blogs/random-forests-algorithm, accessed last time in 21-05-2017
40Naive Bayesian, Dr. Saed Sayad. Available inwww.saedsayad.com/naive_bayesian.htm, accessed last
2.3 Data Mining 21
SVM: is a relatively recent technique but has been widely recognized for its results. This is a supervised machine learning algorithm that is used both in classication and regression 41. Given a set of training examples, each marked as belonging to one of two classes, the SVM algorithm constructs a model that represents a number of examples with points in space. These points are mapped so that the examples in each category are divided by a straight line. Examples that belong to different classes should be represented as far as possible. The new examples, present in the test file, are then mapped in the same space and predicted as belonging to one of the two classes, according to the side of the line in which they are placed. When data are not linearly separated, it is necessary for the SVM algorithm to resort to the kernel function.
SVM’s main problem is the time it takes to train a model [22], [30].
Association rules discovery
Association rules discovery is a task responsible for most of the solutions that are used for pattern discovery. The algorithms of association rules discovery aim to discover rules to quantify the correlation between two or more attributes, thus allowing the understanding of the new models. This correlation is commonly referred to as the association rule. This association rule reveals whether the appearance of a set of objects in a database, is closely related to the appearance of another set [27,29]
Clustering
Clustering is a task that does not depend on the existence of pre-sorted data. Therefore, this is an unsupervised learning technique that learns from observation and not from examples. A successful cluster produces high-quality clusters to ensure that objects within a cluster are very similar to each other, but very different from objects in other clusters. Once clusters are formed, the objects are labelled and their common characteristics are summarized to form the class description. This task is similar to classification, with the difference that in the classification, classes are pre-defined and in clustering, classes are dynamically created based on the similarity between the elements. Clustering can be used in several areas, such as, image processing, data analysis, pattern recognition, among others. This task has some algorithms, the most common are Means and k-Medoids [30,31,37,40,41].
Clustering algorithms
K-Means: is a method in which, in a data set, the algorithm selects randomly k records, each representing a cluster. Then, for each record that remains, the similarity between it and the
41Understanding Support Vector Machine algorithm from examples (along with code),
by SUNIL RAY , 2015. Available in www.analyticsvidhya.com/blog/2015/10/ understaing-support-vector-machine-example-code/, accessed last time in 21-05-2017
22 State of art
center of each cluster is calculated, and the object is placed in the cluster that has the greatest similarity.
k-Medoids: is an algorithm that appears as a variation of the previous method. The main differ-ence is that in this technique, instead of calculating the center of the cluster and to use it as reference, the most central object of the cluster is used.
Partitioning and hierarchical methods generate clusters that are usually spherical. However, in some cases this distribution may be denser and the results are not the most satisfactory. Thus, density-based methods are emerging and allow for better results . Given an aleatory set of points in space, it groups together points with many nearby neighbors, marking as outliers the points that lie alone in low-density regions (whose nearest neighbors are too far away). An example of an algorithm of this type is Density-Based Spatial Clustering of Applications with Noise (DBSCAN) [30].
Outliers
Outliers are exceptions (data elements) that cannot be grouped into classes or clusters. Although they may be considered as noise and discarded in some applications, in others may bring important information and their analysis is quite significant [30,31].
Regression
Regression is a supervised learning task, often compared to classification (classification groups finite sets of discrete values and regression predicts continuous values). It is also used to find out which independent variables are related to the dependent variable, and to understand this relationship. Thus, regression consists in estimating the value of a given variable, by analyzing other attribute values in the same item. The model obtained by regression can be represented in the form of linear regression, logistic regression, among others [30,31,42]..
Regression algorithm
Linear regression: is used to estimate a relationship between two variables through the math-ematical formula: Y = mX + b. For example, in a graph with a Y and an X axis, the relationship between X and Y is a straight line [30,31,42].
Other algorithms: some of classification algorithms, such as Decision Trees, Random Forest, SVM and k-NN, are also regression algorithms.
Data Mining tools
In order to facilitate the process of Data Mining, several useful tools have been developed. The most popular ones are described throughout this section.
2.3 Data Mining 23
Waikato Environment for Knowledge Analysis (WEKA): is a set of machine learning al-gorithms for DM that was implemented in 1997 in New Zealand. It is a very popular open source tool developed in Java (which allows it to be used on several platforms). This software provides the necessary functionality to perform various tasks such as association rules discovery, regression, clustering and has several algorithms inside each task42,43. The WEKA system has a simple graphical interface and its biggest advantage is the fact that it allows comparing the performance of different techniques, verifying which one has the lower error rate [30,43,44,45].
KNIME: is a tool that allows doing the analysis of patterns, predicting potential results in the data and also discovering trends. This software is free and its graphical interface allows the user to gather several nodes to perform the pre-processing, modelling, analysis and visualization of data44, [46].
RapidMiner: is an open source tool that was developed in 2001. This platform provides an integrated environment for machine learning, DM, between other areas. RapidMiner has algorithms to construct models for predictive analysis and also enables the graphical visu-alization of the results. This tool has the advantage of allowing that complex analyzes and resulting forecasts can be integrated directly into the customer’s infrastructure, and also has the advantage that it is rarely necessary to write codes, which makes it a very intuitive tool [47].
R tool: in addition to being a scripting language, is also an integrated development environment for statistical and graphical use. This is widely used for data analysis and provides a wide range of statistical and graphical techniques (such as linear and nonlinear modeling, classi-fication, clustering, among others). An important feature of this tool is the ease with which mathematical symbols and formulas can be manipulated whenever necessary. However, it has the disadvantage of its unfriendly interface45.
Evaluation metrics: classification
Before using a model, it is necessary to evaluate it by testing its behaviour with real data and then doing its validation using good evaluation practices. For this, different metrics have been proposed, each of which evaluates different characteristics of the data classifier [4,48]. The main characteristic of a classification system is that it can predict which class an object belongs to,
42"Mineração de dados com WEKA, Parte 1: Introdução e regressão".Available in www.ibm.com/
developerworks/br/opensource/library/os-weka1/, accessed last time in 25-10-2016
43Weka 3: Data Mining Software in Java.Available inwww.cs.waikato.ac.nz/ml/weka/, accessed last time
in 25-10-2016
44Examining the KNIME open source data analytics platform.Available in http://
searchbusinessanalytics.techtarget.com/feature/Examining-the-KNIME-open-source-data-analytics-platform, accessed last time in 25-10-2016
![Figure 2.3: Five transport routes through BBB. Extracted from [2].](https://thumb-eu.123doks.com/thumbv2/123dok_br/15581286.1049271/32.892.216.638.144.409/figure-transport-routes-bbb-extracted.webp)
![Figure 2.5: An overview of the steps that compose the KDD process. Extracted from [3].](https://thumb-eu.123doks.com/thumbv2/123dok_br/15581286.1049271/38.892.145.721.607.822/figure-overview-steps-compose-kdd-process-extracted.webp)