A Work Project presented as part of the requirements for the Award of a master’s degree in Economics from the Nova School of Business and Economics.
INTERGENERATIONAL MOBILITY BELIEFS AND PREFERENCES FOR REDISTRIBUTION IN PORTUGAL
MARIANA DE ARAÚJO SARAIVA ESTEVES 34623
Work project carried out under the supervision of: Ana Fontoura Gouveia
1 INTERGENERATIONAL MOBILITY BELIEFS AND PREFERENCES FOR
REDISTRIBUTION IN PORTUGAL1
Abstract
We conduct a randomized control trial to understand how beliefs about intergenerational mobility affect the attitude towards redistribution in Portugal and how information shapes those beliefs and preferences. When compared with France, Italy, Sweden, the United Kingdom, and the United States, Portugal has higher concerns about inequality and supports more redistribution. Information about low mobility decreases the perceived chances of getting out of poverty but does not change preferences for redistribution. Contrarily to other countries, beliefs of mobility to the top are not sensitive to this information. When compared with true mobility, Portuguese are more pessimistic than Americans and Europeans.
Keywords: Preferences for Redistribution, Intergenerational Mobility, Information, Randomized Control Trial.
This work used infrastructure and resources funded by Fundação para a Ciência e a Tecnologia (UID/ECO/00124/2013, UID/ECO/00124/2019 and Social Sciences DataLab, Project 22209), POR Lisboa (LISBOA-01-0145-FEDER-007722 and Social Sciences DataLab, Project 22209) and POR Norte (Social Sciences DataLab, Project 22209).
1I am extremely thankful to Professor Ana Fontoura Gouveia for her close guidance and encouragement throughout the entire process; to José Pedro Sousa and Rui Maciel for all the discussions and camaraderie; and to my family for the unconditional support.
1. Introduction
In the eighteenth century, Adam Smith alerted for the consequences of inequality for social and political life (Rasmussen, 2016). The relevance of this topic grew in the twentieth century, as a consequence of the Great Depression (1929-1933) and the subsequent crisis. Today, the increasing concentration of income at the top 1 percent of the income distribution is considered by many as “the major social issue of our time” and a reflection of the inability of public policies to provide equality of opportunity and equality of income (Stiglitz, 2013; Piketty, 2014).
Income differences across the distribution are sharp around the world and Portugal is no exception. In 2018, the individuals in the bottom 20 percent of the disposable income distribution in Portugal accounted for less than 8 percent of total disposable income, while the 20 percent richest hold more than 40 percent (Eurostat, 2018). It is thus clear that there is inequality of income. But do people consider it a problem? If so, do they support the implementation of more redistributive policies? According to Eurobarometer (2018), compared with the European Union (EU) average, Portuguese put a higher way on the role of “being lucky”, “coming from a wealthy family” and “having political connections” to get ahead in life. Portugal appears as a country particularly skeptical of the “American Dream” - the idea that with effort and hard work everyone can make it to the top. Interestingly, while Portugal is the EU country with fewer people placing themselves in the upper quintile (20 percent richest) -
only 3 percent compared with 9 percent EU average - it is also above average on perceptions of upward mobility vis-à-vis their parents.2 Regarding inequality perceptions, in Portugal it is almost consensual that current differences in people’s income are too large - 96 percent of the
2 France, Finland and UK respondents have low perspectives of upward intergenerational mobility but place parents in a higher position of the social ladder. Portuguese respondents, on the other hand, place parents in the lowest position of the ladder. This suggests that individual expectations of upward mobility in Portugal are a result of it being a poor country in the EU context, in which there is still room for improvement between generations.
3 respondents agree. Additionally, 94 percent of the respondents believe the government should act to reduce these differences.
Perceptions of rising inequality have been motivating the debate about the demand for redistribution. Early political economy models from Meltzer and Richard (1981) found a positive relationship between current income inequality and demand for redistributive policies. According to these authors, the poor should be the main advocates of redistribution. Cruces et al. (2013) prove that overestimating the relative position, i.e. to consider oneself richer than she is, leads to a decrease in demand for redistribution. Piketty (1995) notes that, if individuals do not know their true chances of moving up the social ladder and since learning this is costly, demand for redistribution depends vastly on social mobility beliefs, rooted in previous generations’ income mobility experience, as well as personal experience. Moreover, the macroeconomic environment affects preferences for redistribution. Giuliano and Spilimbergo (2014), using data from 1972 to 2010 for 37 countries, show that individuals who experience a recession are more risk-averse, less confidence on upward mobility, tend to believe that success depends more on luck than effort and support more redistribution.
In sum, social mobility beliefs can be shaped by many factors, which in turn are key to understand demand for redistribution. But how do these beliefs about mobility affect redistributive preferences across countries? And can information play a role in shaping those beliefs and preferences? We aim to study how social mobility is perceived in Portugal, how that affects preferences for redistribution and compare it with the results found for European countries and the US. We conduct a randomized controlled trial (RCT), following the methodology used by Alesina et. al (2018) and making use of our identification strategy, we test whether providing information about low mobility changes preferences for redistribution. We believe our questions are key to public policy since the degree of responsiveness of fiscal
and tax policies to voters’ redistributive preferences has been proven to be very high. Page and Shapiro (1983), using public opinion and policy data for the US, from 1935 to 1979, show evidence that policymakers react vastly to public opinion. Also, Soroka and Wlezien (2005), using data from the UK, show that public spending is positively correlated with public opinion’s demand for spending.
Our key findings are as follows. By comparing our results to those of Alesina et al. (2018) for France, Italy, Sweden, the United Kingdom (UK) and the US, we show that Portuguese are more confident on the chances of getting out of poverty but more skeptical of the odds of getting rich. These perceptions vary based on individual characteristics, such as education, household income, and political orientation. Portuguese have higher concerns about inequality of opportunities, believe that the government has the ability and the tools to mitigate them and displays higher support for redistributive policies. Information about low intergenerational mobility impacts the perceived chances of getting out of poverty but has no impact on redistributive preferences. Contrarily to what happens in the other countries, beliefs regarding mobility to the top are not sensitive to this information. Finally, when comparing mobility beliefs with true mobility, Portuguese are not only less confident on upward mobility (to the upper quintiles) than Americans, but also more pessimistic than Europeans.
The remainder of the paper is organized as follows. Section 2 explains the survey methodology and presents our data. Section 3 displays the results and is divided into four subsections: Subsection 3.1 compares social mobility perceptions, policy preferences and views on government between Portugal, other EU countries and the US; Subsection 3.2 shows the heterogeneity of mobility perceptions in Portugal; Subsection 3.3 presents the link between mobility perceptions and demand for redistribution in Portugal; and Subsection 3.4 reports the experiment results. Section 4 compares the perceived and the actual social mobility and, finally,
5 Section 5 concludes, presents the implications for public policy and discusses avenues for future research.
2. Empirical Assessment
2.1 The Method
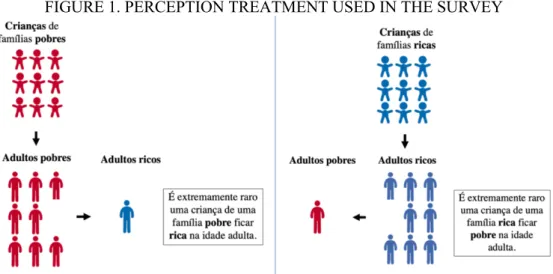
Our study builds on the work by Alesina et.al (2018), which methodology we follow closely to render the comparison meaningful. To understand the role of information on shaping mobility beliefs and how they affect preferences for redistribution, we conduct a survey 3 with five blocks of questions. The first block relates to views on the fairness of the Portuguese economic system, the second looks at personal mobility experience, the third assesses respondents’ views on political institutions, the fourth inquires beliefs on mobility and support for redistributive policy preferences and the fifth collects respondents’ demographic characteristics. Before the fourth block, we build a randomized control trial (RTC), in which half of the sample is randomly presented with an image with information about low intergenerational (upward and downward) mobility in Portugal. The treatment’s goal is to evaluate the impact of information on low mobility on preferences for redistribution. For comparison purposes, the treatment had to be homogenous across countries, hence the same information shown to all respondents from Alesina et al. (2018) is shown to our Portuguese respondents. For this reason, the treatment does not provide exact statistics of actual mobility in Portugal, but only qualitative statements about the low probability of a child born in a poor family becoming rich and a child born in a rich family becoming poor. Figure 1 presents the image seen by the treatment group.
3 The full survey is available in Appendix B and online at
FIGURE 1. PERCEPTION TREATMENT USED IN THE SURVEY
To evaluate the treatment effects, we follow a two-stage method. First, to isolate the effect of the treatment on the mobility perceptions, we regress these perceptions on the treatment, controlling for a vector of individual-level characteristics (𝑋")4. Then, we regress the first-stage treatment effects on various redistributive policies, described in Table 1. Our first-stage regression in equation (1) and our reduced-form outcome regression in equation (2) are both estimated using Ordinary Least Squares (OLS) with robust standard errors.
𝑀𝑜𝑏𝑖𝑙𝑖𝑡𝑦 𝑃𝑟𝑜𝑏𝑎𝑏𝑖𝑙𝑖𝑡𝑦" = 𝑐 + 𝛽2 𝑇𝑟𝑒𝑎𝑡𝑚𝑒𝑛𝑡" + 𝛽7𝑋" + 𝜇" 𝑅𝑒𝑑𝑖𝑠𝑡𝑟𝑖𝑏𝑢𝑡𝑖𝑣𝑒 𝑃𝑜𝑙𝑖𝑐𝑦" = 𝑐 + 𝛾2 𝑀𝑜𝑏𝑖𝑙𝑖𝑡𝑦 𝑃𝑟𝑜𝑏𝑎𝑏𝑖𝑙𝑖𝑡𝑦" + 𝛾7 𝑋"+ 𝜖"
TABLE 1. LIST OF VARIABLES
Mobility Probability
Stay Poor The perceived probability of a child born in the first quintile remaining in the first quintile. Improve The perceived probability of a child born in the first quintile moving to the second or third quintile. Get Rich The perceived probability of a child born in the first quintile moving to the
fourth or fifth quintile.
(Continued)
4 𝑋
" is composed by the following variables: gender (female), age less than 45 (young), being in the top quartile of the income distribution (rich), having a college degree (college), political orientation (left/right) and having a job with a status higher than father (move up). Table 2 provides more information on these variables.
Notes: In the left-hand side respondents are informed that it is extremely rare for a child born in a poor family
to become rich later in life. On the right-hand side, the figure says that it is extremely rare for a child born in a rich family to become poor later in life.
(1) (2)
7 TABLE 1. LIST OF VARIABLES (Continued)
Redistributive Policy
Tax Rate Top 1 The average tax rate respondents consider fair for the families of the richest 1 percent.
Tax Rate Bottom 50 The average tax rate respondents consider fair for the families of the poorest 50 percent.
Share Taxes Top 1 Taxation burden supported by the top 1 percent. Share Taxes Bottom 50 Taxation burden supported by the bottom 50 percent.
Budget opp. 1 if the respondent preferred spending on opportunities (education and health care), as a share of the total government budget, it is above percentile 75th. Budget Safety Net 1 if the respondent preferred spending on safety net (social security), as a
share of the total government budget, it is above percentile 50th. Support AIMI 1 if the respondent strongly agrees with the capital tax.
Support equality opp. policies
1 if the respondent agrees or strongly agrees with the implementation of more policies promoting equality of opportunities.
Unequal opp. very serious problem
1 if the respondent believes that children from poor and rich backgrounds having unequal opportunities in life are “a serious problem”.
Views on Government
Trust Gov 1 if the respondent says that the government can be trusted to do what is right “most of the time” or “always”. Gov Tools 1 if the respondent thinks that the government has the ability and the tools to do “some” or “a lot” to reduce inequality of opportunities.
Lowering Taxes Better
1 if the respondent thinks that “lowering taxes on wealthy people and corporations to encourage more investment in economic growth” is better than “raising taxes (...) to expand programs for the poor” to reduce inequality of opportunities.
Negative View Gov
1 if the respondent answers that he/she can “never” trust the government, or that to reduce the inequality of opportunities between children born in poor and rich families the government has the ability and the tools to do “nothing at all” or “not much,” or that “lowering taxes on wealthy people and corporations to encourage more investment in economic growth” would be the better way to equalize opportunities.
Questions about policy preferences are divided into two groups: taxes and budget spending. In the former, to evaluate the desired progressivity of the tax system, we ask respondents to choose the average income rates they believe to be fair for each of four income groups: the top 1 percent, the next 9 percent, the next 40 percent and the bottom 50 percent. To assess people’s preferences for capital taxes, we ask them to rate their support for the Additional to the
Municipal Property Tax5 (AIMI, in Portuguese, popularly known as “Imposto Mortágua”6), instead of the estate tax used by Alesina at al. (2018). The AIMI is a property tax, paid only by the owners of very high-value properties, and, in 2018, only a small percentage of house owners paid this tax7. Respondents are warned about this in advance. Regarding fiscal policy, respondents are asked to do their state budget, i.e., to allocate a percentage of the budget to five spending categories: Defense and National Security, Public Infrastructure, Public Spending on Education, Social Security, and Public Spending on Health.
2.2. The Data
The survey was developed in Qualtrics, a software platform to conduct survey research. It was disclosed and shared over social media, for three weeks, from September 15th, 2019 until October 4th, 2019, with a total sample size of 1066. The median time of completion was 13 minutes and observations with less than 5 minutes were dropped.8
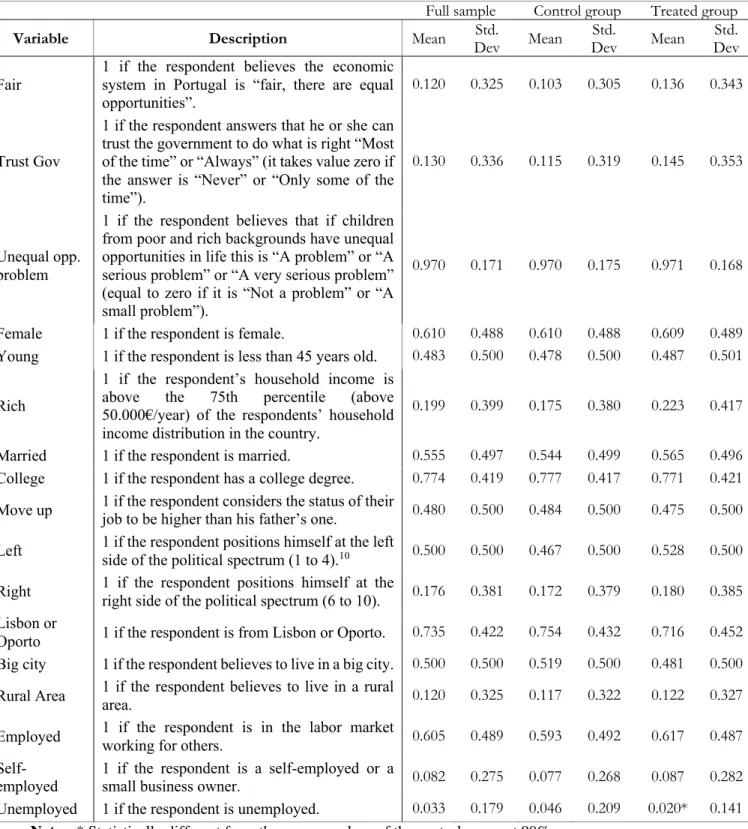
From the analysis of Table 2, we can see that there are no significant differences between the treated and the control groups. Unemployed respondents are more likely to quit the survey since they are under-represented in the treated group as compared to the control group. However, given that the survey was performed online, and thus only submitted responses are received, we cannot calculate attrition rates. Having said this, considering that differences between the number of respondents in each group are small, and unemployed individuals account for only 3 percent of our sample, we are confident that selection effects do not bias the results.
5 The AIMI is an additional tax to the property tax IMI (“Imposto Municipal sobre Imóveis”). The taxable basis corresponds to the sum of the Tax Registration Value (determined based on the type of property) of all the urban properties held by the taxpayer.
6 To better fit the Portuguese case, the preferences for capital taxes are represented by the property tax that became known in Portugal by the name “Imposto Mortágua”, popularly named after the left-wing deputy from the political party Bloco de Esquerda, Mariana Mortágua, who advocated for it.
7 According to the Portuguese tax authority (Autoridade Tributária e Aduaneira), in 2018, only 6.31 percent of house owners paid the AIMI tax.
9 Our samples provide a good representation of the population, but it is highly biased towards higher income and education (Appendix A.1). Nevertheless, it is aligned with Eurobarometer (2018) data on social mobility. Comparing answers to the question “Nowadays in (our country) I have equal opportunities for getting ahead in life, like everyone else” from Eurobarometer (2018) and our survey question “How do you feel about the following statement: In Portugal, everybody has a chance to make it and be economically successful”, we see that outcomes by education level are similar. In our sample, the agreement rate is composed of 25 percent of individuals with secondary education and 68 percent with higher education, while in the Eurobarometer (2018) data, the agreement rate is 19 percent and 50 percent, respectively9. Moreover, regarding the overrepresentation of rich individuals in the sample, one could be concerned that this may bias the results towards lower tax rates to the richest (Meltzer and Richard, 1981). However, self-interest is not the only driver of policy preferences. Blinder and Krueger (2004), using data for the USA, concluded that ideology is more important to determined policy preferences than self-interest. Singhal (2008), using OECD data, shows that redistributive preferences can be altruistic, and people do not necessarily support lower tax rates at income levels close to theirs. Additionally, Canela and Vicente (2018), using data from post-election polls of preview legislative post-elections, show that, in Portugal, in 2015 post-elections, those from the top quintile of the income distribution voted 20 percentage points more than those from the bottom quintile. Considering preferences are expressed via voting, the unbalance in the sample may be a good representation of the actual voting preferences for redistribution. Nonetheless, we are aware of the external validity limitations of our study.
9 We only consider secondary and higher education since it constitutes 96% of our sample. Since this question is placed after the treatment, we only consider the answers from the control group.
TABLE 2. DESCRIPTIVE STATISTICS
Full sample Control group Treated group
Variable Description Mean Dev Std. Mean Dev Std. Mean Dev Std.
Fair 1 if the respondent believes the economic system in Portugal is “fair, there are equal opportunities”.
0.120 0.325 0.103 0.305 0.136 0.343
Trust Gov
1 if the respondent answers that he or she can trust the government to do what is right “Most of the time” or “Always” (it takes value zero if the answer is “Never” or “Only some of the time”).
0.130 0.336 0.115 0.319 0.145 0.353
Unequal opp. problem
1 if the respondent believes that if children from poor and rich backgrounds have unequal opportunities in life this is “A problem” or “A serious problem” or “A very serious problem” (equal to zero if it is “Not a problem” or “A small problem”).
0.970 0.171 0.970 0.175 0.971 0.168
Female 1 if the respondent is female. 0.610 0.488 0.610 0.488 0.609 0.489 Young 1 if the respondent is less than 45 years old. 0.483 0.500 0.478 0.500 0.487 0.501 Rich
1 if the respondent’s household income is above the 75th percentile (above 50.000€/year) of the respondents’ household income distribution in the country.
0.199 0.399 0.175 0.380 0.223 0.417 Married 1 if the respondent is married. 0.555 0.497 0.544 0.499 0.565 0.496 College 1 if the respondent has a college degree. 0.774 0.419 0.777 0.417 0.771 0.421 Move up 1 if the respondent considers the status of their job to be higher than his father’s one. 0.480 0.500 0.484 0.500 0.475 0.500 Left 1 if the respondent positions himself at the left side of the political spectrum (1 to 4).10 0.500 0.500 0.467 0.500 0.528 0.500 Right 1 if the respondent positions himself at the right side of the political spectrum (6 to 10). 0.176 0.381 0.172 0.379 0.180 0.385 Lisbon or
Oporto 1 if the respondent is from Lisbon or Oporto. 0.735 0.422 0.754 0.432 0.716 0.452 Big city 1 if the respondent believes to live in a big city. 0.500 0.500 0.519 0.500 0.481 0.500 Rural Area 1 if the respondent believes to live in a rural area. 0.120 0.325 0.117 0.322 0.122 0.327 Employed 1 if the respondent is in the labor market working for others. 0.605 0.489 0.593 0.492 0.617 0.487
Self-employed 1 if the respondent is a self-employed or a small business owner. 0.082 0.275 0.077 0.268 0.087 0.282 Unemployed 1 if the respondent is unemployed. 0.033 0.179 0.046 0.209 0.020* 0.141
Notes: * Statistically different from the average values of the control group at 90%
10 As commonly used in European Social Survey (ESS)’s questionnaires, the political spectrum is defined on a scale of 1 to 10, where 1 represents the most left-wing position and 10 the most right-wing position.
11 3. The Results
This section is divided into four subsections organized as follows. First, we focus on a cross-country analysis between Portugal, France, Italy, Sweden, the UK and the US regarding mobility perceptions, government views, public spending, and taxes. Second, focusing on our novel data on Portugal, we analyze how individual characteristics relate to mobility beliefs. Third, we explore the link between mobility beliefs and attitudes towards redistribution and, finally, we present the experiment that aims to study if this link is a result of a casual effect.
3.1. Portugal, the most European of All
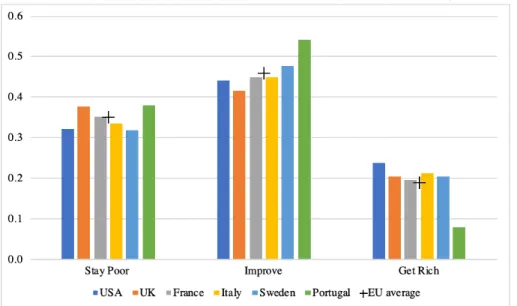
We learn from Alesina et al. (2018) that Europeans display higher skepticism regarding social mobility than Americans. Our data shows that, in Portugal, confidence in the chances of upward mobility to the upper quintiles is even lower than the average of the EU countries (Figure 2). Overall, these results are aligned with Eurobarometer (2018), in which Portuguese respondents are 38 percent less likely than the EU average to agree with the statement “Nowadays I have equal opportunities for getting ahead in life, like everyone else”.
Interestingly, in our data, Portugal is more confident about the chances of getting out of poverty. Respondents believe that, for those born in a poor household, getting rich is unlikely, but there is room for improvement to the so-called “lower middle class” and “middle class” (second and third quintiles). According to Eurobarometer (2018), countries such as France, Finland, and the UK, in which respondents place parents in a higher position of the social ladder are also the ones with lowest perspectives of upward intergenerational mobility. On the other hand, Portuguese respondents display higher confidence in going farther than their parents, while placing parents in the lowest position of the ladder. This suggests that confidence in improving up the social ladder may be motivated by Portugal being a poor country in the EU context, where there is still room for moving up from generation to generation.
FIGURE 2. INTERGENERATIONAL MOBILITY PERCEPTIONS BY COUNTRY (%)
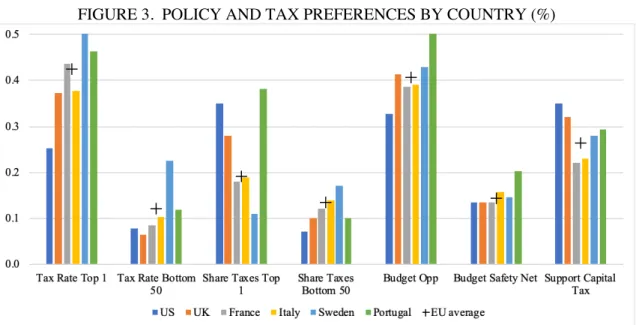
Regarding public spending preferences, Figure 3 shows that Portugal presents high support for spending on education and health (budget opportunities) and on safety net (budget safety net). Regarding taxation, Portuguese respondents support a lighter burden for the bottom 50 percent and heavier for the top 1 percent, ergo, desire for tax system progressivity seems to be higher in Portugal than in the EU average. Support for capital taxation11 is also higher in Portugal than in France, Italy, and Sweden. Overall, Portugal seems to have a higher demand for policies and taxes that promote redistribution. This was an expected result, since, as presented in Section 1, 94 percent of the Eurobarometer (2018) Portuguese respondents want more government intervention. Additionally, Olivera (2013), using the European Social Survey (ESS) data on 33 countries between 2002 and 2010, shows that Portugal is the 5th country with higher preferences for redistribution. In this ranking France appears in 8th place, followed by Italy in 13th, Sweden in 25th and the UK in 31st.
11 Note that to evaluate support for capital taxation, we used a property tax - AIMI - to better fit the Portuguese reality, instead of the estate tax used by Alesina et al. (2018).
Notes: The figure shows, for each country, the perceived probability of each mobility possibility as defined in
Table 1. Only the control group is considered to avoid the influence of treatment effects on mobility perceptions. The “+” represents the average of each variable for the EU countries studied by Alesina et. al (2018). Source: Own computations for Portugal and calculations for USA, UK, France, Italy and Sweden from Alesina et. al (2018).
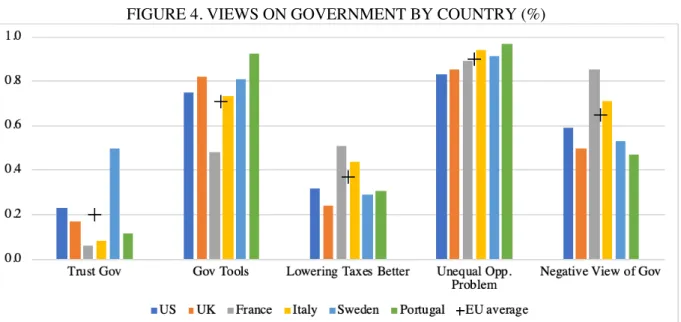
13 Nonetheless, even if individuals have high preferences for redistribution, demand for these policies can be low if people do not trust the government, or do not believe it has the tools to tackle inequality or believe lowering taxes on wealthy people and corporations to encourage investment in economic growth is the most efficient way to mitigate inequality (Kuziemko et al., 2015). Figure 4 shows that Portuguese respondents have lower negative views on government, mainly a result of the high confidence in its capacity and tools (93 percent of respondents agree). Portugal seems to trust the government as much as the other countries, except for Sweden which is an outlier in this matter. Additionally, in Portugal and the US, 31 and 32 percent of the respondents, respectively, believe that “lowering taxes on wealthy people and corporations to encourage more investment in economic growth” is the most efficient way to decrease inequality, rather than by “raising taxes (…) to expand programs for the poor”. Given the starting level of taxes in Portugal is higher than in the US (Alesina and Glaeser, 2006), this does not reflect a desire for a less progressive Portuguese tax system. Overall, Portugal appears as the country in which more individuals see unequal opportunities as a problem, which, in addition to the belief in government’s ability and tools to tackle inequality, may explain the higher support for redistribution in the country.
FIGURE 3. POLICY AND TAX PREFERENCES BY COUNTRY (%)
Notes: The figure shows, for each country, the policy and tax preferences as defined in Table 1. Only the
control group is considered to avoid the influence of treatment effects on policy preferences. The “+” represents the average of each variable for the EU countries studied by Alesina et. al (2018). Source: Own computations for Portugal and calculations for USA, UK, France, Italy and Sweden from Alesina et. al (2018).
FIGURE 4. VIEWS ON GOVERNMENT BY COUNTRY (%)
3.2. Heterogeneity in Mobility Perceptions in Portugal
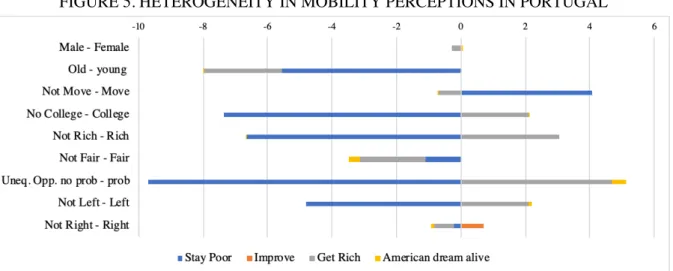
Alesina et al. (2018) show that beliefs on intergenerational mobility vary with individual characteristics. For France, Italy, Sweden, the UK, and the US, left-wing individuals assign a higher probability to stay in the bottom quintile, whereas females, low-income respondents and individuals with higher education are more likely to give a higher probability to move to the top. To understand the heterogeneity of mobility perceptions in Portugal, we compare the mean perceptions of mobility for different individual characteristics. Figure 5 shows that, in Portugal, having a college degree, being rich and being left-wing are characteristic that significantly increase the perceived odds of staying poor and decrease confidence in the chances of getting rich. In line with Alesina et al. (2018), the youth is both less confident in the chances of getting out of poverty and more confident in the probabilities of getting rich. Those who consider their job’s status to be better than the one their fathers had (“move up”), are less likely to believe that a child born in a poor household will remain stuck there. This finding is consistent with Piketty’s (1995) idea that personal mobility experience impacts one’s beliefs on social mobility. On the other hand, considering unequal opportunities a problem significantly increases the
Notes: The figure shows, for each country, average views on government as defined in Table 1. Only the control
group is considered to avoid the influence of treatment effects on views on government. The “+” represents the average of each variable for the EU countries studied by Alesina et. al (2018). Source: Own computations for Portugal and calculations for USA, UK, France, Italy and Sweden from Alesina et. al (2018).
15 perceived chances of staying poor. Regarding attitudes toward the “American Dream”, females, left-wing individuals and those who classify inequality of opportunities as a problem are less likely to believe that social mobility in Portugal is possible for everybody. The opposite is true for right-wing individuals and, as expected, those who believe the Portuguese economic system is fair.
FIGURE 5. HETEROGENEITY IN MOBILITY PERCEPTIONS IN PORTUGAL
3.3. Mobility Perceptions and Preferences for Redistribution in Portugal
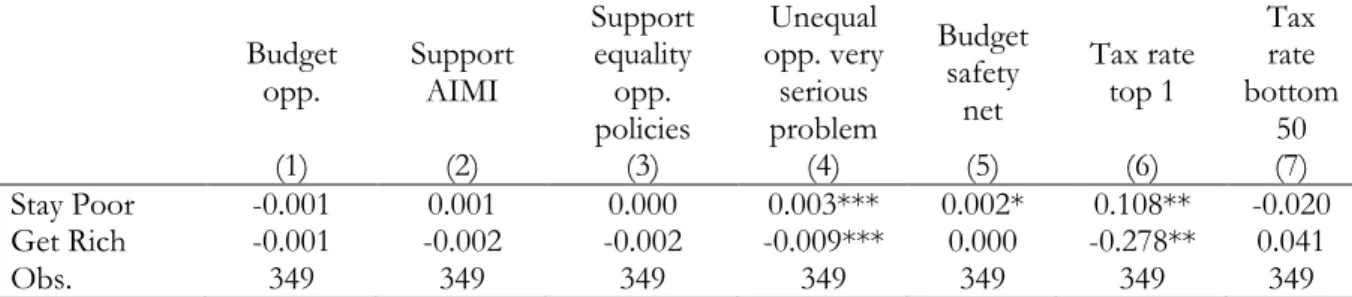
As previously discussed in Section 1, social mobility beliefs are a key determinant of demand for redistributive policies. To analyze whether this link is present in our sample, we regress respondents’ policy preferences on their perceived mobility probabilities, controlling for a vector of individual-level characteristics (Xi), as presented in Subsection 2.1. To avoid capturing the effects of the treatment’s information, we report the regression results only for respondents in the control group. From the analysis of Table 3, we see that assigning high probability to “Stay Poor” increases the perception of inequality of opportunities as a serious problem, while being confident in the odds of “Get Rich” is significantly correlated oppositely. Contrarily to Alesina at al. (2018), we do not find a significant correlation between mobility perceptions and preferences for all redistributive policies under analysis. Nevertheless, there is
Notes: The figure shows the difference of the average perceived probability of “Stay Poor”, “Improve” and “Get
Rich”, as well as the belief in the “American Dream”, for different groups of respondents. The groups are defined as in Table 2. More details in Appendix A.2. Source: Own computations.
a significant correlation for policies that intend to reduce current inequalities through progressive taxation and social transfers to the poorest, namely spending on safety net budget and higher tax rates for the top 1 percent. Overall, these policies seem to be more sensitive to mobility beliefs than policies that aim to create conditions for more even distribution in the future through investment in education and health care (budget opportunities). Note, however, that more or less share of budget spending on a certain category depends on that initial benchmark of each respondent, which is unknown. This may explain why support for equality of opportunities policies is not sensitive to mobility beliefs, contrarily to other countries.
TABLE 3.RELATION BETWEEN PERCEPTIONS ON MOBILITY AND POLICY PREFERENCES
Budget
opp. Support AIMI
Support equality opp. policies Unequal opp. very serious problem Budget safety net Tax rate top 1 Tax rate bottom 50 (1) (2) (3) (4) (5) (6) (7) Stay Poor -0.001 0.001 0.000 0.003*** 0.002* 0.108** -0.020 Get Rich -0.001 -0.002 -0.002 -0.009*** 0.000 -0.278** 0.041 Obs. 349 349 349 349 349 349 349
Notes: The table reports, for the control group, the estimates of regressions of mobility perceptions on the
redistributive policies of each column. The outcome variables are defined as described in Table 1. Controls included in all regressions are the vector of individual-level characteristics (Xi), presented in Subsection 2.1. ***p<0.01, ** p<0.05, * p<0.1. Source: Own calculations.
3.4. The Experiment: Causal Effect of Mobility Beliefs on Policy Preferences The results so far suggest that beliefs about mobility are linked to some policy preferences, namely progressive taxation and social transfers to the poorest, but they do not show that one led to the other. To understand if this is a result of causal relation or just a consequence of individual characteristics, such as views on government, cultural values, ideology or others, we conduct an RCT, as explained in Section 2.
a) First Stage: Treatment Effects on Beliefs
Table 4 shows that the treatment only has a significant effect on changing beliefs of the probability of “Improve” up the social ladder. On average, all else equal, the treated group decreases by 3.54 percentage points the perceived probability of a child born in the bottom
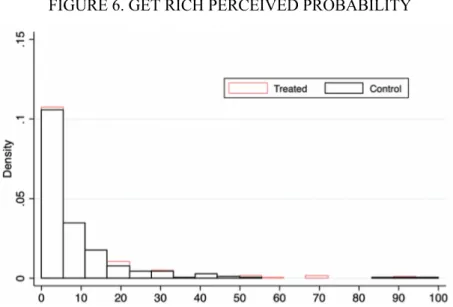
17 quintile moving to the second or third quintile. Even though the treatment does not include information on mobility to the middle of the income distribution, the framing of the message may lead respondents to focus on the nine poor kids who do not move, instead of focusing on the one kid that does. Figure 6 shows that there is no difference between control and treated group regarding the perceived probabilities of “Get Rich” for any moment of the distribution. Respondents seem to either not believe in the information in the treatment or simply ignore it, which then translates into no change in mobility beliefs to the top. Moreover, Table 4 shows that being left- or right-wing does not affect the results, contrarily to Alesina et al.’s (2018) conclusions to other countries.
In sum, information seems to have a significant but small effect on mobility beliefs on the odds of getting out of poverty to the following quintiles but has no impact on the other beliefs. Our results suggest that if politicians cite data on social mobility, they will not convince the Portuguese that mobility is different than they initially thought. One possible explanation for this resistance to information may be the experience of recent adverse events (Giuliano and Spilimbergo, 2014), such as the 2008 financial crisis and subsequent 2010 sovereign debt crisis, which had a particularly strong effect on Portugal in comparison to the remaining countries in the analysis. Olivera (2014), using the European Social Survey (ESS) data on 23 countries in 2008 and 2010, shows that Portugal experienced an increase of more than 5 percent in support of redistribution after the crisis. This adverse experience may have let Portuguese less confident on upward mobility to the top and suspicious of any different information. That been said, further research is needed to understand the rigidity of these beliefs, and how they emerge and reproduce.
TABLE 4. FIRST-STAGE TREATMENT EFFECTS ON MOBILITY PERCEPTIONS Stay Poor Improve Get rich
(1) (2) (3)
Panel A. Mobility perceptions
Treated 2.248 -3.541** 1.036
Panel B. Mobility perceptions for left- and right-wing
Treated x Left 2.134 -1.751 0.386 Treated x Right -0.266 -2.851 3.914 Left 4.654 -2.224 -2.471 Right 1.970 0.119 -2.123 P-values diff. 0.631 0.812 0.190
joint test (Left) 0.899 0.951 0.948
joint test (Right) 0.845 0.926 0.365
Obs. 692 692 692
b) Treatment Effects on Policy Preferences
Table 5 reports the treatment effects on redistributive policy preferences, which shows that, albeit the success of the treatment on altering the perceptions of getting out of poverty, these preferences do not change. As before, being left- or right-wing does not affect the results. To endorse our conclusions, we follow an Instrumental Variable (IV) approach, in which we use
Notes: The table reports first-stage effects on mobility perceptions. Panel A reports the coefficients of the regression
between the treatment and mobility perceptions. Panel B reports the same but with the treatment interacted with political orientation. P-values: diff. is the p-value of the test of equality of the effects among left- and right-wing respondents; joint test (Left) is the p-value of the test of equality of effects among left- and non-left-wing respondents; joint test (Right) is p-value of the test of equality of effects among right- and non-right-wing respondents. The outcome variables are defined as described in Table 1. Controls included in all regressions are the ones of equation (1). ***p<0.01, ** p<0.05, * p<0.1. Source: Own calculations.
Notes: The perceived probability of a child born in the first quintile move to the fourth or fifth quintile later in
life for the treated (red) and the control group (black).
19 the treatment as an instrument for mobility perceptions. Since the first-stage treatment effects are only significant at altering the perceived probability of “Improve”, we use the “Improve” instrumented by a dummy for being in the treatment group as our IV. We can assume that the treatment had no effect on policy preferences except through mobility perceptions since we simply replicated the treatment designed by Alesina et al. (2018), elaborated with the exclusion
restriction12 in mind. Additionally, we test if the treatment has any impact on views of
government and do not detect any significant effect. In any case, following an IV approach does not change the results, which reinforces our conclusions: we do not find evidence of a causal link between policy preferences and perceived odds of “Improve” in Portugal.
Jaime-Castillo and Marques-Perales (2014), using a Spanish sample, show that lower confidence on mobility to the top of the social ladder leads to greater support for redistribution. Nonetheless, in our sample, information is not capable of changing the perceived odds of getting rich, hence nothing can be said about the causal relationship between these perceptions and preferences for redistribution in Portugal. Therefore, from our experiment, we can only conclude that mobility perceptions from the bottom to the “lower middle class” or the “middle class” do not shape preferences for redistribution in Portugal. For all we know, these preferences can be formed by beliefs of mobility to the top or can even be inelastic and not a consequence of misinformation (Kuziemko et al.’s, 2015). Previous literature shows that these preferences can be a result of cultural values (Luttmer and Singhal, 2011), racial stereotypes (Kuklinski et al., 2003), political orientation or views on government (Alesina et al., 2018).
12Respecting the exclusion restriction criteria necessary to conduct an IV estimation, the treatment affects policy preferences but is not correlated with other factors affecting the outcomes.
TABLE 5. TREATMENT EFFECTS ON POLICY PREFERENCES Budget
opp Support AIMI
Support equality opp. policies Unequal opp. very serious problem Budget safety net Tax Rate Top 1 Tax Rate Bottom 50 (1) (2) (3) (4) (5) (6) (7)
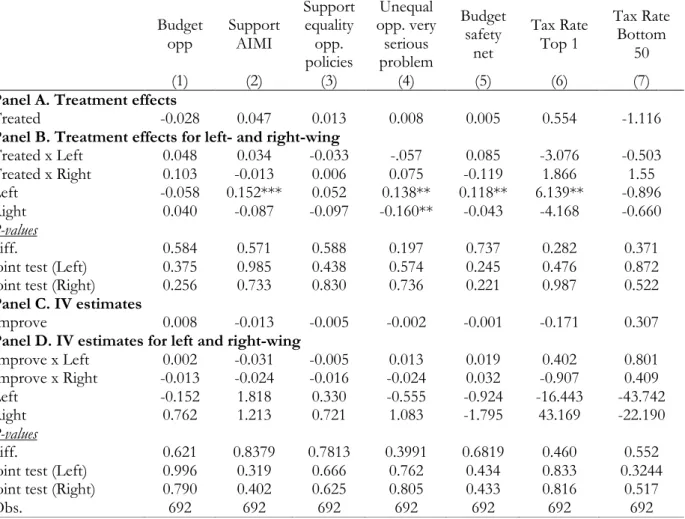
Panel A. Treatment effects
Treated -0.028 0.047 0.013 0.008 0.005 0.554 -1.116
Panel B. Treatment effects for left- and right-wing
Treated x Left 0.048 0.034 -0.033 -.057 0.085 -3.076 -0.503 Treated x Right 0.103 -0.013 0.006 0.075 -0.119 1.866 1.55 Left -0.058 0.152*** 0.052 0.138** 0.118** 6.139** -0.896 Right 0.040 -0.087 -0.097 -0.160** -0.043 -4.168 -0.660 P-values diff. 0.584 0.571 0.588 0.197 0.737 0.282 0.371
joint test (Left) 0.375 0.985 0.438 0.574 0.245 0.476 0.872 joint test (Right) 0.256 0.733 0.830 0.736 0.221 0.987 0.522
Panel C. IV estimates
Improve 0.008 -0.013 -0.005 -0.002 -0.001 -0.171 0.307
Panel D. IV estimates for left and right-wing
Improve x Left 0.002 -0.031 -0.005 0.013 0.019 0.402 0.801 Improve x Right -0.013 -0.024 -0.016 -0.024 0.032 -0.907 0.409 Left -0.152 1.818 0.330 -0.555 -0.924 -16.443 -43.742 Right 0.762 1.213 0.721 1.083 -1.795 43.169 -22.190 P-values diff. 0.621 0.8379 0.7813 0.3991 0.6819 0.460 0.552
joint test (Left) 0.996 0.319 0.666 0.762 0.434 0.833 0.3244 joint test (Right) 0.790 0.402 0.625 0.805 0.433 0.816 0.517
Obs. 692 692 692 692 692 692 692
Notes: This table reports the treatment effect on policy preferences (Panels A and C) and the treatment effects interacted
with political orientation (Panels B and D). Panel C and D scale these effects by regressing the policy listed in the column on the perceived probability of “Improve”, instrumented by a dummy for being in the treatment group. The outcome variables are defined as described in Table 1. Controls included in all regressions are the ones of equation (2). ***p<0.01, ** p<0.05, * p<0.1. Source: Own calculations.
4. (Mis)perceptions: Actual and Perceived Social Mobility
One of our key results is that, in Portugal, confidence in social mobility to the top is not only lower than in the US but also lower than in other European countries. Portuguese respondents believe only 8 kids, out of 100, will reach the upper quintiles, while this number climbs to 20 among other Europeans and 23 for Americans.
To assess if mobility perceptions are accurate, Figures 7, 8 and 9 display the average perceived probability of “Stay Poor”, “Improve” and “Get Rich”, respectively, against the actual mobility in each country13. For Portugal, our data source for actual mobility is the OECD, based on
21 SILC (2011-14). The “children’s sample” is composed of males, and the “parents’ sample” composed by fathers from the first quartile. To our knowledge, this is the best available data for Portugal. However, the OECD data are divided into quartiles, while in our survey data are divided into quintiles. Hence, to make meaningful comparisons, we consider the first, second and third quartile to correspond to our first, second and third quintiles, respectively, and the fourth quartile to correspond to our fourth and fifth quintiles. Regarding the average perceived mobility, we only considered respondents in the control group to eliminate changes in perceptions based on the information provided by the treatment. For the remaining countries, information comes from Alesina et al. (2018).
Three main results stand out. First, there seems to exist systematic misperceptions across countries. European countries are all more pessimistic about the probability of remaining in poverty and less optimistic about getting rich than Americans. This result is presented in Alesina et al. (2018) and it is consistent with previous literature (Tocqueville,1835; Piketty,1995; Alesina and La Ferrera, 2005). Second, Portugal is very pessimistic about the probability of staying stuck in poverty and vastly underestimates the probability of making it to the top. Nonetheless, it is an optimist about the chances of moving from poverty to the second and third quintiles. Third, Portugal is the country in which more children “Stay Poor” and less “Get Rich”. Yet withal, chances of “Improve” are higher in Portugal and, as our survey data proves, respondents are aware of it.
5. Concluding Remarks
This paper aims at understanding how beliefs about intergenerational mobility affect the attitude towards redistribution in Portugal and how information shapes those beliefs and preferences. We conduct a randomized control trial and compare the results for Portugal with those from a similar survey on other countries (Alesina et al., 2018). The analysis is complemented with data from other existing datasets, namely the Eurobarometer (2018) data on “Fairness, Inequality and Intergenerational mobility”, and the OECD data on actual intergenerational mobility in Portugal.
We show that Portuguese are skeptical of mobility to the upper classes (fourth and fifth quintiles) but confident on the chances of moving from poverty to the “lower middle class” and
Notes: Probability of a son being in first quintile (Figure 7), in the second or thrid quintile (Figure 8) and in the
fourth or fifth quintile (Figure 9), conditional on his father being in the same quintile. The dotted line is the 45-degree line. Source: For Portugal, OECD calculations based on EU-SILC (2011-14) for actual mobility and own calculations for average perceived mobility; for the remaining countries, Alesina et al. (2018)
23 “middle class” (second and third quintiles). These perceptions vary based on individual characteristics, such as education, household income, and political orientation. By comparing our results to those of Alesina et al. (2018) for France, Italy, Sweden, the United Kingdom, and the United States, we show that skepticism regarding mobility to the top and confidence on chances of getting out of poverty are higher in Portugal. Moreover, the Portuguese have higher concerns about inequality of opportunities and believe that the government has the ability and the tools to mitigate them. Support for redistributive policies is also higher in Portugal. When mobility perceptions are compared with true mobility, Portuguese are not only more pessimistic than Americans but also more pessimistic than other Europeans.
From our RCT, we conclude that information about low intergenerational mobility impacts perceptions on the chances of getting out of poverty but has no impact on redistributive preferences. Contrarily to what happens in the other countries, Portuguese respondents are not sensitive to the information in the treatment regarding mobility to the top. Therefore, from our experiment, we can only conclude that mobility perceptions from the bottom to the “lower middle class” and “middle class” do not shape preferences for redistribution in Portugal. Nonetheless, nothing can be said about the causal link between mobility perceptions to the top and preferences for redistribution in Portugal. The role of information seems to be significant but small on mobility beliefs about getting out of poverty to the subsequent quintiles but does not affect the other beliefs. Therefore, our results suggest that if politicians cite data on upward social mobility, they will not convince the Portuguese that mobility is different than they thought. We propose that the 2008 financial crisis and subsequent 2010 sovereign debt crisis may have let Portuguese less confident on upward mobility to the top and suspicious of any different information.
Overall, our results must be interpreted with caution. First, high-income and higher-educated individuals are overrepresented in our sample and hence it is not representative of the population. While this has no impact on the internal validity of the results, it may affect the external validity. Also, the sample is considerably smaller than Alesina et al.’s (2018) one, which not only limits the comparison with the countries covered but also limits our ability to explore richer outcomes derived from interactions among variables (as the number of observations in each group becomes too small). Finally, our data on perceived and actual social mobility is not perfectly aligned. Considering the latter is divided into quartiles while the former is divided into quintiles, approximations are required, and hence comparations should be made carefully.
Finally, and while our results are informative, they can be enhanced in a several ways. First, further research is needed to understand the rigidity of mobility beliefs to the top, and how they emerge and reproduce. Second, it would be very useful to understand if and to what extent the recent financial and sovereign debt crisis created these rigid beliefs in Portugal and if so, its impact on demand for redistribution. Third, the geographical disparities in perceptions in Europe raise the question of where people’s beliefs about social mobility come from: is it the media or the cultural history of each country? Finally, to ensure the external validly of these results, they should be assessed by relying on a sample that is representative of the population.
REFERENCES
Alesina, Alberto and Glaeser, Edward. 2006. “Why are welfare states in the US and Europe so different: What do we learn?” Horizons stratégiques, 2(2): 51-61.
Alesina, Alberto, and La Ferrara, Eliana 2005 “Preferences for Redistribution in the Land of Opportunities”. Journal of Public Economics, 89: 897-931.
Alesina, Alberto, Stantcheva. Stefanie and Teso, Edoardo. 2018. “Intergenerational Mobility and Preferences for Redistribution.” American Economic Review, 108 (2): 521-54.
Autoridade Tributária e Aduaneira. Impostos sobre o Património Adicional ao Imposto Municipal sobre Imóveis – AIMI nota informativa. 2018. Retrieved 28 October 2019, from
http://info.portaldasfinancas.gov.pt/pt/dgci/divulgacao/estatisticas/estatisticas_patrimonio/doc uments/nota_informativa_aimi_2018.pdf
25 Blinder, Alan S. and Krueger, Alan B. 2004. “What does the public know about economic policy
and how does it know it?” Brooking Papers on Economic Activity, 1: 32.
Canela, João and Vicente, Marta. 2018. “Abstenção e participação eleitoral em Portugal: Diagnóstico e hipóteses de reforma”. Portugal Talks 2018.
Cruces, Guillermo, Perez-Truglia, Ricardo and Tetaz, Martin. 2013. “Biased Perceptions of Income Distribution and Preferences for Redistribution: Evidence from a Survey Experiment”. Journal of Public Economics 98: 100–12.
European Commission. 2018. Special Eurobarometer 471: Fairness, Inequality and Intergenerational mobility. December 2017.
Eurostat. 2018. Distribution of income by quantiles - EU-SILC and ECHP surveys, retrieved 20 September 2019, from https://appsso.eurostat.ec.europa.eu/nui/submitViewTableAction.do
Giuliano, Paola and Spilimbergo, Antonio. 2014. “Growing up in a recession”. Rev. Econ. Stud. 81 (2): 787–817.
Jaime-Castillo, Antonio M. and Marqués-Perales, Ildefonso. 2014. “Beliefs about Social Fluidity and Preferences for Social Policies”. Journal of Social Policy. 43.
Kuklinski, James H., Paul J. Quirk, Jennifer Jerit, David Schwieder, and Robert F. Rich. 2003. “Misinformation and the Currency of Democratic Citizenship.” Journal of Politics 62 (3): 790– 816.
Kuziemko, Ilyana, Norton, Michal I., Saez, Emmanuel and Stantcheva, Stefanie. 2015. “How Elastic Are Preferences for Redistribution? Evidence from Randomized Survey Experiments”. American Economic Review, 105 (4): 1478-15.
Luttmer, Enzo F.P., and Singhal, Monica. 2011. “Culture, Context, and the Taste for Redistribution”. American Economic Journal: Economic Policy, 3 (1): 157-79.
Meltzer, Allan and Richard, Scott F. 1981. “A Rational Theory of the Size of Government. Journal of Political Economy”. 89 (5): 914–27.
Olivera, Javier. 2013. “Preferences for redistribution in Europe”. AIAS, GINI Discussion Paper 67.
Olivera, Javier. 2014. "Preferences for redistribution after the economic crisis," Working Papers 334, ECINEQ, Society for the Study of Economic Inequality.
Piketty, Thomas. 2014. “Capital in the 21st Century”. Cambridge, Massachusetts: The Belknap Press of Harvard University Press.
Piketty, Thomas. 1995. “Social Mobility and Redistributive Politics”. The Quarterly Journal of Economics, 110 (3): 551–584.
Rasmussen, Dennis C. 2016. “Adam Smith on What Is Wrong with Economic Inequality”. American Political Science Review, 110(2): 342-352.
Singhal, Monica. 2008. “Quantifying preferences for redistribution”. NBER Working Paper, Harvard University, John F. Kennedy School of Government, Cambridge.
Soroka, Stuart N. and Wlezien, Christopher. 2005. “Opinion–Policy Dynamics: Public Preferences and Public Expenditure in the United Kingdom”. British Journal of Political Science. 35. 665 - 689.
Stiglitz, Joseph E. 2013. “The Price of Inequality: How Today’s Divided Society Endangers our Future”. New York: W.W. Norton and Company.
Tocqueville, Alexis de. 1985. (1835) “Democracy in America”. Vol.1. Project Gutenberg ebook:
www.gutenberg.org/etext/815.
Page, Benjamin I. and Shapiro, Robert. 1983. “Effects of Public Opinion on Policy”. American Political Science Review, 77(1), 175-190.
APPENDIX
APPENDIX A. ADDITIONAL TABLES AND FIGURES
APPENDIX A.1. SAMPLE AND POPULATION CHARACTERISTICS Sample (1) Portuguese population (2) Female 0.61 0.53 Young 0.58 0.50 Rich 0.20 0.03 Household size 2.9 2.5 Married 0.56 0.47 College 0.77 0.25
Employed and self employed 0.69 0.55
Unemployed 0.03 0.07
Obs. 694
Notes: This table displays summary statistics from our survey sample (1) alongside nationally representative
statistics (2). Portuguese population’s data source: Pordata.
APPENDIX A.2. HETEROGENEITY IN MOBILITY PERCEPTIONS
Stay Poor Improve Get Rich dream alive American
(1) (2) (3) (4) Female (423) 38.520 53.045 8.434 0.106 Male (271) 40.583 50.963 8.158 0.166 Difference 2.063 (1.927) (1.816) -2.082 (1.015) -0.276 0.060** (0.026) Young (359) 42.213 48.213 9.574 0.143 Old (335) 36.651 55.955 7.170 0.117 Difference -5.561*** (1.872) 7.742*** (1.751) -2.404** (0.987) (0.026) -0.026 Move up (333) 37.219 54.102 8.679 0.141
Did not move up (361) 41.284 50.493 8.000 0.119
Difference 4.065**
(1.878) -3.609** (1.770) (0.991) -.679 (0.026) -0.022
College (537) 40.989 51.159 7.853 0.123
Less than College (157) 33.622 55.910 9.955 0.153
Difference -7.367***
(2.235) 4.752** (2.116) (1.182) 2.102* (0.031) 0.030 (Continued)
27 APPENDIX A.2. HETEROGENEITY IN MOBILITY PERCEPTIONS (Continued)
Stay Poor Improve Get Rich dream alive American
(1) (2) (3) (4)
Rich (138) 44.657 49.474 5.869 0.138
Not rich (556) 38.013 52.910 8.933 0.126
Difference -6.644***
(2.349) (2.223) 3.435 3.065** (1.237) (0.032) -0.010
Econ system fair (83) 40.217 49.663 10.120 0.434
Econ system unfair (611) 39.207 52.580 8.082 0.088
Difference -1.100
(2.897) (2.729) 2.917 (1.522) -2.038 -0.345*** (0.037)
Unequal opp. prob (673) 39.623 52.192 8.185 0.116
Unequal opp no prob (21) 29.905 53.429 12.857 0.571
Difference -9.718* (5.475) (5.172) 1.236 (2.882) 4.672 0.456*** (0.073) Left-wing (345) 41.749 50.988 7.262 0.087 Not Left-wing (349) 36.948 53.450 9.372 0.172 Difference -4.801** (1.874) (1.772) 2.462 2.110** (0.987) 0.085*** (0.025) Right-wing (122) 39.516 52.351 8.820 0.213 Not right-wing (570) 39.288 51.664 8.221 0.112 Difference -0.229 (2.470) (2.328) .687 (1.300) -0.599 -0.101*** (0.033)
Notes: The table reports average mobility perceptions for different groups of respondents and the difference
between them. Standard errors in parentheses. The outcome variables are defined as described in Table 1 of the paper. The dependent variables are defined as described in Table 2 of the paper. ∗p < 0.1, ∗∗ p < 0.05, ∗∗∗ p < 0.01. Source: Own calculations.
APPENDIX A.3. VIEWS ON GOVERNMENT BY POLITICAL ORIENTATION Trust Gov Gov. tools Lowering taxes better government Neg views
(1) (2) (3) (4)
Left-wing 0.062 0.012 -0.231 -0.266
Right-wing -0.070 -0.031 0.282 0.245
p-value diff. 0.003 0.312 0.000 0.000
Obs. 349 349 340 349
Notes: The table reports the estimates of regressions of political orientation on views of government for the control
group. The outcome variables are defined as described in Table 1. Controls included in all regressions are the vector of individual-level characteristics (Xi), presented in Subsection 2.1. Source: Own calculations. *** p<0.01, ** p<0.05, *p<0.1.
APPENDIX A.4 DEMAND FOR REDISTRIBUTIVE POLICIES BY POLITICAL ORIENTATION Budget
opp Support AIMI
Support equality opp. policies Unequal opp. very serious problem Budget safety net Tax Rate Top 1 Tax Rate Bottom 50 (1) (2) (3) (4) (5) (6) (7) Left -0.055 0.158*** 0.059* 0.142** 0.116** 6.247** -0.924 Right 0.031 -0.090 -0.116* -0.182** -0.039 -3.817 -0.890 P-value diff. 0.250 0.000 0.002 0.000 0.037 0.003 0.985 Obs. 349 349 349 349 349 349 349
Notes: The table reports the estimates of regressions of political orientation on different redistributive policies for
the control group. The outcome variables are defined as described in Table 1. Controls included in all regressions are the vector of individual-level characteristics (Xi), presented in Subsection 2.1. *** p<0.01, ** p<0.05, *p<0.1. Source: Own calculations.
APPENDIX A.5. DETAILED PERCEIVED TRANSITION PROBABILITIES BY COUNTRY
Stay Poor Improve Get Rich Obs.
(1) (2) (3) USA 0.322 0.442 0.237 2170 UK 0.378 0.416 0.206 1290 France 0.353 0.451 0.196 1297 Italy 0.336 0.450 0.214 1242 Sweden 0.320 0.476 0.204 881 EU average 0.350 0.460 0.190 6880 Portugal 0.379 0.542 0.079 349
Notes: The table reports average mobility perceptions for each country and the EU average. Only the control group
is considered to avoid the influence of the treatment effects on mobility perceptions. The outcome variables are defined as described in Table 1. Source: Own computations for Portugal and calculations from Alesina et al. (2018) from the remaining countries.
29 APPENDIX A.6. VIEWS ON GOVERNMENT BY COUNTRY
Trust Govt. Govt. Tools Lowering Taxes Better Unequal Opp. Problem Negative View of Government Obs. (1) (2) (4) (5) (6) (7) US All 0.23 0.75 0.32 0.83 0.59 1 731 Left 0.30 0.85 0.14 0.92 0.39 464 Right 0.17 0.63 0.56 0.74 0.78 517 UK All 0.17 0.82 0.24 0.85 0.50 759 Left 0.09 0.89 0.11 0.93 0.40 257 Right 0.37 0.75 0.44 0.75 0.65 167 France All 0.06 0.48 0.51 0.89 0.85 769 Left 0.08 0.53 0.32 0.94 0.75 249 Right 0.06 0.48 0.66 0.84 0.91 307 Italy All 0.08 0.73 0.44 0.94 0.71 735 Left 0.10 0.76 0.33 0.96 0.60 335 Right 0.05 0.69 0.61 0.92 0.84 238 Sweden All 0.50 0.81 0.29 0.91 0.53 454 Left 0.59 0.90 0.07 0.99 0.23 137 Right 0.46 0.78 0.53 0.84 0.74 193 Portugal All 0.11 0.93 0.31 0.97 0.47 349 Left 0.15 0.93 0.14 0.98 0.29 163 Right 0.05 0.92 0.64 0.95 0.77 60
Notes: The table reports average views on government for each country for all respondents of each country and
for left- and right-wing respondents. Only the control group is considered to avoid the influence of the treatment effects on views on government. Outcome variables are defined as in Table 1. Source: Own computations for Portugal and calculations from Alesina et al. (2018) from the remaining countries.
APPENDIX A.7. DEMAND FOR REDISTRIBUTIVE POLICIES BY COUNTRY Tax rate top 1 Tax Rate Bottom 50 Share Taxes Top 1 Share Taxes Bottom 50 Support Capital Tax Budget Opp. Budget Safety Net Obs. 1-4 Obs. 5-7 (1) (2) (3) (4) (5) (6) (7) (9) (10) US All 25.22 7.86 0.35 0.07 0.35 32.73 13.51 851 1 731 Left 28.10 5.96 0.39 0.05 0.51 35.22 15.03 216 464 Right 22.49 10.05 0.31 0.08 0.20 29.08 11.86 261 517 UK All 37.15 6.50 0.28 0.10 0.32 41.30 13.36 758 758 Left 39.97 5.67 0.31 0.08 0.44 42.12 14.45 256 257 Right 34.65 6.89 0.26 0.10 0.26 41.52 12.19 167 167 France All 43.71 8.51 0.18 0.12 0.22 38.59 13.37 769 769 Left 47.07 6.92 0.19 0.09 0.31 39.95 14.81 249 249 Right 42.70 9.59 0.17 0.13 0.18 37.09 12.31 307 307 Italy All 37.75 10.37 0.19 0.14 0.23 38.99 15.70 732 735 Left 38.66 9.04 0.19 0.12 0.31 40.15 15.55 335 335 Right 34.74 11.44 0.17 0.15 0.14 38.33 15.37 235 238 Sweden All 50.81 22.50 0.11 0.17 0.28 43.03 14.52 454 454 Left 53.49 22.23 0.11 0.17 0.49 43.26 16.67 137 137 Right 46.99 23.32 0.10 0.17 0.16 43.25 13.07 193 193 Portugal All 46.38 11.83 0.38 0.10 0.29 53.21 20.35 347 347 Left 50.21 11.32 0.40 0.09 0.20 53.10 21.20 163 163 Right 39.82 11.73 0.38 0.11 0.13 52.92 18.90 60 60
Notes: The table reports average policy preferences for each country for all respondents of each country and for
left- and right-wing respondents. Only the control group is considered to avoid the influence of the treatment effects on policy preferences. Outcome variables are defined as in Table 1. Source: Own computations for Portugal and calculations from Alesina et al. (2018) from the remaining countries.
31 APPENDIX B. SURVEY
1. Do you think the Portuguese economic system is:
1. The economic system in Portugal is fair, there is equal opportunity; 2. The economic system in Portugal is unfair, there is no equal opportunity
2. Do you think you can rely on political institutions to do the right thing?
1. No, never; 2. Sometimes; 3. Yes, most of the time; 4. Yes, always
3. Children from poor and rich families not having the same opportunities in life is:
1. Not a problem; 2. A small problem; 3. A problem; 4. A serious problem.; 5. A very serious problem
4. Some people do not vote today. Will you go to the next legislative elections in Portugal on 6 October 2019?
1. Yes; 2. No; 3. I don't know; 4. I am not old enough to vote
-0.2 -0.1 0 0.1 0.2 US UK FR IT SW PT
Accurancy of mobility percenptions
Stay Poor Improve Get Rich
Notes: The figure shows, for each country and each quintile transition, the difference between the actual
and the perceived mobility. “Stay Poor”, “Improve” and “Get Rich” are defined as described in Table 1. APPENDIX A.8. ACCURACY OF MOBILITY PERCEPTIONS
5. Level of education:
1. First cycle (4th year); 2. Second cycle (6th grade); 3. Third cycle (9th grade); 4. Secondary Education (12th grade); 5. Degree; 6. Postgraduate; 7. Master; 8. Doctorate
6. Were you ever employed?
1. Yes; 2. No
7. What is your current employment status?
1. Full-time employee; 2. Part-time employee; 3. Self-employed or small business owner;4. Unemployed and looking for work; 5. Student; 6. Not in labor force (for example: retired, or full-time parent)
8. Father’s level of education:
1. First cycle (4th year); 2. Second cycle (6th grade); 3. Third cycle (9th grade); 4. Secondary Education (12th grade); 5. Degree; 6. Postgraduate; 7. Master; 8. Doctorate
9. If you compare your job (or your last job if you currently do not have a job) with the job your father had while you were growing up, would you say that the level of status of your job is:
1. Much higher than my father's; 2. Higher than my father's; 3. About equal to my father’s; 4. Lower than my father's; 5. Much lower than my father's; 6. My father did not have a job while I was growing up OR my father was not present
10. Mother’s level of education
1. First cycle (4th year); 2. Second cycle (6th grade); 3. Third cycle (9th grade); 4. Secondary Education (12th grade); 5. Degree; 6. Postgraduate; 7. Master; 8. Doctorate
33 11. If you compare your job (or your last job if you currently do not have a job) with the job your father had while you were growing up, would you say that the level of status of your job is:
1. Much higher than my mother's; 2. Higher than my f mother's; 3. About equal to my mother's; 4. Lower than my mother’s; 5. Much lower than my mother's; 6. My mother did not have a job while I was growing up OR my mother was not present
12. When you were growing up, compared with Portuguese families back then, would you say your family income was:
1. Far below average; 2. Below average; 3. Average; 4. Above- average; 5. Far above average
13. Right now, compared with other Portuguese families, would you say your household income is:
1. Far below average; 2. Below average; 3. Average; 4. Above- average; 5. Far above average
14. In politics, it is customary to talk about left and right. How would you position yourself on this scale, where 1 represents the most left-wing position and 10 the most right-wing position?
RANDOMIZED PERCEPTION EXPERIMENT
Recent academic research has been exploring the link between one’s family background and one’s chances of making it in life. These recent academic studies have leveraged new large-scale datasets to explore the opportunities to children from different family backgrounds and their chances of making it in life.
We will now show you an image that summarizes the key findings of these studies. Please proceed to the next page when you are ready.
APPENDIX B.1. TREATMENT INFORMATIVE IMAGE
15. How many out of 100 children coming from the poorest 100 families will grow up to be in each income group.
1. The richest 100 families; 2. The second richest 100 families; 3. The middle 100 families; 4. The second poorest 100 families; 5. The poorest 100 families
Notes: In the left-hand side respondents are informed that it is extremely rare for a child born in a poor family
to become rich later in life. On the right-hand side, the figure says that it is extremely rare for a child born in a rich family to become poor later in life.
35 APPENDIX B.2. LADDER QUESTION TO ELICIT PERCEIVED MOBILITY
16. Do you think the chances that a child from the poorest 100 families will grow up to be among the richest 100 families are:
1. Close to zero; 2. Low; 3. Fairly low; 4. Fairly high; 5. High
17. Do you think the chances that a child from the poorest 100 families will grow up to be among the second richest 100 families are:
1. Close to zero; 2. Low; 3. Fairly low; 4. Fairly high; 5. High
18. How do you feel about the following statement? “In Portugal, everybody has a chance to make it and be economically successful.”
1. Strongly agree; 2. Agree; 3. Neither agree nor disagree; 4. Disagree;5. Strongly disagree
19. What do you think would do more to make opportunities for children from poor and rich families less unequal?
1. Lowering taxes on wealthy people and corporations to encourage more investment in economic growth; 2. Raising taxes on wealthy people and corporations to expand programs for the poor.
20. Do you support more policies to increase the opportunities for children born in poor families and to foster more equality of opportunity, such as education policies? Naturally, to finance an expansion of policies promoting equal opportunity, it would have to be the case that either other policies are scaled down or taxes are raised.
1. I very strongly oppose more policies promoting equality of opportunity; 2. I oppose more policies promoting equality of opportunity; 3. I am indifferent; 4. I support more policies promoting equality of opportunity; 5. I very strongly support more policies promoting equality of opportunity.
21. To reduce the inequality of opportunities between children born in poor and rich families, the government has the ability and the tools to do:
1. Nothing at all; 2. Not much; 3. Some; 4. A lot
22. The state collects a certain amount of income through the income tax (IRS) that it uses to maintain public spending. The average tax rate is the percentage of your income you pay on your IRS. For example, if you earn 12,000 € and pay 1,200 € in income tax, your average tax rate is 10%.
Please adjust the bars below to tell us what, in your opinion, is the average fair tax rate that a family from each group should pay?
37 APPENDIX B.2. QUESTION ON PREFERRED INCOME AVERAGE TAX RATES FOR
VARIOUS INCOME GROUPS
23. We now ask you how you would like to spend the total government budget. Suppose that you are the person deciding on the U.S. budget for the next year. You can choose how you want to divide the budget between the following categories: Defense and National Security; Public Infrastructure; Education; Social Security; Health Care.