Case study: Marketing Plan at B2F
by
Pedro Filipe Leite Sorte Teixeira
Internship Report for Master in Management
Supervisor
Doctor Maria Catarina de Almeida Roseira
3
Abstract
A marketing plan is a crucial document in every company that allows an organization to understand where it is right now, why and where to go. Organizations need to spend a big amount of time in order to define targets, think about market opportunities and set strategies to reach to defined objectives.
This report intends to demonstrate the elaboration of a marketing plan in a case study of B2F, a Business Intelligence SME that operates for more than 10 years without a detailed and coherent marketing plan. This work is the result of an internship that lasted from 5/10/2015 to 8/4/2016.
Business Intelligence is getting more recognized over companies, understanding how data analysis allows them to reach new heights and gain market share over competitors.
The report intends to present the evolution of the marketing plan (research, analysis, and selection of data) and the development of a communication plan for a company that is now pretending to increase market share and visibility in the market. Hopefully, B2F will benefit from the process and results of the marketing plan that was devised during the internship. We believe that this study may also be useful to similar companies (e.g. small companies) facing similar difficulties.
Keywords: Marketing plan, Business Intelligence, IT Management, B2F JEL-Codes: M15, M31, M39
5
Resumo
Um plano de Marketing é um documento crucial para qualquer empresa uma vez que permite que uma empresa perceba a sua situação atual, o porquê dessa situação e qual será o passo seguinte. As empresas precisam de investir grandes quantidades de tempo para definir objetivos, pensar sobre as oportunidades de mercado e definir estratégias para alcançar os objetivos estabelecidos.
Este relatório pretende demonstrar a elaboração de um Plano de Marketing através de um caso de estudo na empresa B2F, uma PME no segmento de Business Intelligence que opera nesse mercado há mais de 10 anos sem um Plano de Marketing detalhado e coerente. Este relatório é o resultado de um estágio que se iniciou a 5/10/2016 e terminou a 8/4/2016.
O segmento de Business Intelligence está cada vez mais a ser reconhecida pelas empresas, que procuram entender como é que a análise de dados permite que novas metas sejam alcançadas e consigam aumentar a quota de mercado face aos seus concorrentes.
Com este relatório pretende-se apresentar a evolução do Plano de Marketing (pesquisa, análise e seleção de informação) e o desenvolvimento do Plano de Comunicação para uma empresa que pretende neste momento aumentar a sua quota de mercado e visibilidade no mercado.
Espera-se que a empresa B2F beneficie do processo de elaboração do Plano de Marketing durante o estágio e dos seus resultados após implementação. Acredita-se que este estudo será útil para empresas similares (p.e. PME’s) que enfrentem dificuldades equivalentes.
Palavras-chave: Plano de Marketing, Business Intelligence, Gestão de Tecnologias de
Informação, B2F
7
Index
Abstract ... 3 Resumo ... 5 1. Introduction ... 13 2. Marketing Plan ... 17 3. Environment Analysis ... 23 3.1 External Analysis ... 25 3.1.1 PESTEL Analysis ... 253.1.2 Porter’s Five Forces ... 27
3.1.3 Strategic group ... 35
3.2 Internal Environment ... 41
3.2.1 B2F’s History ... 41
3.2.2 Mission, Vision, Values ... 42
3.2.3 VRIO Analysis ... 43 3.2.3.1 Technical Skills ... 45 3.2.3.2 Human Resources ... 46 3.2.3.3 Summary ... 49 3.2.4 Client Portfolio ... 51 3.2.5 Communication ... 57 3.2.6 Conclusions ... 59 3.3 SWOT ... 61 4. Marketing Plan ... 65 4.1 Objectives ... 67
4.2 Segmentation, Targeting and Positioning (STP) ... 69
4.2.1 Segmentation and targeting ... 69
4.2.2 Positioning ... 71
8 4.3.1 Product/Service... 75 4.3.2 Place ... 77 4.3.3 People... 79 4.3.4 Price ... 81 4.3.5 Process ... 83 4.3.6 Promotion ... 85 4.3.7 Summary ... 91 4.4 Conclusions ... 97
5. Chronogram and Budgeting ... 99
6. Final Conclusions ... 103
7. References ... 105
9
Table Index
Table 1 - Software Market Growth and Forecasts (adapted from MarketLine Industry
Profile – Software in Europe, June 2015)... 31
Table 2 - IT Services Growth and Forecasts (adapted from MarketLine Industry Profile – IT Services in Europe, June 2015) ... 32
Table 3 - B2F competitors in the BI market (Values extracted from “sabi” in November 2015) ... 36
Table 4 - VRIO Framework (adapted from Barney and Hesterly, 2012) ... 44
Table 5 - B2F’s resources analysis ... 49
Table 6 – B2F Clients division in scales in 2012 ... 53
Table 7 - B2F Clients division in scales in 2013 ... 53
Table 8 - B2F Clients division in scales in 2014 ... 53
Table 9 - B2F’s SWOT Analysis ... 63
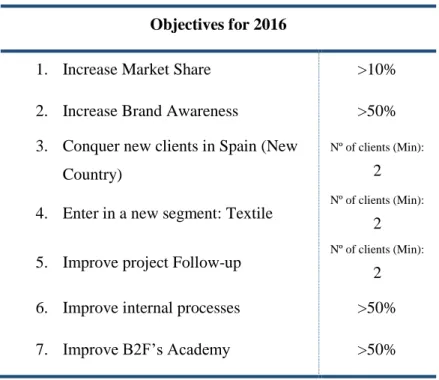
Table 10 - B2F objectives for the year 2016 ... 67
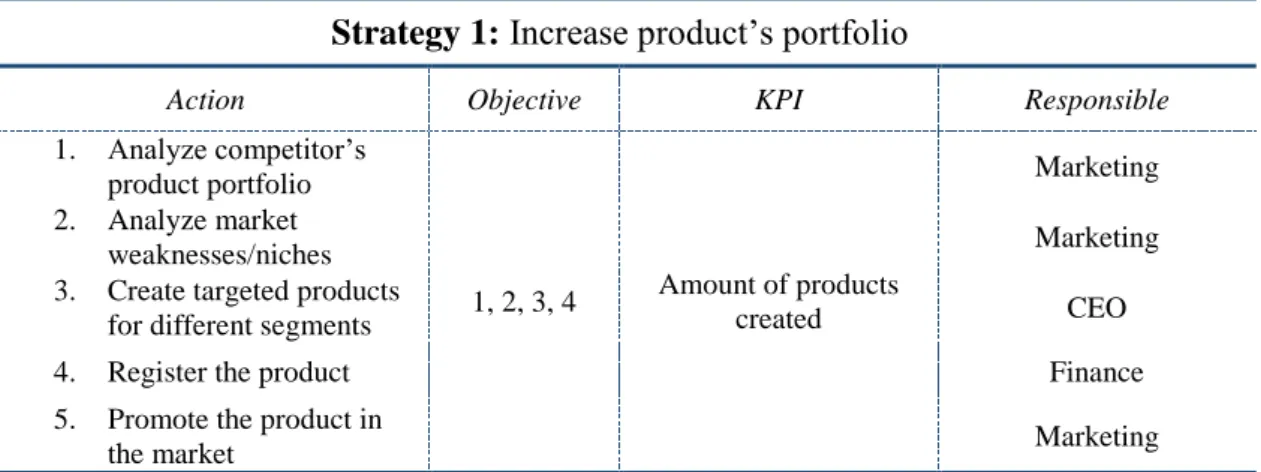
Table 11 – Product’s strategy nº 1 ... 91
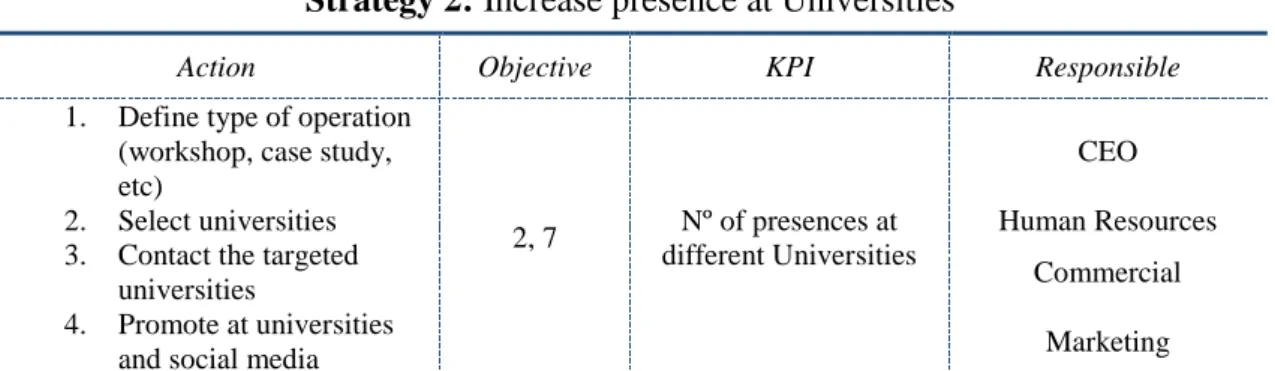
Table 12 – Product’s strategy nª 2 ... 91
Table 13 - People’s strategy nº 1 ... 91
Table 14 - People’s strategy nº 2 ... 92
Table 15 - Price’s strategy nº 1 ... 92
Table 16 - Price’s strategy nº 2 ... 92
Table 17 - Place’s strategy nº 1 ... 92
Table 18 - Place’s strategy nº 2 ... 93
Table 19 – Process’s Strategy nº 1 ... 93
Table 20 – Process’s Strategy nº 2 ... 93
Table 21 - Promotion’s strategy nº 1 ... 94
Table 22 - Promotion’s strategy nº 2 ... 94
Table 23 - Promotion’s strategy nº 3 ... 94
Table 24 - Promotion’s strategy nº 4 ... 94
Table 25 – Promotion’s strategy nº 5 ... 95
Table 26 – Promotion’s strategy nº 6 ... 95
Table 27 – Promotion’s strategy nº 7 ... 95
Table 28 – Promotion’s strategy nº 8 ... 95
10
Table 30 – B2F’s Strategies chronogram ... 101 Table 31 – B2F’s Budget (Internal decision) ... 101
11
Chart Index
Chart 1 - Software and IT Services growth in Europe (adapted from MarketLine Industry Profile - IT Services in Europe, June 2015 and MarketLine Industry Profile –
Software in Europe, June 2015) ... 32
Chart 2 – Portugal and Euro Area Grow Domestic Product forecasts (adapted from Banco de Portugal, Projections for the Portuguese Economy: 2015 – 2017 ... 33
Chart 3 – % of competitors operating in the North and South of Portugal ... 35
Chart 4 – B2F strategic group companies positioning ... 37
Chart 5 – B2F positioning after implementing marketing strategies ... 39
Chart 6 – B2F employees number in 2014 and 2015 ... 46
Chart 7 – B2F’s employee financial ratios ... 47
Chart 8 – B2F Client weight in market segments ... 51
Chart 9 - B2F Clients segmentation over the years ... 54
Chart 10 – B2F Facebook page likes (at the beginning of the internship) ... 58
Chart 11 – B2F LinkedIn company page followers (at the beginning of the internship) 58 Chart 12 - B2F price/quality positioning ... 81
Chart 13 – B2F Facebook page likes (at the end of the internship) ... 87
Chart 14 – B2F LinkedIn followers (at the end of the internship) ... 87
Chart 15 - Costs and Earnings per Employee ... 109
Chart 16 - Number of employees at B2F in 2012, 2013 and 2014 ... 109
Chart 17 - Market segment growth and weight over B2F operations at 2012... 110
Chart 18 - Market segment growth and weight over B2F operations at 2013... 110
13
1. Introduction
The aim of this project is to develop a Marketing Plan for B2F – BUSINESSTOFUTURE (here named B2F) and implement it in order to achieve the objectives of the company, namely to increase brand awareness and gain market share. B2F, is a small company that operates in the Business Intelligence niche: Business Intelligence is a practice that enables access to analysis of information in order to improve and optimize decisions and performance (Gartner1), in the Information Technology (IT) market.
Despite the fact that B2F has been operating for 10 years, the company does not yet have a structured marketing plan. The development of a marketing plan requires a deep knowledge of the context where firms operate. Thus, the next paragraphs provide a brief insight of B2F business context.
IT Services are growing at a low but constant rate. From 2010 to 2014 IT Services grew at a compound annual growth rate (CAGR) of 2.2% in Europe. In this segment, the category of consulting & support presented a huge percentage in the market with 62.3% in 2014 (IT Services in Europe, 2015).
IT consulting is nowadays giving steps to become the main category in IT services. This growth allows companies in this market to evolve from simple producers and supporters to business specialist consultants. The uncertainty and fluctuations of the overall economy are a big influence in the growth of several markets. Recent data from “Projections for the Portuguese Economy: 2015-2017 – Banco de Portugal” shows that Portugal will follow the small rate growth of Europe which will allow Portugal to increase the presence of IT sector in the overall market.
In Portugal, the IT Services represent only 15.8% in the ICT market, but in the total IT market, IT Services holds approximately 35% of the market. Forecasts of IDC show that IT Services will grow to 40% in the ICT market until 2020 (IDC Market Report: “Information and Communications Technology Market in Portugal” – March 2014).
Small companies are the main operators in the market (Juntunen, M et al., 2010), and the IT Service segment is also one of the segments that is supported in SME’s. Constantly innovating and changing the way they are present in the market nowadays and with the
14
constant changes in the market, small companies have to prepare themselves to reach to customers. Companies cannot afford to innovate, but the capacity to adapt to the market is crucial.
In that sense, crafting and implementation of a Marketing Plan is an essential element. A Marketing Plan can be the point of differentiation amongst winners and losers (Brooksbank, 1999). A market overview is always important so that small companies are always aware of new changes as understanding what the market is, how it works and what kind of key decision points exist is fundamental to success (McDonald, 2006).
Marketing planning can be considered a technology, a set of techniques and activities, which assists the organization of internal and external inputs in order to reach a certain objective (Pulendran et al., 2003). It is only possible to small businesses to develop and conquer market if they place the general, strategic and tactic planning in the center of the activities, in order to reach the marketing but also the general objectives of the company (Valeriu et al., 2011).
Marketing planning will lead companies not only to understand the market where it operates and their positioning, but also to understand how they can improve their current situation, and set a path to follow in order to reach a certain objective (Kotler and Keller, 2011).
Communication stands up has a main element of the Marketing Plan. A company can only have contact with clients by increasing the communication of the company, services, promotions, product offerings or companies with communication (Gabrielli and Balboni, 2010).
Communication is a very important phase for these companies (SME’s), once many companies focus their communication in a Word-of-Mouth (WoM) mainly based on the CEO connections and clients (Jones et al., 2015).
The Internet appears as one of the best solutions for these companies, as the lack of financial and technological resources poses big limits to the increase of brand awareness (Vescovi, 2000). This allows companies to reach a wider public at a lower cost, enabling the CEO to focus on other important aspects of the company such as customer relationship.
15
The next chapters will describe the literature review of Marketing Plan at SME’s (Chapter 2) and the Environmental analysis (Internal and External) at chapter 3 that is summarized in a SWOT analysis. Chapter 4 will describe the Marketing Mix of the company. The last two chapters, 5 and 6, describe the Chronogram and Budget of the strategies defined during the production of the Marketing Plan and the conclusions of the internship at B2F, respectively.
17
2. Marketing Plan
A Marketing Plan allows companies to create and develop strategies in order to leverage their resources and gain or maintain competitive advantage (Morgan, 2012).
Additionally, a Marketing Plan allows companies to relate all departments, with the objective of developing strategies to achieve their defined goals (Kotler and Armstrong, 2011). This type of strategic planning involves the resources of the entire company in order to acknowledge how every resource may help to seize existing opportunities (Puiu et al., 2009). The marketing plan can vary from company to company, mainly because of the size of the company but also because of the business sector that the company is operating. For example, SME’s can create a shorter and less developed Marketing Plan mainly because of less expertise but also because the market where the company is operating is less competitive and does not need such an elaborate plan (Kotler and Armstrong, 2011; Kotler and Keller, 2011).
There are different approaches to the creation of the Marketing Plan but almost all touch the overall points of analysis – Analysis of the external and internal environment of the company; Selection of the fundamental information gathered with the analysis made; Development and implementation of strategies to achieve the goals defined by the company; Continuous following of the strategies implemented (Brooksbank, 1999; Kotler and Armstrong, 2011).
A Marketing Plan should start with an overall view of the market (Puiu et al., 2009). This analysis of the market will allow companies to understand their competitor’s moves, the client’s necessities, habits, the trends of the market and the actual positioning of the company (Morgan, 2012). Market research should be based on several data such as reports of Industrial Outlook, Journals, Internal sources such as balance sheets, sales and loss statements, internet research using websites of market information and also checking out rivals, by enjoying services of the competitors as their clients. The analysis of the external environment of the company should be supported by frameworks (such as Porter Five Forces and PESTEL analysis) to gather data on the market. PESTEL framework allows companies to research about the trends and limitations of the external environment around the company. It analyses the Political, Economic, Social, Technological, Environmental and Legal aspects that affect the industry where the company is operating
18
(Wheelen and Hunger, 2011). At the industry level, the Porter Five Forces help companies to acquire information about the industry where the company operates. The intensity of the factors varies from industry to industry, and also from the proximity of companies’ core businesses in that industry (David, 2010). The factors that are represented by this framework are the rivalry level between companies, the bargaining power of suppliers, the bargaining power of clients, threats of new entrants and threat of substitute products/services (Porter, 1998). All of these are ways to obtain vital information for the company to start to develop their strategies. Additionally, companies need to define their strategic groups of direct competitors and possible scenarios in the market. Segmentation over clients is also an important analysis, not only by the actual clients but also the possible clients to achieve when defining and implementing strategies (Kotler and Armstrong, 2011). Research should be well thought out before beginning the research with the problem of collect a lot of unnecessary information (Kotler, 2002; Keller and Kotler, 2011).
After the initial phase of research and selection of data, it is necessary to analyze the information collected, in order to go to the implementation phase and afterwards to the controlling phase (Brooksbank, 1999; Valeriu et al., 2011). The analysis of the information will allow the company to do a triage of information, only selecting necessary data to develop strategies. With this, the company understand where it is in the market and defines where they want to go. After this analysis, the company should run an internal analysis to understand which are its main strengths and weaknesses. Companies need to understand if they have a competitive advantage over their competitors. VRIO is a framework that helps companies to be analyzed internally and realize if their resources are Valuable, Rare, Inimitable and Organized for the company exploitation, achieving a competitive advantage over their direct competitors (Barney and Hesterly, 2012). They can also apply an internal benchmarking in order to improve the overall performance of the company based on the good functioning of an inside department of the organization (Kotler, 2002).
Based on the external and internal, it is then possible to run a SWOT analysis. SWOT is a framework that allows the companies to understand which their main strengths are and weaknesses at an internal perspective and which are their main opportunities and threats from an external perspective. It is a mix of internal and external analysis that allows companies to really acknowledge their businesses (Wheelen and Hunger, 2011; Kotler,
19
2002). Thus, the SWOT analysis will help companies understand how the company’s strategies should be developed to achieve its objectives using its strengths to explore existing opportunities, and also to identify which resources are failing and how to improve them (Wheelen and Hunger, 2011; McDonald, 2006).
After the analysis, it is time to design the Marketing Plan that will support the prosecution of the company overall strategy. The Marketing Plan details the implementation plan (e.g., activities, calendar) and the control mechanisms that assure that the strategy will stay in due course (Kotler and Keller, 2011).
Marketing Planning in SME’s
Small businesses have to adapt their businesses to change over the time, and the way that it’s used is by developing a Marketing Plan in order to analyze the market and subsequently implement strategies to evolve in the market. Customer satisfaction and habits trends, as well as the way their competitors are present in the market, should be some of the main conclusions of this analysis.
This Marketing Plan should be well thought out, once small businesses have restrictions (e.g. limited financial resources, lack of expertise to produce and low impact in the market) that may limit the density and quality of the Plan (Valeriu et al., 2011; Jones et al., 2015; Gabrielli and Balboni, 2010). Additionally, many of the SME’s are not worried about their brand promotion or focused in the creation of a healthy relationship with their clients. By the contrary, the companies are worried in delivery the work that is asked by their clients at a time (Gabrielli and Balboni, 2010).
In a B2B level, companies don’t invest in the marketing division even though the period of partnership or relationship between companies are mainly long. B2B companies don’t look at marketing as a crucial aspect to develop, being mainly focused in the relational aspect, and less in the marketing strategical evolution of the company (Reed et al., 2004)
Marketing Communication
Although the brainstorming and development of certain strategies to improve the health of the company may be very relevant, one of the main parts to have a valuable Marketing
20
Plan is communication. It is necessary to communicate with the internal and external environment of the company the decisions made with the goal to obtain a good culture in the company and to reach to a larger public (Inskip, 2003).
A fluent and good communication is the perfect way to achieve goals over clients, and in this type of market, communication is one of the main purposes that allows companies to survive and conquer market share (Vescovi, 2000).
It is important to notice that communication changed over time, and nowadays the technology has changed the way customers see and want to see the information (Kotler and Armstrong, 2011). People see information when they want to see it and can decide if they want, and how they want to receive publicity (Kotler and Keller, 2011). Thus nowadays, companies are changing the way they increase the brand awareness and sales. SME’s brand communication is mainly based on personal selling (Gabrielli and Balboni, 2010; Centeno and Hart, 2012; Wong and Merrilees, 2005). This personal selling is mainly entrusted to the person that owns the company or that has created it. The interaction of the owner helps to increase the network of clients with the company which will help when designing the Marketing Plan (Jones et al., 2015).
There is no better person to talk about the brand that the person that have created it. Despite this factor, the limited resources (e.g. staff and time) or expertise, to implement communication strategies leaves the company relying on the relational marketing approach to create and obtain the trust of its clients and increase the brand awareness of the company (Briones et al., 2011; Gilmore et al., 2001).
This type of marketing has its advantages to the seller and the client. It helps the seller to understand the different ways of approaching different clients and to obtain the trust of the client. The short time for decision making may be one of the advantages for clients to acquire a service or product (Kaplan and Haenlein, 2011).
One new way to reach to customers, despite the “old” strategies of Public Relations or Personal Selling for example, is Social Media, which enables companies to have close contact with a wide range of possible customers with low cost strategies (Nobre and Silva, 2014; Centeno and Hart, 2012; Gabrielli and Balboni, 2010; Kaplan and Haenlein, 2011).
It allows substituting a physical proximity with a virtual interaction and intimacy in popular websites as Facebook or LinkedIn (Jones et al., 2015).
21
Social Networks appear as an important way for companies to increase the range of possible clients but also to acquire new tools to create brand awareness, reputation and extend its communications (Nobre and Silva, 2014).
Facebook has a set of skills to each company, allowing to expose the company brand over the profile picture and the cover photo. It enables also to define a specific public to each post, what’s becomes an advantage to not only understand which is the best public for the company but also to specialize the communication to a certain public. Companies can understand which are the best results by monitoring its posts growth and change some aspects to test and reach new conclusions (Nobre and Silva, 2014).
LinkedIn is also a network that allows reaching a wider range of people but with a more professional communication. LinkedIn allows companies to share content with the public, invest in ads to increase the range of the post, engage with several followers. The communication tends to become more formal over the network which is mainly used by companies but also by professionals looking for first jobs, new jobs or just increasing their digital presence. As Facebook, LinkedIn also enables companies to analyze and take conclusions over the communication strategy implemented in the network (Kietzmann et al., 2011).
In this sense, the advance of technology and communication strategies associated with this development are a very positive way to conquer new customers, especially in SMEs once these companies many times don’t have the resources to produce a well-structured communication strategy (Jones et al., 2015).
Summing up, a Marketing Plan is crucial to the increase of results of companies, once it allows organizations to understand where it must improve to achieve bigger goals. This is possible by analyzing the environment, retrieve useful information, defining strategies and then implement and follow the results. This is all possible by the use of several tools (SWOT, PESTEL, Porter Five Forces, etc.). Although this is important, it is not general for all of the companies. It can change from company to company, business to business or industry to industry. SMEs are the perfect example. The size of the company demonstrates the difference that it is necessary to have in the marketing plan at these companies (mainly because of low financial resources, expertise and time).
The internet and mainly social media are tools that SME’s can and should use in order to reach different client with a wider range improving the operation area with lower costs
22
that traditional tools. At the same time, it allows companies managers to focus on possible problems and define strategies to increase the market share of the company. It will lead companies to structure digital plans to obtain the maximum profit of an ascending tool in society.
In the next chapter, we will know the core business of the company, B2F, understanding the evolution in of the company through the years.
23
3. Environment Analysis
Any analysis of the opportunities and threats facing a firm begins with an understanding of the environment in which a firm operates. This analysis consists of gathering information about all the trends and external factors that can have an impact on the company’s strategy (Barney and Hesterly, 2012).
Even though the external environment of a company can be very broad, the social and economic forces are key aspects so that companies may manage their resources and define strategies in order to improve their position in the market (Porter, 1998).
An opportunity appears in the market when a company has the chance to have a big profitability in a certain area of interest because of a good strategy development and competitor analysis. A possibility to have an opportunity in the market in by offering something that is short supply. One other way is to supply an existing product or service in a different and innovative way or, creating a new product/service (Kotler and Keller, 2011).
A threat is developed by an unfavorable trend or any external factor that may lead to a decrease or profit because of a low defensive strategy. In this cases, the competitors are one step way with bigger probabilities to improve their market position. Threats are one of the major aspects that companies need to be aware because they can destroy companies of not detected and dealt with in short time (Kotler and Keller, 2011).
Companies may have a good possibility to find opportunities in the market in order to reach a higher position over its competitors. But, in order to achieve that mark, companies need to understand if they have resources and capabilities to catch those opportunities analyzing its internal environment (Kotler and Keller, 2011).
Despite external analysis being extremely important to understand the market opportunities, the competitors and the company’s public, internal analysis must be taken also as an imperative analysis for companies, once it is only possible to maximize the potential of its resources by analyzing the level where they are and the level where they need to be (Morgan, 2012).
An internal analysis should involve a comprehensive cover over financial aspects, technical abilities, customer relationships, employees, communication, and many others. This analysis should help the company to understand which are its core competencies and
24
strengths, in order to understand if the company has a competitive advantage and can conquer the opportunities present in the market (Brooksbank, 1999).
It is a crucial analysis to companies once it helps them to understand if there is an actual problem in the company that might be jeopardizing the company’s performance and results (Puiu et al., 2009).
The next chapter (3.1) begins with an external analysis of the company’s environment in order to determine the opportunities and threats that B2F faces in the BI market. The sections 3.1.1 and 3.1.2 present the PESTEL and Porter Five Forces framework, respectively to analyze the BI market in Portugal. It is also defined the strategical positioning of B2F according to the strategic group defined (section 3.1.3).
The chapter 3.2 presents the internal analysis of the company beginning with the company presentation at section 3.2.1 followed by the description of the Mission, Vision, and Values of the company (section 3.2.2). After, it is presented VRIO analysis (section 3.2.3) with the main objective to find if B2F has competitive advantage basing the analysis in the Technical skills (section 3.2.3.1) and the Human resources of the company (section 3.2.3.2). Then, client portfolio and communication of the company (sections 3.2.4, 3.2.5, respectively) are analyzed.
The internship was mainly focused on communication, which was one of the major problems of the company, specifically in the social network. Still, other aspects were taken in consideration in the analysis of the company.
25
3.1 External Analysis
3.1.1 PESTEL Analysis
PESTEL framework helps companies to analyze the external environment of the company focusing in the Political, Economic, Social, Technological, Environmental and Legal aspects of the market (Armstrong and Taylor, 2014).
All of these aspect may influence companies in order to develop strategies and conquer market share. These influences have different impact according to the core business of the company in which, for example, the Political aspects of the environment does not influence at all the roll of the company in the market (Wheelen and Hunger, 2011).
When analyzing the company over certain factors using the PESTEL framework we discover that not all of them influence the company.
In this section, the main source of data was the reports of the BI industry (secondary data) provided by the company in order to understand the external environment allowing to reach the following conclusions.
P – Political
Political influences, such as government stability or taxation policy (for example) may limit the operations of companies in the market. Certain political policies into the internal market or internationalization aspects may deliver obstacles to implementation of certain strategies. B2F is not influenced by this aspect (Johnson et al., 2005).
E – Economical
Economy instability always affects the health of companies, mainly SME’s because they haven’t such a big and good financial structure, depending a lot of the demand of their actual and possible clients. Economic crises are a big factor in determining how the business may turn, the increase of prices, the downturn in demand and the bargaining power of suppliers lead to fluctuations with big consequences to the company. At the worst case scenario, employees are affected by the increase of redundancies (Wheelen and Hunger, 2011).
26 S - Social
Not only economy fluctuations but also the way how companies and individuals look at BI is the main factor of how this type of businesses may have success. For most of the companies nowadays BI is an underexplored segment. This turns the work of SME’s in this area more challenging and difficult. The short steps that companies are heading in order to understand the importance of BI in their business delay the evolution of this segment, but also the productivity of companies. This fact shows that companies nowadays don’t live without technology. It is a granted aspect; every business has a strong technology component now.
T- Technological
This leads to the need of following the evolution and the trends of technology. In BI, the need of update software’s and processes are crucial, allowing companies to be always one step ahead and to satisfy the client needs. Not only updates but the increase of BI allied to other categories as cloud storage are nowadays being an ascending trend. The fact that these clouds allow clients to store information in a quick and easy way are a factor that companies will start to acquire at a high rate.
E – Environmental
This is another aspect that does not influence the development of B2F work once it is not affected by any environmental law, high energy consumption or damage of the environment.
L – Legal
These type of projects have certain types of legal aspects when designed in certain areas. Mainly in the banking area, BI projects have to follow certain limitations when treating the information, which makes legal aspects another factor that can influence the result of projects.
27
3.1.2 Porter’s Five Forces
As we know, the technological and software market is increasing a lot, even though the recession has delayed their evolution a bit, the growth was delayed but constant. With the growth of the economy is expected Business Intelligence market to follow the trends of evolution of the country.
With this evolution, the increase of investment and trust of customers are factors that will help the market growth, but with growth comes also competitors.
Porter’s Five Forces framework allows companies to understand the attractiveness of a market segment over 5 threats: Buyers’ bargaining power, Suppliers’ Bargaining Power, the Threat of New Entrants, the Threat of Substitute Products and High level of Rivalry (Kotler and Keller, 2011).
To know the competitive forces that affect the market and its causes allow managers to understand where are the opportunities of a certain market which becomes crucial to the strategy shaping of a company and understand the potential of the market. Withal, it enables companies to understand the positioning of its competitors, which is a key factor as understand the company’s own positioning. Only after understanding how the market is what it is can a company define the strategy to increase incoming revenues and better positioning (Porter, 2008).
The strength of each force defines the limit of companies to raise prices and earn higher profits. A high force results on a threat, which is likely to reduce profits. A low force can be understood as an opportunity in which companies can earn higher profits. Together, all the five forces define the intensity of the industry. It intends to help companies to understand how small aspects can determine big differences in the company with changes induced by several industry aspects (Porter, 1998).
As in the previous section, the main source of data was the reports about the BI industry (secondary data) provided by the company and the workshops with employee’s and B2F’s CEO that seek the comprehension of the market through the experience workers in the area (primary data).
28 Buyers’ Bargaining Power
The growing bargaining power of buyers shows the unattractiveness of a market. This happens when the buyers become more concentrated, the switching costs are low, the product is undifferentiated or when the product represents a high fraction of the costs (Wheelen and Hunger, 2011).
In order to companies fight against the buyer's power, it is necessary to develop superior offers so that strong buyers cannot refuse (Kotler and Keller, 2011).
When looking into the buyers’ power in this market, we need to understand how they can have power over companies. One way is by realizing that the companies that are delivering the service are not effective and the buyer becomes also the supplier, starting to answer to the company own needs internally. That doesn’t happen in this market because BI market it’s not so easy to self-learning, and it would lead to a loss of resources over the companies when trying to solve their own necessities.
The services provided are mostly the same, the only change is the perfection how companies deliver results to the companies. This gives buyers power to decide which the best company by price or quality service is. The range of possible buyers is big presented in very different segments, having most of the times a recognizing delay of understanding how BI services can be profitable to the company.
With this, we can assume that the power over buyers is moderate, mainly because buyers have a low understanding of how BI would help companies to increase profitability delivering decision-making power over buyers.
Suppliers’ Bargaining Power
When talking about the supplier’s bargaining power, this happens when the product supplied is an important input, the suppliers are concentrated, with low competitors increasing the switching costs which allows suppliers to increase the price and decrease the quantity to supply (Kotler and Keller, 2011).
The best way to reduce the bargaining power of suppliers is by having a high number of suppliers, which allows the opportunity to have more solutions and diminish the threat over company’s profit (Barney and Hesterly, 2012).
29
In this market, there are two points that we need to take into account:
1- Suppliers supply all the base software to small companies in the market;
2- The need of SME’s to increase the software range in the several market segments.
Suppliers are the ones that supply all the base software in order to small companies to build upon them. So, if they produce what companies need and they are concentrated as producers in this market they may have a very big power over prices.
Moreover, Vendors connect also with final customers, having a big influence on the decision-making process. With this, the supplier power can be high. But, let’s not forget that in order to these programs to work they need that the small companies agree with the terms and to be present in diverse segments of a huge growing market. Supplier power can be moderate by having this necessity of partners in order to spread over the market.
In conclusion, Supplier power can vary between moderate to high depending on certain situations in the market.
Threat of New entrants
New entrants are new companies entering in a new industry motivated by the possible earnings that a certain market can provide. These entrances provide a higher competition over the market and may decrease the performance of the companies already operating in the market (Barney and Hesterly, 2012).
Industries with high barriers to entry and high exit barriers are high profitable industries, but with a big risk. It is necessary to have a good strategy and management performance in order not to suffer in a high competitive market (Kotler and Keller, 2011).
New entrants are nowadays growing in this market although is not easy to live in it. Economic stability is able to lead to an increase in investment and trust among buyers and investors, which promote the will of new entrants. But there are barriers to entry in this market. New entrants have to be careful about investment costs, the companies that are already in the market have already a competitive price in the market, and it is not easy to gain confidence without experience.
This is another factor that appears as a barrier to the entrance of new companies. Experience is a key point in this market, without previous experience in the market,
30
without connections over clients, suppliers and distribution channels is very difficult to gain terrain over competitors that are already in the market.
So the Barriers to entry are high even with the growth of the market.
Threat of Substitutes Products
Substitutes are products that satisfy the same need of the client in, possibly, some different ways with the chance of surpassing the actual product of the market by innovation or price strategy (Barney and Hesterly, 2012)
At the same time, it defines a ceiling at the price that companies can charge, reducing the profitability of companies and the overall of the market (Wheelen and Hunger, 2011).
In the BI market, there are mainly two substitutes.
One of them is Software-as-a-Service (SaaS). SaaS is nowadays searched by many companies that don't have either time or money to pay for BI consultants to gather all the information and present it. There are risks using this “easy way”. One of them is the fact that there is no data warehouse in order to gather all the information. Of course, it depends on company needs and the money they want to spend. The program can be simpler and easy to use as more little the needs of the company are. The risk is that the simplicity may not be the best choice because the needs of the company can change and the company cannot reach their objectives.
Some of this tools are Clearify Qqube, Tableau Desktop, Domo, Qlik Senses, Zoho Reports.
Self-Service software is another substitute. SaaS is a complement of Self-service software, making it available to be easy and quick to use. Information users nowadays search for tools that are easy to use, aggregate lots of data and delivers precious information. But, is not always easy to simplify vital information in order to make the tools working, being a risky choice with probabilities to fail if not used properly.
So, there is a high risk of substitutes, companies nowadays are searching for simplicity and low-cost products, which means that substitutes are gaining space in the market.
31 High level of Rivalry
The rivalry level is defined by the performance of the companies in the market by using strategies to improve their profits but also by high fixed costs or high barriers to exit the market. This leads to price wars or innovative advertising strategies increasing the investment over the market (Kotler and Keller, 2011).
The lack of differentiation of products (which leads mainly to a price wars), a slow evolution of the market (increasing the purchase of competitor’s market share) or production capacity added in large increments (possibly leading to an oversupply and a decrease in the price) are other factors that influence the level of rivalry in the market (Barney and Hesterley, 2012).
Software industry grew since the decrease of the recession in Europe. Big cities as Prague, London, Paris and Berlin compete constantly in order to grow more in this market and have more investment, and positive indicators related to the trust of investors and growth of the market were growth enhancers to this market.
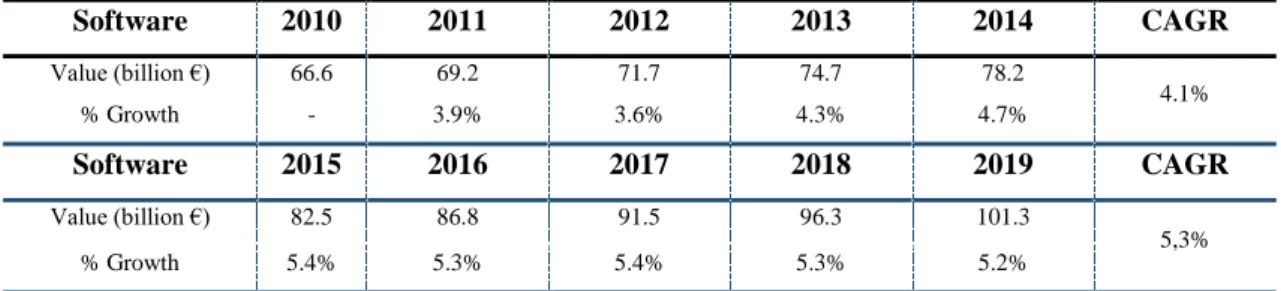
The Software market had a constant growth since 2010 in which companies started to bet and combine their services with the best software, such as Network and database management, to improve their profitability in the market, justified by a compound average growth rate (CAGR) of 4,1%. Forecasts show that the growth of this market intends to keep going increasing the CAGR of 4,1% to 5,3% until 2019.
Software 2010 2011 2012 2013 2014 CAGR Value (billion €) 66.6 69.2 71.7 74.7 78.2 4.1% % Growth - 3.9% 3.6% 4.3% 4.7% Software 2015 2016 2017 2018 2019 CAGR Value (billion €) 82.5 86.8 91.5 96.3 101.3 5,3% % Growth 5.4% 5.3% 5.4% 5.3% 5.2%
Table 1 - Software Market Growth and Forecasts (adapted from MarketLine Industry Profile – Software in Europe, June 2015)
Once B2F is an IT consultancy company, the IT Services market is also a very important aspect to consider.
32
The value (in billions of €) in the IT Services is bigger that the Software market. Even though the value is bigger, the CAGR until 2014 (2,2%) and forecasts until 2019 (2,6%) were lower than the Software market. The presence of companies in this market is bigger, and only recently companies started to focus on specific markets.
IT Services 2010 2011 2012 2013 2014 CAGR Value (billion €) 195.0 200.8 202.9 206.5 212.5 2.2% % Growth - 2.9% 1% 1.8% 2.9% IT Services 2015 2016 2017 2018 2019 CAGR Value (billion €) 195.0 200.8 202.9 206.5 212.5 2,6% % Growth - 2.9% 1% 1.8% 2.9%
Table 2 - IT Services Growth and Forecasts (adapted from MarketLine Industry Profile – IT Services in Europe, June 2015)
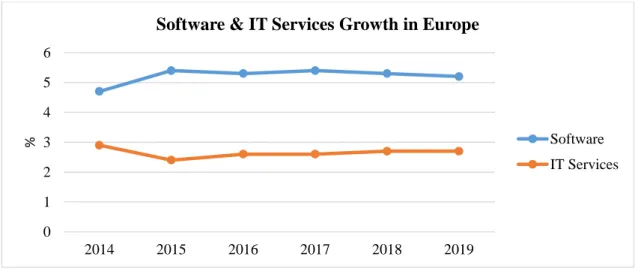
Companies tend to increase their presence in the IT consulting segment and become specialists in order to achieve a bigger audience and increase the trust of their clients in the services.
Chart 1 - Software and IT Services growth in Europe (adapted from MarketLine Industry Profile - IT Services in Europe, June 2015 and MarketLine Industry Profile – Software in Europe, June 2015)
The increase in the GDP at the Euro Area was followed by Portugal, with the tendency to grow at a low rate. This indicator shows that countries are starting to leave recession,
0 1 2 3 4 5 6 2014 2015 2016 2017 2018 2019 %
Software & IT Services Growth in Europe
Software IT Services
33
improving their trust in the market, but with careful investments in more specific markets as IT and Software.
Chart 2 – Portugal and Euro Area Grow Domestic Product forecasts (adapted from Banco de Portugal, Projections for the Portuguese Economy: 2015 – 2017
According to IDC – Information and Communications Technology Market in Portugal (March 2014), IT Services in Portugal will maintain the world’s market flow and increase at a CAGR of 1,7%. Nowadays it represents 15.8% in the ICT market. Forecasts tend to increase the weight of IT Services in Portugal to 40% until 2020.
With a big market in the IT and Software market and the continuous demand increase of these markets, BI starts to grow along with them. The level of rivalry is increasing nowadays, now more because the economy is starting to grow again. The main companies that are providing these services are small and medium companies, which are divided all over the country.
The level of rivalry can be considering high, once the size of most of the companies is the same and each one of them tries to gain share market to their competitors by innovating, by being partners of Vendors like Microsoft, IBM, Oracle. This many times allows these small companies to increase their portfolio of clients and gain more trust by having such a big company as a partner.
0 0,5 1 1,5 2 2,5 2014 2015 2016 2017 %
Grow Domestic Product
Portugal Euro Area
35
3.1.3 Strategic group
Defining a strategic group in order to understand the direct competitors and which similarities competitors may have with our company. Competition is extremely important in order to reach the highest level of information about competitors and understand which are the strong and weak points in order to define strategies to improve the position in the market (Peña, Jamilena and Garcia, 2015).
Using the Sabi platform (secondary data) at FEP’s online library, it was possible to reach new data about the weight of the BI companies in Portugal and the income revenue presented below. It is clear that the overall of the companies are present at the South of Portugal, a region of a possible growth in this area most of all because of the business community that is operating in that region.
Chart 3 – % of competitors operating in the North and South of Portugal
The main aspects that allow these companies to be in the same strategic position are the similarities of services and industrial approaches. The fact that the majority of these companies are SME’s as B2F, shows that the modus operandi of these companies are not so distant from each other. Of course, there are differences among how companies act with clients and the existence (and not existence) of developed products from the company.
As B2F, all the other companies operate in the BI segment, attending also tailored development at the software area. Along with the similarities at services, the industries
38% 62% 0% 10% 20% 30% 40% 50% 60% 70% North of Portugal South of Portugal Region
36
that these companies operate are very similar and some of the clients are the same. When looking to the Operational Revenue of last year we find differences amongst earnings of each company. Some of those, because companies have a bigger support by vendors and are subsidiaries of a bigger company that entered in this segment. Furthermore, some of the competitors also operate abroad, which allow them to have a bigger amount of operational revenue.
NAME LOCAL OPERATIONAL REVENUE
(2014) B2F ERMESINDE 732 936 € WEDO MAIA 40 542 769 € BI4ALL LISBOA 3 109 856 € CULTO DO BI PORTO 56 250 € DEVSCOPE PORTO 1 726 380 €
NOVABASE SERVIÇOS - SERVIÇOS DE GESTÃO E
CONSULTORIA, S.A. LISBOA 10 818 056 €
TOTAL 56 986 247 €
Table 3 - B2F competitors in the BI market (Values extracted from “sabi” in November 2015)
The total value of the defined market is from 56 986 247€, a small value of the BI market in the world and in Portugal. This group was selected based on the similarity of services, proximity of revenues and direct competition in the achievement of new projects. Despite few of the competitors (for example WeDO) have a big difference in the revenues, they are active competitors in seeking and compete for new projects in the market (especially in the North of Portugal).
Additionally, we also compared B2F and its competitors on the basis of their Technical Skills and Communication strategies.
Technical Skills stands out as the capability to answer the client’s problems in the best and quickest way possible, translating the flexibility of the software and service to the client’s market as also the company culture of operation.
37
Communication points out the “noise” of the company in the market. It intends to evaluate the level of communication in the market using several tools to accomplish the best awareness of the brand as Social Media, events, workshops, BI and IT conferences and many others.
In order to evaluate what is B2F positioning in a proxy of the perception of customers, meetings with employees and B2F’s CEO and a direct research at competitors and B2F websites was made in order to compare and define the positioning of each company at the strategy group defined. An evaluation from 1-6 (1 – Very Bad; 2 – Bad; 3 – Average; 4 – Good; 5 – Very Good; 6 – Excellent) was defined to establish the position of the company over its competitors and with it understand the weaknesses and strong points of the company.
Chart 4 – B2F strategic group companies positioning
B2F positions itself as a low awareness company, but with an average technical skill in
the market. It allows clients to describe their problem and needs in order to develop projects within the specific needs. This shows the wide capacity over BI software, based mainly on the experience and knowledge of its employees. The awareness of the company is low mainly because of lack of communication over the market. The communication of the company is mainly a Word to Mouth, based on the experience and connections in the
0 1 2 3 4 5 6 0 1 2 3 4 5 6 Co m m u n ica tio n Technical Skills
38
market of its CEO. The presence in social media and conferences were almost none over the past 7 years.
CULTO DO BI and BI4ALL are the companies that are in the closest position to B2F.
CULTO DO BI have a low awareness in the market. It’s a company with only a year of
existence and is trying to conquer market share. Their software is similar to other companies having a range of possibilities for Business Intelligence.
BI4ALL have a close level of technical skills but has a high awareness when compared
to B2F and CULTO DO BI.
The culture practiced by BI4ALL creates different dynamics over the market, especially in the young public, being this public future employees of future clients.
WEDO has a high awareness in the market mainly because it is owned for one of the
biggest companies in Portugal, which allows them to have a huge presence inside and outside of Portugal. At the same time, WEDO developed a product for the communication segment. This allows them to be one of the main companies to develop solutions for that specific segment, but to be limited to operate in the general BI market.
DEVSCOPE have a higher awareness when compared to B2F or the companies at that
level because of close contacts with entities that create that kind of awareness as Câmara Municipal do Porto. Although they have a level of awareness around the market, their technical skills tend to be limited to certain segments of the market.
NOVABASE is the best-positioned company in the market according to these two
factors. It has a high awareness in the market and operates in many segments of the market. This allows the company to have a stated position in the market and to be one of the highest competitors at this moment with a big presence in the social media, conferences, and workshops. Technical skills are presented over the several solutions delivered for the vast segments of the market. It is one of the biggest company in Portugal operating in the BI market having already a strong presence and experience in this matter.
B2F must increase the awareness in the market through a well-structured marketing plan, taking advantage of the opportunities in the market and of the actual tools that SME’s need to use to improve the position in the market.
39
Despite the communication aspect, B2F needs to constantly improve his technical skills improving the range of areas of operation, producing price strategies to different segments and publics in order to move to a higher position, key-points that will be described abroad. After the implementation of these strategies B2F should be able to move its strategical position to higher one.
Chart 5 – B2F positioning after implementing marketing strategies 0 1 2 3 4 5 6 0 1 2 3 4 5 6 Co m m u n ica tio n Technical Skills
41
3.2 Internal Environment
3.2.1 B2F’s History
B2F is a company that operates in the Information Technology (IT) industry, with the main focus in Business Intelligence (BI) software development. It has a strong history in complex projects, including the development and implementation of client-specific solutions, always with an agnostic position to technology – key to a valuable proposition focused on the client. Recently it had invested in the tailored development of applications.
It was created in the year 2006 with the main focus of entering the market of BI supported in their know-how. The company began operating with two workers and was increasing its clients mainly through word of mouth. This type of prospecting is still the main marketing tool used nowadays, but the company is trying to change the way they expose themselves in the market, changing not only the communication strategy but also their culture. In 2014 it suffered a rebranding in the logo in order to become more technological and updated with the core business of the company. Due to the fact that the connection with the clients is almost totally personal, the impact to the overall market was low. It is having a sustainable growth along the years, always keeping a constant teamwork, an increase in the knowledge and competencies of its team and a support of the CEO and only stakeholder.
The culture of the company leans on a very flexible and elaborative way of reaching the client needs. They operate the project in the client’s facilities, not in B2F’s facilities. This allows B2F to create a connection with the client by working in their space and attend to their needs, which delivers an image of trust to their clients and allows them to keep a connection in a long term.
Summing up, B2F is a company that has already many years of experience in the BI market, fulfilling its success with a range of big clients over several market segments.
The growth of the company has lead to a higher acquisition of new employees to be able to meet the customer’s needs.
The next chapter will describe the company’s internal and external analysis, searching to find the opportunities and threats of the BI market in Portugal, strengths and weaknesses of the company in order to develop strategies to reach the main objectives of the company.
42
3.2.2 Mission, Vision, Values
B2F intends to be the best BI company in the North of Portugal, a direct statement of the B2F’s CEO, supporting its clients creating knowledge over company’s data, with the objective of allowing a better decision-making process to increase the competitive advantage of the client and the growth of income revenues.
With the vision to “support, innovate and promote the modernization of corporative structures”, B2F intends to respect and pass on its values by exceeding the client’s expectations, improving the ability to reach to higher Key Perming Indicators and promote team spirit and knowledge between employees in the different projects.
43
3.2.3 VRIO Analysis
The VRIO Analysis is used to evaluate company’s resources and capabilities and the potential of those resources to reach certain objectives and generate competitive advantages. This analysis can be exploited by the resource-based view and by the positioning view (Barney and Hesterley, 2012).
VRIO’s framework it’s based on four questions: Value, Rarity, Inimitability, and Organization.
V – Value of Strategic capabilities
In this question, we need to understand if the firm has resources and capabilities to exploit an external opportunity or neutralize an external threat. One way to understand if the company is using these resources is to check if the company has increased in net revenues or decreases in net costs. This will show that these resources have a high power in the company fluctuation of earnings. Also, this question of Value allows understanding which are the internal strengths and weaknesses of the company.
R – Rarity
Even though we consider a valuable resource in the company, this resource will only lead to competitive advantage if no one has it in their portfolio. This leads us to Rarity. A resource that is exclusive to a company, and which no other company has it’s called rare and may lead to a competitive advantage in the market. The “degree” of rarity and the potential to lead to a competitive advantage varies from situation to situation.
I – Inimitability
Along to the value and rarity of certain resources, it is necessary, in order to obtain a sustained competitive advantage that these resources are inimitable and lead to a cost disadvantage amongst competitors to develop that resource. There are two ways possible to imitate the resource.
44
One is by duplicating the resource of a certain company. If the cost of duplicate that resource is not too high, then the sustained competitive advantage of a certain company is only temporary. Also, if developing or duplicate a certain resource is to costly, competitors may option by a different strategy.
A second way to imitate a certain resource is by substitute it for a less costly and that has almost every aspect of the inimitable resource. This way, and if the substitute is very good, the competitive advantage will be, again, temporary.
O – Organization
Despite all of these resources and aspects mention before, it is necessary that the company is organized in order to exploit them. Companies organization is often considering as complementary because alone they cannot generate competitive advantage but when combined with other resources it allows the company to realize its full potential for competitive advantage.
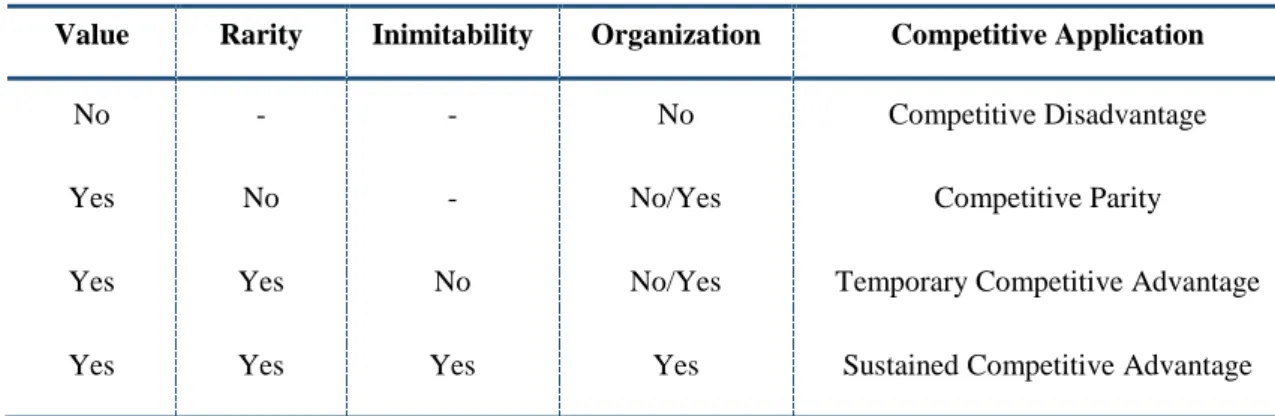
Value Rarity Inimitability Organization Competitive Application
No - - No Competitive Disadvantage
Yes No - No/Yes Competitive Parity
Yes Yes No No/Yes Temporary Competitive Advantage
Yes Yes Yes Yes Sustained Competitive Advantage
Table 4 - VRIO Framework (adapted from Barney and Hesterly, 2012)
Next, it is presented the Technical Skills (section 4.2.2.1) and the Human Resources (section 4.2.2.2), the main resources that allowed B2F to grow and increase market share. This analysis was based in internal data gathered from meeting with B2F’s CEO to discuss the most important resources and its influence in the competitive advantage of the company.
45
3.2.3.1 Technical Skills
B2F’s most valuable skill is its worker’s ability to analyze and produce solutions through its experience and flexibility of analysis and creativity.
Using the skills of several experienced workers in the market and operating at B2F, allows the company to create its own academy, training the newest workers with the different strategies to operate at the different challenges in the market.
Flexibility tends to be another crucial aspect of delivering a successful service to its clients. B2F intends to deliver a perfect service in order to retain their clients and acquire more in the different segments of the market. According to this standards, the company is constantly developing new strategies to reach to its clients’ needs by exploring different methods of operation.
Different methods are achieved using different software with other distinct technical features. The use of Microsoft, IBM or Oracle software allows B2F to answer to different needs with specific solutions delivering a very flexible range of answers to the clients’ needs.
Amongst their technical skills, B2F has developed a product that is now in constant updates, being updated through constant feedback from workers but also their clients. The IG Portal consists in a Portal of information that centralizes data of the company, allowing to store big amounts of information and compatible with the recent features of Microsoft Office 365, enabling the client to read, store comments to certain documents, edit and analyze from different features in the IG Portal.
The fact that the IG Portal is compatible with the recent Microsoft Office 360 is a great aspect, increasing the competitive advantage of the company over its competitors. The only companies that have similar products like this are vendors, which practice a bigger price.
46
3.2.3.2 Human Resources
B2F has nowadays a total of 21 employees. This number has been growing amongst years mostly because of the increase of projects and acknowledge of the company over clients.
The company does not have an employee acquisition strategy. Over the years, the needs of the company are the main factor that triggers the acquisition of new human resources, which were always fulfilled through internships and entry-level positions. It has been a sufficient method to help the company to satisfy its needs, help students and other workers to have their first, or a current job and intensify the BI segment in the market.
There were 22 workers in the company with an average of 31 years old, which did not change from 2014 to 2015.
Chart 6 – B2F employees number in 2014 and 2015
The information over the costs and earnings per employee is used in order to obtain a proxy of the company operational costs. Companies in BI, in general, don’t have many costs on hardware as the work is developed on the client’s equipment. The main focus lies on people with skills in this area, using employee costs as operational costs.
1 7 4 0 2 1 4 10 3 1 2 1 0 2 4 6 8 10 12 20 - 25 26 - 30 31 - 35 36 - 40 41 - 45 46 - 50
Employee Number
2015 201447
Looking into the data, we see that in the year where there were fewer employees in the company (2013) the earnings and the costs were higher than in any other year. This may lead us to conclude that the employees that were in the company were more valuable and produce more. Also, the projects that were present in that year could be less and more valuable, which may lead to an increase in the earnings of the company.
Chart 7 – B2F’s employee financial ratios
Analyzing these values, we see that the number of hours that the company needed to sell were higher in 2013, mainly because of the number of employees were low compared with other years. The number of hours to sell took a big decrease in 2014 after the increase of employees. At the same time, the number of projects that the company developed in that year might have been one factor that diminished the number of hours to sell.
2012 2013 2014
Margin per Employee 15 694,70 21 156,80 22 002,40
Number of hours to sell 6344 7280 5746
Number of hours to sell per
Employee 423 662 383 0,00 5 000,00 10 000,00 15 000,00 20 000,00 25 000,00 E M PL O Y E E R AT I O S
49
3.2.3.3 Summary
In order to understand the contribute of each of this resources to the competitive advantage of the company, it was applied the VRIO framework.
The Human Resources present the experience of the employees at B2F and the Technical Skills present the flexibility to use different software and capability to solve different problems using that software.
Resources Value Rarity Inimitability Organization
Human Resources Yes No - Yes
Technical Skills Yes No - Yes
Table 5 - B2F’s resources analysis
After an analysis of the previous resources we reach to the conclusion that B2F has a competitive parity.
The value of B2F is mainly focused on its human resources. Their experience and flexibility of operation to the different obstacles that are constantly present in the market turn their workers in the most valuable resource in the company.
B2F is being able to exploit its resources with the constant growth of the company in the market. With the multiple large-scale projects that B2F developed throughout the 10 years’ operating in the BI market, they built the ability to exploit its resources at the highest level.
51
3.2.4 Client Portfolio
The client portfolio analysis intends to reach to some conclusions about the risk of the losing some clients and understand if it is necessary to diversify the risk in order to prevent future possible complications to the company. For this, it was made a Workshop with the present theme, with the presence of the company’s CEO, in order to achieve a wider view of the clients’ performance over the company.
The clients of B2F are situated in 8 segments with a total of 50 companies.
From the 8 segments (Industry, Retail, Banking & Insurance, Utilities, Pharmaceutics, Laboratory, Technological, and Telecommunications), Industry is the one that has more weight in the company (21 companies in this segment). The clients that are presented below are actual and past clients.
Chart 8 – B2F Client weight in market segments
When looking to the weight of the clients in the financial perspective of the company, it is seen that there is the rule of 80-20, in which 20% of the clients represent 80% of the operational revenue of B2F.
If we look to the clients in every year from 2012 to 2014, we see that the number of clients has been increasing over this period. This shows the small growth of B2F in time, but also an effort to diversify the client portfolio and the weight of the area of operation. Over the years, Industry is still the main segment where B2F gains more market share and
42% 22% 6% 2% 2% 12% 12% 2% 0% 10% 20% 30% 40% 50% 2015 2015