Consolidation of airlines in
Europe. Potential acquisition
of Norwegian by EasyJet
Dmitrii Ponomarev
Dissertation written under the supervision of António Borges de
Assunção
Dissertation submitted in partial fulfilment of requirements for the MSc in
Finance, at the Universidade Católica Portuguesa, June 2020.
2
Abstract
Europe is one of the largest airline markets with a significant share of passengers withing Europe being flown by low-cost carriers, while long-haul passengers are almost entirely transported by traditional flag carriers.
While Full-Service airlines have been actively trying to penetrate the low-cost market, Norwegian and some other LCCs entered the long-haul market. As this industry is risky and capital extensive, while also being highly competitive, we may expect a consolidation of European airlines. A merger between the second-largest low-cost carrier in Europe EasyJet and smaller but operating rather unique business model Norwegian would allow a boost of passengers for both airlines, open new markets, and deliver significant revenue and cost synergies especially on the side of struggling to fill their planes and maintain its margins Norwegian, and would create a new second-largest airline in Europe. We expect a transaction between two Airlines to happen in the last quarter of 2020, EasyJet is suggested to pay the premium of 20% over the market price, the total purchase would cost ₤1040m and generate ₤524m in Net Synergies after transaction costs. Suggested financing assumes using existing cash, debt, and stock issuance. The industry is highly dependent on the developments related to the COVID-19 outbreak, therefore we suggest constant revaluation of the deal as long as the new information appears..
3
Abstrato
A Europa é um dos maiores mercados da aviação, com uma parte significativa dos passageiros a serem transportados por companhias low-cost, no entanto os passageiros de longo curso viajam maioritariamente usando transportadoras nacionais.
Enquanto as companhias aéreas de serviço completo (LCCs) têm ativamente tentado penetrar o mercado low-cost, a Norwegian bem como outras empresas aéreas low-cost entraram no mercado de longo curso. Tratando-se de um mercado ariscado, com elevada intensidade de capital e altamente competitivo, é expectável que várias fusões aconteçam entre empresas europeias de aviação. A fusão entre a segunda maior companhia low-cost aérea europeia, a EasyJet, e uma companhia mais pequena, mas com um modelo de negócio único como a Norwegian levaria a um aumento do número de passageiros, à entrada em novos mercados, ao aumento significativo das receitas e a sinergias de custos, criando a segunda maior companhia aérea europeia. A acontecer no último trimestre de 2020, a aquisição da Norwegian pela EasyJet pelo valor total de ₤1040M deverá geral sinergias de ₤524M após custo de transação, usando um prémio de aquisição de 20%. O financiamento sugerido assume o uso de reservas de liquidez, dívida e emissão de ações. Este setor é altamente dependende dos acontecimentos relativos à pandemia da Covid-19, como tal, aconselhamos a reavaliação desta aquisição à medida que nova informação relevante se materialize.
4
Acknowledgements
I cannot express enough gratitude to my supervisor António Borges de Assunção for his continued support and encouragement, valuable insights and availability to discuss my doubts and ideas in this project. I offer my sincere appreciation for the learning opportunities provided by him.
This project would not be possible without the great team of teachers at Catolica-Lisbon that were always ready to introduce me to a new challenge and widen my knowledge, as well as my colleagues who were an exceptional part of this journey.
Finally, I am extremely grateful to my friends and family for their love, caring, and sacrifices for education and preparing me for my future. You helped me when times were rough and never left me behind. It is great to have you by my side.
5
Table of Contents
Abstract ... 2
Abstrato ... 3
Acknowledgement ... 4
List of Tables and Figures ... 7
Glossary ... 9
1. Executive summary ... 10
2. Literature review ... 11
2.1 Mergers and Acquisitions... 11
2.1.1 Motives for M&A ... 11
2.1.2 Deal process ... 11
2.1.3 Deal structure ... 12
2.1.4 Synergies ... 12
2.1.5 M&A in the Airlines industry ... 13
2.2 Valuation methods ... 14
2.2.1 Intrinsic valuation ... 14
2.2.2 Relative valuation ... 16
2.2.3 Conclusion ... 17
3. Macroeconomic and industry overview ... 18
3.1 Macroeconomic situation in the World and Europe... 18
3.2 Global Industry overview ... 20
3.3 European Industry overview ... 22
3.4 Coronavirus impact on aviation in 2020 ... 23
3.5 Segmentation in European aviation ... 25
3.6 Airline consolidation in Europe ... 26
3.7 Deal rational within industry trends ... 27
4. Company overview ... 28
4.1 EasyJet ... 28
4.1.1 Company ownership ... 28
4.1.2 Share price development ... 28
4.1.3 Operating revenue ... 29
4.1.4 Operating costs ... 30
4.1.5 Key Financial Indicators ... 31
4.2 Norwegian Air Shuttle ... 33
4.2.1 Company ownership ... 33
4.2.2 Share price development ... 33
6
4.2.4 Operating costs ... 34
4.2.5 Key Financial Indicators ... 36
5. Valuation ... 38
5.1 EasyJet ... 38
5.1.1 Capacity ... 38
5.1.2 Revenue ... 39
5.1.3 Operating costs ... 40
5.1.4 Capex, Depreciation and Net Working Capital ... 40
5.1.5 WACC. ... 41
5.1.6 Discounted FCFFs. ... 41
5.1.7 Trading multiples analysis ... 42
5.1.8 Valuation results ... 43
5.2 Norwegian ... 45
5.2.1 Capacity ... 45
5.2.2 Revenue ... 46
5.2.3 Operating costs ... 47
5.2.4 Capex, Depreciation and Net Working Capital ... 47
5.2.5 WACC ... 48
5.2.6 Discounted FCFFs. ... 49
5.2.7 Trading multiples analysis ... 49
5.2.8 Valuation results ... 50
6.Valuation of the merged company and transaction process ... 52
6.1 Merged company before synergies ... 52
6.2 Potential synergies and merged airlines ... 52
6.3 Transaction ... 53
6.4 Risk analysis ... 55
7. Conclusion ... 56
Appendices ... 57
7
List of Tables and Figures
Figures Page
Figure 1. GDP development of selected markets 18
Figure 2. Trade, Investment and Consumption development 19
Figure 3. Tariff impact on global trade 19
Figure 4. Monthly loss of GDP as a result of lockdown, OECD data 20
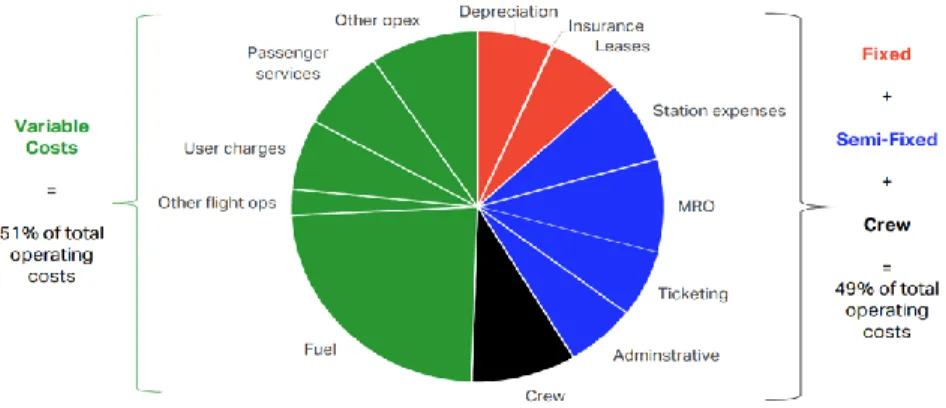
Figure 5. The cost structure of an airlines business, IATA data 22
Figure 6. Brent crude oil price development and forecast 22
Figure 7. Worldwide RPKs development 24
Figure 8. Daily flight number development 24
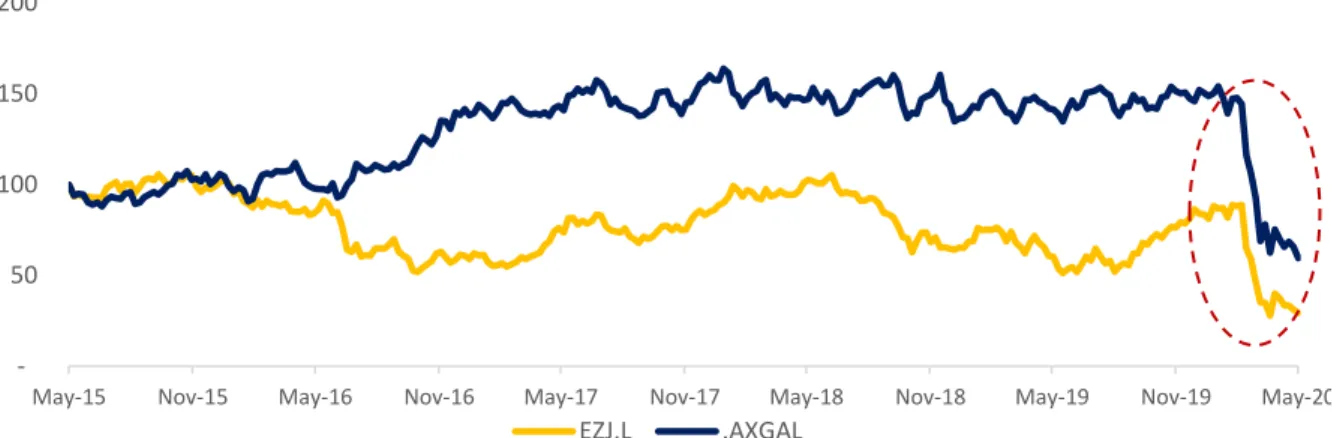
Figure 9. EasyJet price development versus NYSE Arca Global Airline Index 29
Figure 10. EasyJet revenue breakdown 29
Figure 11. Revenue drivers growth for EasyJet 30
Figure 12. Operating costs structure in FY2019 for EasyFet 30
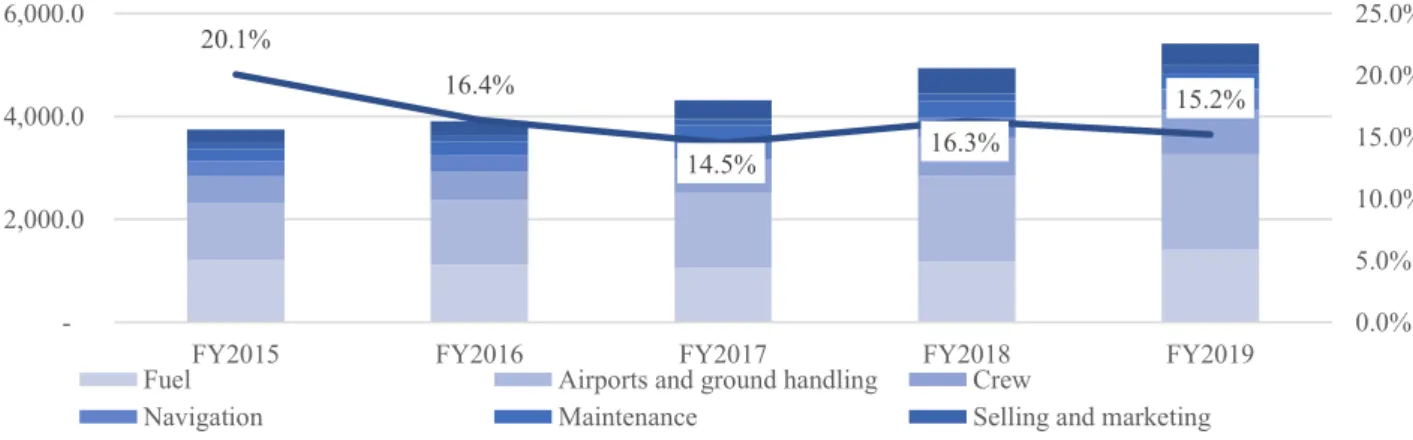
Figure 13. Operating costs development for EasyJet 30
Figure 14. Operating costs per passenger for EasyJet 31
Figure 15. Norwegian share price development versus NYSE Arca Global Airline Index 33
Figure 16. Norwegian revenue breakdown 34
Figure 17. Revenue drivers growth for Norwegian 34
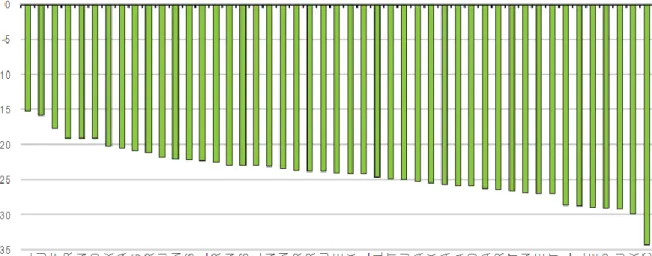
Figure 18. Operating costs structure in FY2019 for Norwegian 35
Figure 19. Operating costs development for Norwegian 35
Figure 20. Development of operating costs per passenger for Norwegian 36
Figure 21. Fleet and capacity development for EasyJet 38
Figure 22. Load factor and carried passenger development for EasyJet 39
Figure 23. Revenue development for EasyJet 39
Figure 24. Projected Capex and depreciation of EasyJet 41
Figure 25. Reconciliation of valuation results for EasyJet 44
Figure 26. Capacity drivers of Norwegian 45
Figure 27.Ticket revenue drivers of Norwegian 46
Figure 28. Forecasted revenue of Norwegian 47
Figure 29. Forecasted Capital expenditure and depreciation 48
Figure 30. Reconciliation of valuation results for Norwegian 51
Figure 31. Synergies analysis 53
8
Tables Page
Table 1. RPK development 21
Table 2. EBIT margin development 21
Table 3. Expected annual growth of passenger aviation 23
Table 4. Major shareholders of EasyJet 28
Table 5. Aircraft owning/leasing expenses of EasyJet 31
Table 6. Key financial indicators of EasyJet. 32
Table 7. Major shareholders of Norwegian 33
Table 8. Aircraft owning/leasing expenses of Norwegian 36
Table 9. Key financial indicators of Norwegian 37
Table 10. Operating costs drivers development of EasyJet 40
Table 11. Discounted Cash Flow model for EasyJet 42
Table 12. Share Price sensitivity analysis for EasyJet 42
Table 13. Trading multiples analysis for EasyJet 43
Table 14. Discounted Cash Flow model for EasyJet with Terminal Multiple 43
Table 15. Operating cost drivers of Easyjet 47
Table 16. Discounted Cash Flow model for Norwegian 49
Table 17. Share Price sensitivity analysis for Norwegian 49
Table 18. Trading multiples analysis for Norwegian 50
Table 19. Discounted Cash Flow model for Norwegian with TM 50
Table 20. Transaction details 54
Appendices Page
Exhibit 1. Largest airline groups in Europe 57
Exhibit 2. WACC calculation for EasyJet 58
Exhibit 3. WACC calculation for Norwegian 58
Exhibit 4. Unlevered beta calculation for Norwegian 58
Exhibit 5. Projected financials of EasyJet 59
Exhibit 6. DCF model of EasyJet, company data 60
Exhibit 7. Capex and Working Capital forecast for EasyJet 60
Exhibit 8. Projected financials of Norwegian 61
Exhibit 9. DCF model of Norwegian 62
Exhibit 10. Capex and Working Capital forecast for Norwegian 62
Exhibit 11. Benchmark Analysis, Part 1, Thomson Reuters Data 63
Exhibit 12. Benchmark Analysis, Part 2, Thomson Reuters Data 64
Exhibit 13. Projected financials of Merged company without taking into account for transaction details
65
Exhibit 14. WACC and Tax rate calculation for the merged company 66
Exhibit 15. Long-haul network of Norwegian 66
Exhibit 16. Short-haul network of EasyJet 66
Exhibit 17. Deal summary 67
Exhibit 18. EPS Dilution analysis 67
Exhibit 19. Ownership Dilution analysis 67
9
Glossary
Term Definition
A Actual
APV Adjusted Present Value ASK Available Seat Kilometers ATC Air Traffic Controller
Block hour Time since closure of doors until opening, measures utilization of aircrafts Capex Capital Expenditures
CoD Cost of Debt
CoE Cost of Equity
CY Current Year
DCF Discounted Cash Flow
E Expected
EBIT Earnings before interests and taxes EBITDA EBIT + depreciation and amortrization EBITDAR EBITDA + rental costs
EPS Earnings Per Share
EV Enterprise Value
EZJ EasyJet
F Forecast
FSC Full Service Carrier
FY Fiscal Year
GBP Pound sterling
GDP Gross Domestic Product
H1 First half of a year
H2 Second half of a year
IFRS International Financial Reporting Standard
LCC Low Cost Carrier
Leg One segment of a flight
Load-factor RPK/ASK or Passengers Carried/Seats Flown, measures how full is an aircraft
LTM Last Twelve Months
NAS Norwegian
ND Net Debt
NOK Norwegian Krone
NWC Net Working Capital
PP&E Property, Plant and Equipment
PV Present Value
RPK Revenue Passenger Kilometers
TGR Terminal Growth Rate
USD United States Dollar
WACC Weighted Average Cost of Capital
10
1. Executive summary
Airlines are a very important sector in the modern economy that allows the connection of people and good across the world and is one of the pillars of globalization. This industry is risky due to high capital intensity and a high proportion of fixed costs. In order to become more efficient and create additional value for shareholders, airlines often collaborate via the creation of alliances and mergers. In this paper, we suggest that a potential deal between two large European low-cost airlines, EasyJet and Norwegian, should happen in the last quarter of 2020. Our proposed purchase price per share of Norwegian is ₤0.53, corresponding to a 20% premium over the closing price as of May 15th, 2020. The total cost of the deal is ₤1040m including ₤54m in advisory fees. In order to proceed with the transaction, we suggest using ₤300m cash from the current EasyJet balance, issuance of ₤592m in debt, and stock issuance for the remaining part. This merged would generate ₤524m in net synergies and be accretive for shareholders EPS starting in 2022. The industry is highly dependent on the developments related to the COVID-19 outbreak, therefore we suggest constant revaluation of the deal as long as the new information appears.
EasyJet is the second-largest low-cost airline in Europe that operates its short-haul flights connecting people in almost every country in Europe, the Middle East and Northern Africa and looking for additional ways to increase its earnings in the region with limited airport capacity, while Norwegian provides both short and long-range services, but also troubles to have their planes filled while maintaining its fares. Our analysis justifies this transaction as it would provide significant revenue synergies due to access to new markets, network optimization, and joint pricing, as well as costs synergies on the sales, marketing, and general expenses.
In section two we discuss common valuation techniques and give an overview of typical M&A process and characteristics, section three provides an analysis of current macroeconomic and industrial trends, section four contains a description of businesses of the companies, and analysis of their operating and financial performance. Section five provides a valuation of both companies standalone and a forecast of their performance for the next years.
The main question of the paper is whether EasyJet should proceed with this deal and if the synergies justify the premium paid. Answer to this question can be found in section six where we analyse the merged company and value potential synergies, as well as provide suggestions for the transaction process.
11
2. Literature review
2.1 Mergers and Acquisitions
Mergers and acquisitions are highly technical, complex, and expensive processes that most companies would not really initiate, but they must. Companies living in a world of macroeconomic instability, changing customer priorities and globalization have no better way to grow their operations than engaging in costly deals. For them, it is a way to reinvent themselves and adapt to a new environment (Bruner, 2004).
2.1.1 Motives for M&A
There are no two identical M&A deals, thus there is a countless number of unique combinations of reasons to do this type of deal. A lot of researches tried to tackle this problem, for example, Trautwein (1990) provided efficiency, monopolization of the market, empire-building among the other theories, while Berkovitch and Narayanan (1993) in their article tried to classify all the reasons into synergy, agency and hubris buckets categories. Mukherjee, Hiymaz and Baker (2004) show results of a CFOs survey on their opinion on M&A where most respondents state synergy as the main rationality behind their deals, while the second most often given answer is related to potential diversification benefits, and for some CFOs the deal was necessary in order to change the structure of the company or simply use excess cash.
2.1.2 Deal process
In order to achieve the aforementioned goals, more than just buying a company is required. Ashkenas, DeMonaco, and Francis (1998) describe a typical M&A process, using GE Capital as an example. This company adopted the Pathfinder Model which was based on industry best practices to make the acquisition process go smoother. The first stage is everything that happens before the actual acquisition. Here the company performs due diligence of a potential target, engages in negotiation with owners, and finally closes the deal. In the second stage, the foundation is being built. It includes integration strategy forming, the orientation of managers to a new culture, and their following engagement. After that the company enters the third stage of the process where the strategy is finally being rapidly implemented, progress is constantly being evaluated and feedback is used to adjust the plan. Having the integration almost finished, the company enters the stage of assimilation involving long term plan evaluation and adjustments, destruction of former culture (by using education centers and managers exchange), and, finally, capitalization on success.
12
2.1.3 Deal structure
After a company has decided on a potential target, it should make one more important decision. Deal structuring is known as a process of selecting a payment form or a mixture of forms, and merger structure to minimize all potential tax consequences of the deal, while still complying with relevant regulation and not giving away a lot of possible future benefits of the merger (DePamphilis, 2014).
In the past, the choice of payment form was mostly between purely cash and purely stock, but as M&A activity has experienced significant changes in the last decades, more and more deals are done using a mixed form of payment. Boone, Lie, and Liu (2014) in their work describe a surge of choice of mixed forms from 10 to 30%, while the stock form of payment, after being the most popular form in the 90s with a share of 60%, dropped to just 20% nowadays. On the contrary, pure cash payment experienced its best years and doubled to 50% compared to the 90s.
Cash is the best option when the acquirer has significant excess cash reserves, is able to borrow sufficient amounts of funds quickly and with attractive rates, thinks that its shares are undervalued, or doesn’t want to dilute ownership. Borrowing funds is also used when there is a demand for changing the leverage level of the deal and the combined company. Stocks are a likely choice when the acquirer’s stocks are assumed to be overvalued or there are constraints on new debt issuance. For the sell-side, shares can be especially attractive in case of high future growth expectations. Moreover, stock payments allow parties to split the potential risks of the deal. Besides cash, stocks, and their mixture, real estate, intellectual property, royalties, and other assets can be used (DePamphilis, 2014).
Boone, Lie, and Liu (2014) find evidence supporting adverse selection theory stating that companies tend to choose stock payments over cash in times when there is a lot of valuation uncertainty regarding the future of the acquirer or target. Additionally, in their work, they find a direct relationship between capital gain tax rate and share of purely cash deals.
2.1.4 Synergies
As we said before, many managers see synergies as the main rationality behind the deal. Damodaran (2005) describes synergy as the additional value that is generated by the combination of two firms when this combination creates opportunities that were not accessible to two separate businesses. Synergies can usually be divided into operating and financial synergies.
13
Operating synergies are giving the combined firm a possibility to increase operating income or accelerate growth while keeping existing assets unchanged. Most commonly operating synergies include:
1. Economies of scale making a combined firm more cost-efficient and as a result generating higher profits. Most commonly observed in horizontal mergers.
2. Greater pricing power resulting in decreased competition on the market and a higher market share of a combined company. This type of synergy is more likely for oligopolistic markets and horizontal mergers.
3. Combination of strength. This type of synergy is possible to achieve in basically any type of a merger when one company has a remarkable strength in one function that another firm lacks.
4. Higher growth in a new or existing market. This is a very likely scenario in cross border mergers when a large multinational corporation enters new markets and can boost its sales via cooperation with some well-known local players.
The second type of synergies is related to higher cash flows of a merged firm or lower cost of capital and is called Financial synergy. Typically, they can be viewed in the following forms:
1. A merger of a firm holding high cash reserves with a cash strapped firm that is engaged in high-yield projects. As an example, the acquisition of tech start-ups by tech giants from Silicon Valley.
2. A combined business may result in more stable and predictable operating cash flows, which will result in higher borrowing abilities of a merged firm. Subsequently, it might create tax benefits that translate into a lower cost of capital.
3. Tax benefits can be extracted by writing up assets of an acquired company or using net operating losses to decrease taxes paid by a profitable acquirer.
4. One of the most controversial sources of financial synergy is diversification. While, for public companies, investors can achieve their diversification goal more efficiently by investing in different companies and sectors, private company holders can benefit more from diversification of their business.
2.1.5 M&A in the Airlines industry
Unlike many other industries, airlines have always been very keen on collaborating with each other. One of the forms of collaboration was the creation of Alliances1 since the 90s. Initially,
the idea of this collaboration was to get as many passengers to as many destinations as possible
1 European Competition Authorities define alliance as cooperation between airlines that includes integration of
14
and all airlines tried to get new partners onboard (Doganis, 2005). Overall, this should result in economies of traffic density (increasing load factor, aircraft employment), optimization of their costs (fleet optimization, joint purchases, promotional campaigns), quality and marketability of services enhancement, and boost customer loyalty. Moreover, Alliances also help to overcome regulatory risks and constraints, as airlines are one of the most regulated companies in the world and dealing with market uncertainty (Iatrou, Oretti, 2007). Synergies can be achieved in both alliances and mergers, nonetheless, realized increase in value can be different (Merkert and Morrell, 2012). Besides, Gudmundsson and Lechner (2011) say that additional merger synergies of two airlines can be achieved only if they were not a part of an alliance prior to the merger.
Synergies in the airline sector can also be classified into two big groups, namely revenue and cost synergies (Schosser, Wittmer, 2015). Revenue synergies are produced by access to new markets, increased network, improved loyalty, common pricing, and increased availability of market information. Costs synergies are mostly referring to the optimization of network, fleet, labor, sales and marketing costs, joint training and maintenance, increased availability of infrastructure and lower financing costs.
2.2 Valuation methods
Valuation of target and acquirer are essential parts of every M&A analysis. While building valuation models, analysts work assuming an efficient market in which the market value of an asset is the best possible estimate of its value and the model should justify this assumption. Contrary, inefficient markets price the asset incorrectly and it will get corrected to our estimated price. According to Damodaran (2011), there are 3 main approaches to valuation: intrinsic valuation, relative valuation, and contingent claim valuation, although only the first two are widely used to value a business.
2.2.1 Intrinsic valuation
This approach is based on an asset’s intrinsic characteristics, including its ability to generate cash flows and its risk profile. The most common methods to calculate the intrinsic value of an asset are Discounted Cash Flow and Adjusted Present Value analysis which assume intrinsic value being equal to the expected present value of future cashflows.
For the purpose of building a DCF-model, analysts are required to estimate the lifetime of an asset, future cashflows, and an appropriate discount rate. In case of business valuation, an indefinite lifetime is a fair assumption. The most common DCF approach (Rosenbaum, Pearl, 2013) involves a calculation of Free Cash Flows to the Firm (FCFF) using the following equation:
15
𝐹𝐶𝐹𝐹 = 𝐸𝐵𝐼𝑇(1 − 𝑇) + 𝐷&𝐴 − 𝐶𝑎𝑝𝑒𝑥 − 𝐼𝑛𝑐𝑟𝑒𝑎𝑠𝑒 𝑖𝑛 𝑁𝑊𝐶 (1)
The discount rate to calculate the present value of free cash flows, in this case, is supposed to be WACC and is calculated as:
𝑊𝐴𝐶𝐶 = 𝐶𝑜𝐸 ∗ 𝐸𝑞𝑢𝑖𝑡𝑦
𝐶𝑎𝑝𝑖𝑡𝑎𝑙+ 𝐶𝑜𝐷 ∗ (1 − 𝑇) ∗ 𝐷𝑒𝑏𝑡 𝐶𝑎𝑝𝑖𝑡𝑎𝑙 (2)
In order to calculate WACC, we need to compute the cost of equity (CoE) which can be obtained using the CAPM model and the Cost of Debt is possible to get using multiple methods, including corporate bond yields, rating spreads or information provided by the company. This formula incorporates tax shields in the cost of debt calculation, assuming all interest payments lower our tax base and thus make debt a cheaper source of financing.
There are numerous advantages to this method according to Damodaran (2011):
1. The company is valued based on its internal characteristics, thus it should be less sensitive to market changes in mood and expectations;
2. It’s a good approach to compute the value of a whole business, not just a single stock; 3. DCF requires a deep understanding of underlying business, its strengths and
weaknesses. At the same time:
1. It requires much more data to build a model than any other approach;
2. As models are often become complex and require a lot of inputs which are not easy to estimate, one can manipulate the value and get the desired price;
3. It is also possible to find intrinsic value proving the current market price and not give a room for recommendations.
Overall, this method is good for estimating long term value and for the firms that have a stable financing structure.
As the WACC method has some limitations, Myers (1974) introduced the Adjusted Present Value method that can improve the quality of valuation in some cases. APV separated the value into two parts according to Luehman (1997):
1. Best case value which assumes the value of a project as if it was entirely equity financed 2. Value of all financing side effect (tax shields, financial distress, subsidies and many
more)
APV provides users with additional flexibility and can be tailored in order to satisfy all tastes and extraordinary events that might be modelled. Besides, APV would most likely work when WACC works, but it would also work when it is not possible to apply a more traditional FCFF/WACC approach.
16 In order to do this type of analysis we need to:
1. Forecast cash flows of the selected business;
2. Calculate the PV of these cash flows and terminal value using CoE; 3. Compute the PV of Financial side effects;
4. Sum both parts of the analysis to get the final value.
This method has its own disadvantages, but it can provide many more insides for companies where financial side effects are especially significant, for example being in financial distress.
2.2.2 Relative valuation
One more common approach to valuing companies is relative valuation, which in practice is often the most used method. This approach is based on a multiplication of some specific ratio calculated using comparable universe by the performance measure (such as EBITDA, Sales, Cash Flow, Earning and etc.). Analyzing trading or transaction multiples provides analysts with a market benchmark against which they can build a valuation of a private or public company. The trading multiples method relies on the following assumptions (Kaplan, Ruback, 1996): all companies in the comparable universe are expected to share similar future cash flow growth and risk exposure, and on top of this a change in performance measure by a given percentage should lead to an increase in value by the same percentage. If these assumptions were perfectly valid, we would receive a much more accurate result than with other methods, but as there are no perfect comparable companies it can cause some errors.
In order to build the analysis, it is necessary to first select your universe of comparable companies, gather all the necessary information, build key statistics and multiples around the universe, benchmark companies in your universe, and then perform valuation (Rosenbaum, Pearl, 2013).
There are numerous discussions among researchers and analysts regarding the choice of appropriate multiples and when it is better to use them. There are two main types of multiples: Equity and Enterprise value multiples. The first type employs measures that flow only to equity holders (for example earnings), while denominator in enterprise value multiples is usually some financial metric like Revenue or EBITDA that flows to both equity and debtholders (Holthausen, Zhmiyevski, 2012).
Among equity multiples, the most common one is Price to Earnings ratio which is the result of a division of Share price by Diluted EPS and implies how much would an investor be willing to pay for a euro of company’s current (LTM P/E) and future (Forward P/E) earnings. While this ratio is widely used, it also has some limitations, due to the inability to use multiples for
17
companies with zero or negative earnings. Besides, earnings really depend on capital structure and a lot of other factors which makes the comparison even harder.
To account for the aforementioned factors, one can use Enterprise Value multiples. One of the most widely used financial performance measures is EBITDA due to its ability to make a comparison of companies with different tax systems and depreciation regimes much easier. Moreover, some analysts call it “proxy to free cash flows”.
While EV/EBITDA multiple is the most commonly used multiple, there are also ratios that are more appropriate in different industries, for example, EV/Reserves is widely used in Mining, Oil, Gas and other Natural resources companies, while Price/Book Value is more common for valuing banks or homebuilders. For airlines, retailers, and restaurants EV/EBITDAR is a valid measure due to its ability to incorporate rental costs.
The second widely used method in relative valuation involves the employment of information from previous comparable transactions. Overall, selecting deals is similar to comparable company selection. While analysing multiples of precedent transaction it is possible to observe that they are usually higher than trading multiples, mostly due to specific deal considerations, synergies and premium for control. It also makes this type of multiples more suitable for valuing M&A deals. While this method benefits from being market-based, simple and objectivity, it may be hard to find all the appropriate recent information and is exposed to acquirers’ bias.
2.2.3 Conclusion
While both relative valuation and intrinsic valuation are very commonly used, analysts prefer to not use them standalone and always analyse the value of the company considering as many methods as possible. Overall, while valuing public companies and merging deals, DCF, market comparables, and precedent transaction methods should guide the current market valuation of the business to make sure that as much relevant information is incorporated and that the analysis is comprehensive and valuable to decision making.
18
3. Macroeconomic and industry overview
Airlines are a very competitive industry which grew dramatically over the last 50 years. Mobility is necessary for the rapid growth of the global economy and, according to IATA estimates, 1% of growth in GDP should result in a 1.5% increase in passenger traffic, while in Europe this multiplier is estimated to be the highest in the world and exceed 2, which makes aviation particularly sensitive to external shocks. Therefore, it is necessary to analyse both macroeconomic and industry trends.
3.1 Macroeconomic situation in the World and Europe
The global economy has been experiencing one of the most stable decades in its history, having the last recession in 2009 when global GDP decreased by almost 2%. Since then it has been growing by 2-4% every year, but in 2019 growth slowed down to 2.5% as global trade, investments, and consumption fell below the long-term average. GDP expansion is expected to accelerate in the coming years and remain at a pace of 2.8-2.9% each year according to the forecast of the World Bank. As the main contributors to future growth, non-commodity-exporting emerging countries are expected to grow by 5% each year, commodity exporters will not exceed 3% of annual growth on average. Developed economies are lagging behind with average growth of 1.5% until 2022.
Figure 1. GDP development of selected markets, IMF data.
One of the most important developments in the last years was the trade war outbreak, mainly driven by the USA. The constant introduction of new tariffs by Trump’s administration was probably put on hold for some time after the signing of a Phase One agreement between the US and China in October 20192. This agreement is meant to reduce the level of global uncertainty
and bring confidence to manufacturers. Nevertheless, the share of the global economy under
2 The New York Times, Trump reaches “Phase 1” deal with China and delays planned Tariffs,
https://www.nytimes.com/2019/10/11/business/economy/us-china-trade-deal.html 1.5 -2.0 4.1 3.1 2.5 2.6 2.8 2.8 2.6 3.2 3.1 2.4 0.8 -4.2 2.0 1.8 -0.4 0.3 1.9 2.5 2.1 2.8 2.2 1.1 1.0 9.7 9.4 10.6 9.5 7.9 7.8 7.3 6.9 6.7 6.8 6.6 6.1 5.8 2.5 2.6 2.7 2.8 2.9 1.0 1.3 1.3 1.6 1.5 5.8 5.9 5.7 5.6 5.5 -5.0 0.0 5.0 10.0 15.0 2008 2010 2012 2014 2016 2018 2020F 2022F 2024F
19
the tariffs increased from 4% on average in 2013-17 to 6.7% in the last two years according to the World Bank’s estimate3.
Despite the improvement of the situation on the Chinese vector, the US has imposed additional protectionist measures on European goods as a row over EU subsidies to Airbus, including 10% duties on European planes and 25% for agricultural products imported to the US4.
Figure 2. Trade, Investment and Consumption development, World Bank data. Figure 3. Tariff impact on global trade, World Bank data.
The European economy is probably one of the most problematic nowadays, with GDP growth slowing down and some countries being close to recession in 2019. The German economy, as the largest in Europe, appears to be especially vulnerable to external shocks, as the industrial sector there is struggling with falling demand in Asia and changing preferences of customers in the automotive sector. Long-lasting discussions on Brexit did not stimulate growth as well. While the UK left the block at the end of January, the level of uncertainty regarding the future relationship with the EU is still high.
Monetary stimulation policy is expected to continue its current trend on further quantitative easing in order to boost economic activity.
Coronavirus pandemic outbreak will most likely change all the forecasts for 2020 and it is really hard to predict the full impact due to the rapid situation change in some countries. According to the OECD estimates, each month in a lockdown might result in a loss of 2 percent of annual
3 World Bank, Global Economic Prospects, World Bank publications, WB website,
https://openknowledge.worldbank.org/bitstream/handle/10986/33044/211469-Ch01.pdf
4 Deutsche Welle. US imposes record $7.5 billion tariffs on European goods. Deutsche Welle news section,
October-19, DW website, https://www.dw.com/en/us-imposes-record-75-billion-tariffs-on-european-goods/a-50880622
20
GDP growth, while tourism and related industries are facing the most damage and can drop by 70%. Recession is highly likely for many economies.
Taking into account the structure of the economies it is possible to expect that on average the monthly output would decrease by at least 15% after the closure of businesses in major economies initially, with Spain, Germany, and Greece losing more than 25% of their GDP.
Figure 4. Monthly loss of GDP as a result of lockdown, OECD data.
3.2 Global Industry overview
Aviation is a relatively new industry but probably one of the most global nowadays, connecting people from all over the world, mixing cultures, facilitating business, giving opportunities to grow and create something new. In 2019 there were over 1300 scheduled airlines in the world operating out of 3759 airports and flying 31 717 airplanes each day. While being heavily criticized by the environmental community, airlines give the opportunity for people to be inexpensively and safely connected with the rest of the world, for local business to become global, access foreign demand and supply chains, enhanced global connectivity also allows easy flow of capital from developed to emerging markets, quick response to emergencies and humanitarian crisis. The global aviation market has been doubling every 15 years and is expected to double once again in the next 20 years. Aviation supporting industries are also growing proportionally to the main industry, creating new jobs and value in manufacturing, maintenance, food, and other sectors. All direct, indirect, induced and catalytic contributions of the sector sum up to 2.7 trillion USD and 65.5 million jobs that are comparable to the United Kingdom’s economic size and population.
Worldwide airlines carried 4378 million passengers in 2018, 4540 in 2019, and were expected to deliver 4723 in 2020, which corresponds to 6.9%, 3.7%, and 4.0% growth Y-o-Y, while
21
revenue Passenger Km (RPK) is growing even faster. Despite this rapid growth, overall penetration of airlines’ services and connectivity remain low with more than 900 destination-weighted seats per person in North America, around 450 in Europe and even lower numbers in other regions, which means that globalization and growth of economies will boost passenger travel in the following years.
Table 1. RPK development, %, IATA data.
Aviation is traditionally one of the most vulnerable industries in times of instability. Normally airlines' business model is built on high efficiency and thin margins. While prospering in times of high demand and appealing prices, the industry can generate substantial profits, an external shock might vanish EBIT margins, which are already close to zero or negative for some regions and airlines. As seen from the table below, only North American and European airlines have strong EBIT margins.
Table 2. EBIT margin development, %, IATA data.
One of the main problems of the industry that leads to this particular vulnerability is its high portion of Fixed costs that account for more than 49% of their expenses, and Depreciation, Insurance, and Leases being the most inflexible components drowning the airline in bad times.
2014 2015 2016 2017 2018 2019E 2020F Global 6 7.4 7.4 8.1 7.4 4.2 4.1 NA 3 4.3 4 3.9 5.3 3.8 3.8 Europe 6.5 5.8 5.3 9.1 7.5 4.5 3.8 Asia-Pac 7.8 9.6 11.1 10.9 9.5 4.7 4.8 ME 11.9 9.6 11.4 6.8 5 2.6 2.5 LA 6.3 6.7 4.5 7.4 7 4.2 4.3 Africa 0.6 3.4 7.3 7 6.1 3.7 3.8 2014 2015 2016 2017 2018 2019E 2020F Global 4.6 8.6 8.5 7.5 5.7 5.1 5.5 NA 9.1 14.4 13.7 11.2 9.1 9.6 9.1 Europe 3.1 5.5 6.1 7.9 6.2 4.7 5.3 Asia-Pac 2.4 6.9 7.4 6.3 4.7 3.5 4.7 ME 3 6.3 2.2 -3 -4.6 -5.2 -4.2 LA 5 5 5.6 6.2 2.7 3.6 3.7 Africa -2.7 -2.1 1.1 0.8 1.5 1 1.1
22 Figure 5. The cost structure of an airlines business, IATA data.
As we can also see from the chart above, one of the biggest costs for the industry remains fuel. A steep decrease in oil prices in 2014 was one of the reasons behind the overall increase in industry efficiency and growing passenger numbers. As prices keep going down, we might see more long-distance traveling due to the increased efficiency of airplanes and low fuel costs.
Figure 6. Brent crude oil price development and forecast, USD/bbl, Bloomberg data.
3.3 European Industry overview
EasyJet and Norwegian are European low-cost airlines and for them, Europe is the main market, even though Norwegian has developed a large network of long-haul flights to other continents, besides these airlines operate solely passenger flights.
Europe is known as the most liberalized aviation market due to the EU single market agreement (1997) and the creation of the European Common Aviation Area (ECAA) in 2006. Together with additional agreements (CAA, EMAA) open sky above Europe exists for airlines from 36 countries. While most of the European airlines belong to the flag carrier group, low-cost airlines operating short point-to-point flights are prospering the most on this deregulation. Nowadays, approximately 50% of all international passengers in the world are carried by European carriers. In 2012 the European market also became the largest in the world in terms of RPKs surpassing
0 10 20 30 40 50 60 70 80 90
23
North America as the long-term aviation leader. As one of the main contributors to this growth was the extremely high load factor on European flights that was higher than the world's average since 2011. One more important factor in the European sky is the increasing share of low-cost carriers which surpassed 40%.
In order to enable free traveling between continents, the EU-US Open sky agreement was signed in 2007 by the members of the EU and the US, with more European countries added later. Due to this liberalization 52 new connections have been created between the two continents and major savings for passengers flying on these routes.
While major airports in Western Europe have already reached their capacity maximums and cannot contribute to the overall growth on the continent, emerging Europe accelerates traffic in the region. According to the ICAO forecast, Europe will be the second slowest growing region with an annual increase in passenger travel by 3.3% annually until 2045. This increase will still lead to an increase in airline-related industries jobs by 49% in 2036 (18m jobs) compared to 2016 and USD 1.6 trillion in contribution to GDP (up by 90%).
Table 3. Expected annual growth of passenger aviation, ICAO data.
Despite many positive sides of the European market, a high degree of competition and regulative costs led to the world's highest breakeven load factors in the world, which exceeded 70.4% in 2019. As a response to this, companies invest in more efficient planes, while low fuel cost also contributes to high margins.
3.4 Coronavirus impact on aviation in 2020
In December 2019 the rapid spread of a coronavirus disease began in the city of Wuhan, China. Over the following months, the virus has been registered in most of the world’s countries, that reacted by closing borders and cancelling flights. Especially severe measures were introduced in Europe. Globally international seat capacity declined by 80% by the end of Q1 2020, causing 50% of the airline's fleet to be grounded. According to forecasts of OAK data firm, it might take several years to fully recover from this pandemic and come back to 2020 previous expectations, while IATA estimates 60% drop in Q2 2020, 40% in Q3 and 10% in Q4 y-o-y with a full recovery to initially expected numbers in the next year.
The pandemic will most likely result in severe industry job cuts around the world, with over 11m jobs in Asia-Pacific and 5.6m jobs in Europe being at risk. This may be caused not only because of the fleet grounding but also due to possible airline bankruptcies. As we discussed
Europe to: 2015-2025
Middle East 3.8
North Africa 3.9
North America 2.5
North Asia 2.1
South East Asia 4.1
Latin America 3.6
Sub Saharan Africa 2.5
24
earlier in this chapter, airlines have overall low margins and require high efficiency to operate profitably, which is not possible during this crisis. Besides, airlines have a tremendous amount of fixed costs that are supposed to be paid even while having their planes on the ground. According to the IATA estimate, the average airline has enough cash reserves to survive 2 months, but as long as the pandemic lasts longer, even airlines with a strong balance sheet will not be able to survive without strong and industry-specific governmental support.
Figure 7. Worldwide RPKs development, IATA data.
Figure 8. Daily flight number development, IATA data.
The first European airline to fall due to the virus was British regional airline Flybe, which could face over 100m USD in lost revenue in 2020. Some airlines, including Russian Pobeda LCC and second-largest European LCC EasyJet,5 decided to fully ground their fleet until further
25
notice. The industry might expect a series of further bankruptcies and consolidation of the industry as the result of the outbreak.
3.5 Segmentation in European aviation
In order to analyse possible mergers, we need to understand how the European airline market is structured. Typically, airlines are engaged in transporting passengers and goods, but as both EasyJet and Norwegian AS operate only passenger planes, we will focus mostly on this segment.
While US airlines went through a period of consolidation after the 9/11 terrorist attacks and the latest financial crisis, the European market is still much more fragmented. For example, five major US airlines control almost 80% of the market, the share of 5 major European airlines slightly exceeds 50%. The oligopolistic market structure in the US results in a more stable performance of the players and higher profitability.
Airlines can be classified depending on their service offer (from full service to no-frill) and typical distance flew (short to long haul). BCG divides all major European airlines into 6 groups according to their business model.
Europe’s 3 major full-service carriers (Lufthansa, AirFrance-KLM, IAG) represent the Global FSC group, all these airlines operate hub-and-spoke model, collecting people from various cities in their global hubs (e.g. Frankfurt, Paris, London), regrouping them and sending to their final destinations. To be able to serve crowds of people and fly both short flights like Frankfurt-Hamburg and ultra-long flights like London to Jakarta, they require different types of aircraft and investments in their hub airports, which results in large costs for carriers. Due to the high ticket price, Global FSCs target customers with low price sensitivity, mostly business travelers. On the opposite side of the matrix, we can find pure Low-Cost Carriers with Ryanair, WizzAir, and Jet2.com as the most well-known representatives. These companies operate only one type of aircraft, fly short distances and between small airports only. In order to deliver profits while charging small fees, it is necessary to be maximally efficient and avoid flying empty planes. Even though Global FSCs charge premium prices, they also reported large losses in difficult years, while pure LCCs managed to keep their bottom line positive even during the crisis. Besides the two aforementioned groups, Medium FSCs/Point-to-point carries are SAS, LOT Polish Airlines, Alitalia, AirEuropa and Aegean operate mixed model mostly on short distances, Medium FSCs/hub players like Icelandair, Finnair and TAP Air Portugal connect passengers in their hubs in order to send them to their competitive advantage markets (North America, North Asia, and Latin America respectively).
26
Hybrid LCCs Eurowings, Transavia and Vueling represent subsidiaries of Global FSCs and attract less price-sensitive passengers while flying out of primary airports instead of small local havens. EasyJet can belong to both of these groups as it operates with low fares and both types of airports. While typical LCCs are mostly interested in short-haul flights, Norwegian AS and WOW Air tried to tackle the long haul low-cost segment.
3.6 Airline consolidation in Europe
As it was mentioned above, the European market is highly competitive and fragmented. As one of the reasons behind it, researchers from Oliver Wyman find differences in the culture and language of EU member states. Across the Atlantic, carriers are operating in one country with a single language, while in Europe most of the carriers belong to the flag carrier group, which means that AirFrance is the national carrier of France, while passengers of Austrian airlines are traveling via Vienna. It drastically reduces the benefits of airline mergers in Europe. Besides, in order to operate in different countries, airlines require additional certificates and more complex structures (e.g. subsidiaries of Norwegian in the UK and Ireland, subsidiaries of EasyJet in Switzerland and Austria).
Three major global FSCs in Europe were formed in a process of multiple mergers. Lufthansa Group was formed in a way of multiple acquisitions and spinoffs of the German leading carrier, while AirFrance-KLM Group was born in 2004 as a result of a merger between national carriers of France and the Netherlands, both members of SkyTeam alliance. The conglomerate was engaged in multiple transactions and hold minor interest in many airlines around the world as presented in Exhibit #. International Airlines Groups was created after Spanish Iberia and British Airways closed the merger agreement in 2011 having created one of the world's largest airline groups with hubs in Madrid and London. Subsequently, they created a number of subsidiaries including LEVEL airline that is now a direct competitor on long-haul routes with Norwegian. Besides, IAG announced its interest in Norwegian AS in 2018 and started the takeover process, but the deal was rejected by the target’s shareholders.
European largest airline and LCC “Ryanair” had been sticking to a “single airline” strategy but abandoned it in 2018 creating Polish subsidiary Ryanair Sun. Further that year it also acquired Austrian Laudamotion. In 2019 the Irish airline announced the creation of a new company jointly with the government of Malta.
European airlines keep looking for a way to gain market share and grab new markets, it is also highly likely that uncertainty will accelerate this process in order to create large firms able to withstand any circumstances.
27
3.7 Deal rational within industry trends
EasyJet as the second largest European LCC is most likely looking for a way to compete with Ryanair and boost its value. For large LCCs there are three main ways to grow their business according to BCG:
1. Close markets gaps
2. Expand into long haul business 3. Feed FSCs long haul flights
EasyJet has a strong position in the UK, Western and Southern Europe, while Norwegian AS is mostly operating out of the Nordic region, where EasyJet has a relatively limited presence. The merger would be a fast way to close this gap and increase pressure on FSCs as Ryanair and WizzAir also have a limited presence on the Nordic market.
One of the main advantages of Norwegian AS is its unique long haul business model. As EasyJet does not participate in this market, and will not enter it any time soon due to large costs and significant risks of this expansion, Norwegian seems to be a fast way to enter the market with their fleet of efficient Boeing 787 aircraft and operating flights out of major European hubs.
Feeding FSCs which seems to be unrealistic for direct competitors was confirmed by both major European LCCs and Ryanair has been acting as a feeder for Spanish AirEuropa and its flights to the Americas.
EasyJet chose the strategy to enable partnership with Norwegian and feed its long haul network, which is growing every year and by the end of 2019 included North and Latin America, South-East Asia. Norwegian was also in discussion with the government of Russia in order to get access to the Siberian sky which would give it access to Chinese, Japanese and Korean markets. We can observe that the deal between EasyJet and Norwegian would fit industry trends and may result in a giant player that can operate globally and compete with full-service carriers. And as we know from history, when LCCs try to compete with FSCs, the advantage is usually not on the side of traditional players. Besides industry trends, this merger can catch additional synergies which will be explained after analysing both companies in detail.
28
4. Company overview
Analysing key macroeconomic and industry trends can give a clear understanding that Airlines in Europe are looking for new strategic initiatives to attract new clients, fly to more cities, enter new segments, and boost their profits. A merger between EasyJet and Norwegian is a good business combination according to the industry trends and to further investigate this opportunity, it is necessary to study these standalone companies further.
4.1 EasyJet
EasyJet PLC is a British low-cost airline founded in 1995 and headquartered in the town of Luton, near London. As of the end of 2019, the company was the 5th largest Airline group in
Europe, having carried more than 90 million passengers. It operates more than 1000 scheduled domestic and international flights in more than 30 countries in Europe, Northern Africa, and the Middle East serving 159 airports with 331 aircraft and over 15,000 employees. EasyJet ends its fiscal year on September 30th.
4.1.1 Company ownership
The company was founded by Sir Stelios Haji-Loannou, a Greek-Cypriot who was interested in aviation and asked his father for a start investment. 25 years later Haji-Loannou family remains the largest shareholder of the airline with 33.72% as of the 18th of March 2020, other
major shareholders include institutional investors like Invesco, BlackRock, Phoenix asset management partners, and Norges Bank, with remaining companies and individuals holding no more than 3% each.
Haji-loannou
Family Invesco BlackRock Phoenix AMP Norges Bank Other
33.7% 7.4% 3.4% 3.3% 3.2% 49.0%
Table 4. Major shareholders, Bloomberg.
4.1.2 Share price development
EasyJet is a publicly-traded company with the main listing on London Stock Exchange under the Ticker EZJ. The company went public on November 5th 2000 and is currently a component
of the main British benchmark FTSE 100. Comparing to the industry benchmark NYSE Arca Global Airline Index, since 2016, EasyJet had a worse performance. Because of the coronavirus pandemic outbreak, as of the May 15th 2020 EasyJet lost 64.2% versus 57.2% for the
29
Figure 9. EasyJet price development versus NYSE Arca Global Airline Index, Thomson Reuters.
4.1.3 Operating revenue
The typical business model of a low-cost Airline implies selling seats cheaper than legacy carriers while getting more revenue selling additional services to the clients which have much higher margins than tickets. Passenger revenue reported by EasyJet includes net ticket and admin fee, all other revenue is included in ancillary revenue. Due to the high margin of non-ticket revenue, EasyJet has been actively trying to collect more of it and by the end of FY2019 the portion of ancillary revenue streams reached 21.6%. In 2016 EasyJet experienced a small decline in revenue due to aggressive pricing, terrorist attacks, and Brexit related issues according to the FY2016 Annual report.
Figure 10. EasyJet revenue breakdown, millions GBP, EasyJet annual reports and Bloomberg.
Lack of stability on the market did bring a large impact on the revenue of the company. We can see that even though the company had increased its load factor, the number of aircraft and passengers carried in 2016-2017, it is revenue declined by 0.4% in 2016, mostly driven by seat revenue which declined significantly in H2 2016 by 8.5% under constant currency. Over the last 5 years, EasyJet increased the number of passengers by 40%.
50 100 150 200
May-15 Nov-15 May-16 Nov-16 May-17 Nov-17 May-18 Nov-18 May-19 Nov-19 May-20
EZJ.L .AXGAL 3,910 3,761 4,061 4,688 5,009 776 908 986 1,210 1,376 16.5% 19.5% 19.5% 20.5% 21.6% 0.0% 5.0% 10.0% 15.0% 20.0% 25.0% 0 2,000 4,000 6,000 8,000
FY2015 FY2016 FY2017 FY2018 FY2019
30
Figure 11. Revenue drivers’ growth, EasyJet annual reports and Bloomberg.
4.1.4 Operating costs
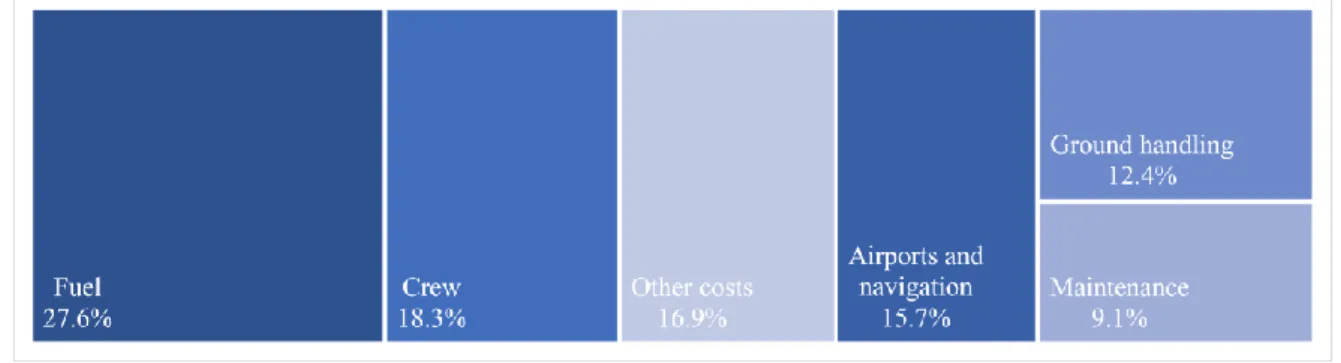
As EasyJet operates the low-cost carrier model, it tries to minimize all the types of expenses. Nevertheless, the main outflow for the airline is related to fuel costs, which have fluctuated from 25.6% of revenue in 2017 to 20.1% in 2018, and 22.2% in 2019 or 26% of all operating costs. Besides, airport and ground handling expenses rose from 23.9% in 2015 to 28.9% of revenue in 2019 or 34% of all operating costs since the company has been increasing the number of flights from major airports.
Figure 12. Operating costs structure in FY2019, EasyJet annual reports and Bloomberg .
Costs of running the business remained more stable than revenue and were growing each year along with the customer flow over the last 5 years. Not very successful revenue management and growing costs resulted in EBITDAR margin decline from 20.1% in 2015 to 15.2% in 2019.
Figure 13. Operating costs development, EasyJet annual reports and Bloomberg, mGBP.
5.9% 6.6% 9.7% 10.3% 8.6% 6.6% 6.6% 8.6% 12.9% 5.1% 91.5% 91.6% 92.6% 92.9% 91.5% 90.5% 91.0% 91.5% 92.0% 92.5% 93.0% 93.5% 0.0% 5.0% 10.0% 15.0%
FY2015 FY2016 FY2017 FY2018 FY2019
Passenger Growth #Aircraft Growth Load Factor
20.1% 16.4% 14.5% 16.3% 15.2% 0.0% 5.0% 10.0% 15.0% 20.0% 25.0% 2,000.0 4,000.0 6,000.0
FY2015 FY2016 FY2017 FY2018 FY2019
Fuel Airports and ground handling Crew
31
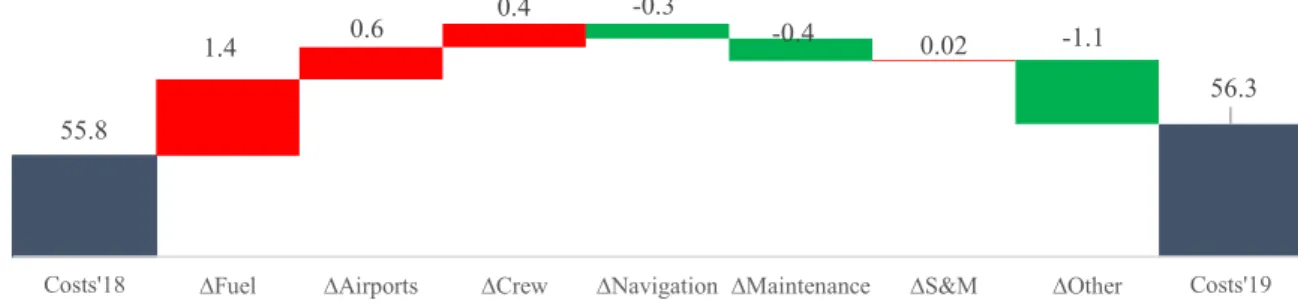
In 2019 operating costs per passenger kept increasing and reached 56.3 GBP which was mainly driven by the increase in fuel expenses and airport handling, while the main decrease was done my managing Other expenses, which include head office and everything not included in separate categories.
Figure 14. Operating costs per passenger, EasyJet annual reports and Bloomberg, GBP.
Besides aforementioned costs, EasyJet has large costs of leasing/owning airplanes. While the airline can obtain airplanes significantly cheaper than many of its competitors due to large size of orders and operating only Airbus A320 family, aircraft costs has been increasing as a result of introduction of more efficient but more expensive A320neo airplanes as well as British Pound depreciation versus Euro. Due to recent accounting policy changes operating leases of airplanes were converted into capital leases and we can see the shift from rental costs towards increased depreciation expenses in the last year.
Table 5. Aircraft owning/leasing expenses, EasyJet annual reports and Bloomberg.
4.1.5 Key Financial Indicators
EasyJet managed to survive Brexit uncertainty relatively successfully, even though currency exchange rates lead to a significant decrease in profits over the years and lead to a decrease of EPS from 1.39, 5 years ago, to only 0.89 now. Market capitalization has shrunk and continued falling in 2020. Nevertheless, the company remained profitable and kept a very low ND/EBITDAR ratio which means that it should be able to borrow a significant amount of cash relatively cheap and fast to finance an acquisition.
55.8 56.3 1.4 0.6 0.4 0.02 -0.3 -0.4 -1.1
Costs'18 ∆Fuel ∆Airports ∆Crew ∆Navigation ∆Maintenance ∆S&M ∆Other Costs'19
FY2015 FY2016 FY2017 FY2018 FY2019
Depreciation 125 157 181 199 484
Rental costs 114 103 110 152 5
Total aircraft costs 239 260 291 351 489
32
Table 6. Key financial indicators, EasyJet annual reports and Bloomberg, mGBP.
FY2015 FY2016 FY2017 FY2018 FY2019
Revenue 4686 4669 5047 5898 6385 growth -0.4% 8.1% 16.9% 8.3% EBITDARadj 940 764 733 961 970 margin 20.1% 16.4% 14.5% 16.3% 15.2% EBITDAadj 826 661 623 809 965 margin 17.6% 14.2% 12.3% 13.7% 15.1% EBITadj 688 492 428 595 466 margin 14.7% 10.5% 8.5% 10.1% 7.3% Net Income 548 427 305 358 349 margin 11.7% 9.1% 6.0% 6.1% 5.5% EPS basic 1.39 1.08 0.77 0.91 0.89 EPS diluted 1.38 1.08 0.77 0.90 0.88 Total Assets 4,828 5,505 5,971 6,993 8,163 Total Equity 2,249 2,712 2,802 3,233 2,985 Total Liabilities 2,579 2,793 3,169 3,760 5,178 Net Debt -435 -213 -357 -396 278 Net Debt/EBITDAR -0.5x -0.3x -0.5x -0.4x 0.3x Market Capitalization 7,055 3,998 4,831 5,217 4,566
33
4.2 Norwegian Air Shuttle
Norwegian Air Shuttle is registered and was founded in Norway in 1993 as a regional airline, but later in 2002 changed it business model into a low-cost carrier. It was the 9th largest airline
in Europe in 2019, 4th largest low-cost carrier (after Ryanair, EasyJet and WizzAir) and the
largest airline of the Nordic Region.
Unlike many LCCs, Norwegian operates both short-haul and long-haul flights, carried over 36 million people in 2019 on its 156 aircraft of the Boeing 737 and 787 families between cities within Europe, and to the Americas and Asia.
4.2.1 Company ownership
Norwegian largest shareholder, KBK Holdings AS, belongs to the founder and former CEO of the company Bjørn Kjos. The second-largest shareholder is The Government Pension Fund of Norway. Top 20 shareholders own 43.8% of the airline as of December 31st 2019.
HBK Holding AS Folketrygdfondet Keskinäinen eläkevakuutusyhtiö Varma Danske Capital Pareto Asset Management Other 8.7% 6.7% 4.6% 3.9% 2.5% 73.6%
Table 7. Major shareholders, Company Q4 Report.
4.2.2 Share price development
Norwegian went public on Oslo Stock Exchange on December 18th 2003 with a ticker NAS.
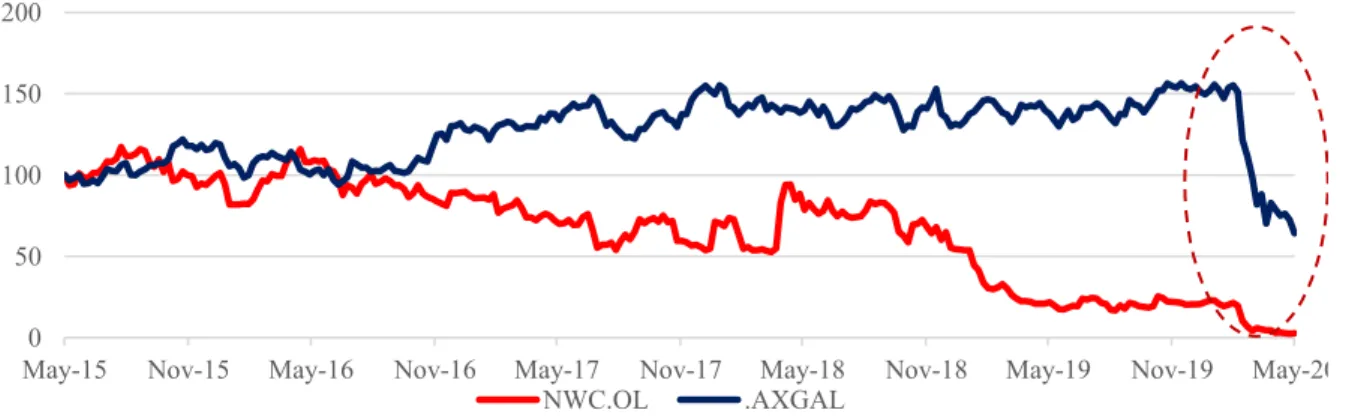
Currently, it is a part of the OBX Index that includes 25 most liquid public companies of Norway. The latest debt restructuring plan proposed conversion of debt into equity which sent the stock price immediately deep down. Due to poor financial performance, constant losses and thread of bankruptcy Norwegian share price lost approximately 97% of its value over the last 5 years and 87% of value since the beginning of the year, which is significantly worse than NYSE ARCA Global Airline Index.
Figure 15. Norwegian share price development versus NYSE Arca Global Airline Index, Thomson Reuters.
4.2.3 Operating revenue
Norwegian separates its key revenue components into Passenger, Ancillary, and other revenue (mostly cargo). The company is experiencing a period of rapid growth and has more than
0 50 100 150 200
May-15 Nov-15 May-16 Nov-16 May-17 Nov-17 May-18 Nov-18 May-19 Nov-19 May-20
34
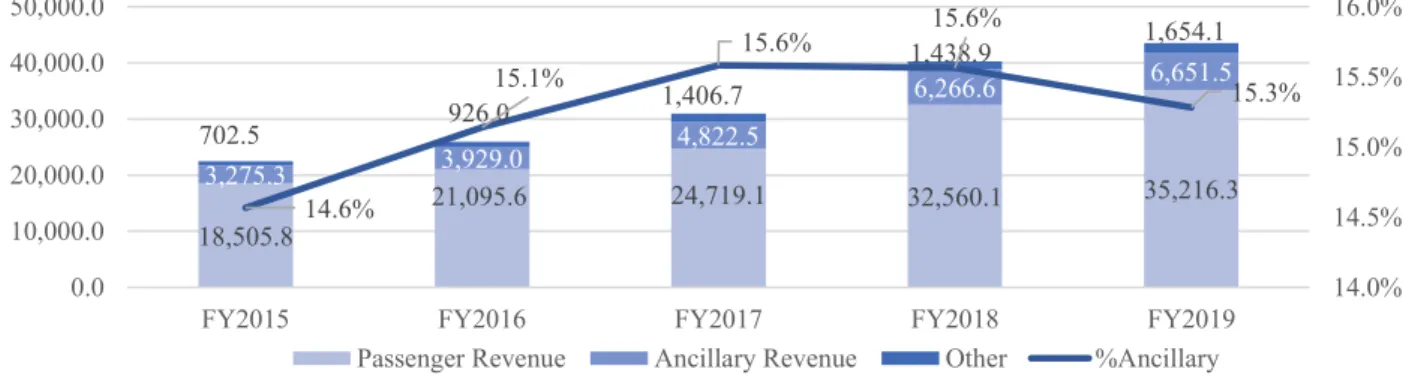
doubled its revenue in the last 5 years. The most successful in terms of growth year was 2018 when revenue grew by 30.1% year-over-year. This was mainly related to a large delivery of aircraft during the previous year, improving its position as an important player on the transatlantic market. All three segments showed impressive growth with Passenger Revenue increased by 90.3%, Ancillary by 103.1%, and Other by 135.5% over these years.
Figure 16. Norwegian revenue breakdown, Norwegian annual reports and Bloomberg, mNOK.
As many low-cost carriers, Norwegian tried to boost its ancillary revenue stream and managed to get the improvement from 14.5% of total revenue to 15.3%. One of the ideas behind the typical low-cost carrier model is its high load factor which is necessary to maintain a high level of efficiency and low prices. Norwegian struggled to fly full planes and due to the large delivery of aircraft in 2017 could not get enough costumers the year after, significantly worsening its financial position. Implementation of a new strategy in 2019 and a focus on profitability lead to improvements, but the load factor is still lower than in 2016 when it reached 87.7%.
Figure 17. Revenue drivers’ growth, Norwegian annual reports and Bloomberg.
4.2.4 Operating costs
Norwegian presents its operating cost elements in a similar way as EasyJet. It is possible to see that the largest cost for the carrier was its fuel purchases, which can be easily explained by the bet of the carrier on long-haul flights. While fuel costs accounted for only 19.5% of revenue in 2016, it exceeded 29.0% in 2019. 18,505.8 21,095.6 24,719.1 32,560.1 35,216.3 3,275.3 3,929.0 4,822.5 6,266.6 6,651.5 702.5 926.0 1,406.7 1,438.9 1,654.1 14.6% 15.1% 15.6% 15.6% 15.3% 14.0% 14.5% 15.0% 15.5% 16.0% 0.0 10,000.0 20,000.0 30,000.0 40,000.0 50,000.0
FY2015 FY2016 FY2017 FY2018 FY2019
Passenger Revenue Ancillary Revenue Other %Ancillary
7.5% 13.6% 13.0% 12.7% -2.9% 4.2% 17.2% 24.1% 13.9% -4.9% 86.2% 87.7% 87.5% 85.8% 86.6% 84.5% 85.0% 85.5% 86.0% 86.5% 87.0% 87.5% 88.0% -10.0% 0.0% 10.0% 20.0% 30.0%
FY2015 FY2016 FY2017 FY2018 FY2019
35
Figure 18. Operating costs structure in FY2019, Norwegian annual reports and Bloomberg .
Over the last 5 years, Norwegian managed to decrease some of its costs relative to sales, but overall margin dropped from the highest 23.0% in 2016 to only 5.4% in 2018 and recovered to 16.8% in 2019 after implementation of the Next strategy that focuses on profitability instead of growth.
Figure 19. Operating costs development, Norwegian annual reports and Bloomberg, mNOK.
Despite the change of the development strategy and focus on profitability, Norwegian faced increasing costs of operating its flights in 2019, with fuel (decrease in spot prices, offset by exchange rate fluctuation) and providing the most significant portion of this growth, while Airport and ATC fees (load factor increase and renegotiation with vendors), and other costs (one-off cost reduction, unspecified) decreased. As a result, operating costs per passenger excluding aircraft owning/leasing expenses decreased by 2% from 1021.3 to 1000.2 NOK. Due to the implementation of the new strategy, the last quarter results show more positive dynamic than the whole year results.
16.4% 23.0% 12.8% 5.4% 16.8% 0.0% 5.0% 10.0% 15.0% 20.0% 25.0% 0 50000 100000 150000
FY2015 FY2016 FY2017 FY2018 FY2019
Revenue Costs Fuel
Airports and navigation Crew Ground handling
36
Figure 20. Development of operating costs per passenger, Norwegian annual reports and Bloomberg, NOK.
Besides the aforementioned costs, Norwegian has a large number of Krones dedicated to aircraft leasing/owning. This component is highly dependent on currency fluctuations, as leasing contracts are usually in USD, while reporting currency is NOK. The company operates Boeing 737 planes on its short-haul routes, including the B737-300 model which is on its way to be eliminated out of the fleet, and MAX8 model which is currently grounded. On its long haul routes, Norwegian uses a highly efficient 787-8 Dreamliner model, which is also being investigated due to engine problems.
Table 8. Aircraft owning/leasing expenses, Norwegian annual reports and Bloomberg.
4.2.5 Key Financial Indicators
The fast growth of the airline is heavily affecting its profitability, with net income, EBIT margin, and EPS being usually below 0. Unlike many European low-cost airlines, Norwegian is actively leasing its aircraft and has a substantial debt amount. Due to accounting policy changes in 2019, debt and assets increased. Overall, Norwegian is one of the most indebted companies on the market and this causes multiple questions from investors. In April 2020 Norwegian had to ask its investors and debtholders for help for the 4th time in the last 2 years, offering conversion of debt into equity in order to meet the Norwegian government requirements, but this agreement would lead to substantial ownership dilution. On May 5th this
deal was approved on an extraordinary shareholders meeting, thus diluting the share of existing shareholders and leaving them with only 5% of the company.
1,021.3
1,000.2
11.5 -2.9 9.7 5.9 -0.3
-44.9
Costs'18 ∆Fuel ∆Airports/ATC ∆Crew ∆Handling ∆Maintenance ∆Other Costs'19
FY2015 FY2016 FY2017 FY2018 FY2019
Owned 54 67 66 76 65 787-8 Dreamliner 3 3 7 10 11 B737-MAX8 0 0 6 14 14 B737-300 51 64 53 52 40 Leased 45 49 78 88 91 787-8 Dreamliner 5 9 14 22 26 B737-MAX8 4 4 B737-300 40 40 64 62 61 Total 99 116 144 164 156 Costs 3346.6 4137.7 5294.8 6021.7 6457.5