WORKING PAPER SERIES
CEEAplA WP No. 08/2010
Quality of the Azores Destination in the
Perspective of Tourists
Carlos Santos Gualter Couto Pedro Pimentel José Cabral Vieira
Quality of the Azores Destination in the Perspective of
Tourists
Carlos Santos
Universidade dos Açores (DEG)
e CEEAplA
Gualter Couto
Universidade dos Açores (DEG)
e CEEAplA
Pedro Pimentel
Universidade dos Açores (DEG)
e CEEAplA
José Cabral Vieira
Universidade dos Açores (DEG)
e CEEAplA
Working Paper n.º 08/2010
Julho de 2010
CEEAplA Working Paper n.º 08/10 Julho de 2010
RESUMO/ABSTRACT
Quality of the Azores Destination in the Perspective of Tourists
Tourism is a growing industry in the Autonomous Region of the Azores. However, little is known about how tourists evaluate this destination, something which certainly constitutes a shortcoming if one takes into consideration that this is a very competitive industry, with new destinations appearing every year and others increasing their market share. This paper focuses on the quality of the Azores destination in the perspective of tourists and, to an extent, has the goal of contributing to reduce this shortcoming. According to our findings, 74% of the tourists interviewed consider the global quality of the Azores destination to be very good or excellent, with the landscape, the climate/weather, the hospitality, the cleanliness and the security being the most highly-rated partial indicators. Additionally, a regression analysis indicates that the evaluation of the global quality of this destination varies according to the individual characteristics of tourists.
Carlos Santos
Departamento de Economia e Gestão Universidade dos Açores
Rua Mãe de Deus,
9501-801 Ponta Delgada Gualter Couto
Departamento de Economia e Gestão Universidade dos Açores
Rua Mãe de Deus,
9501-801 Ponta Delgada Pedro Pimentel
Departamento de Economia e Gestão Universidade dos Açores
Rua Mãe de Deus,
9501-801 Ponta Delgada José Cabral Vieira
Departamento de Economia e Gestão Universidade dos Açores
Rua Mãe de Deus,
Quality of the Azores Destination in the Perspective of Tourists
Carlos Santos
Department of Economics and Management and CEEAplA
University of the Azores, R. Mãe de Deus, 9501 801 Ponta Delgada, Portugal
Gualter Couto
Department of Economics and Management and CEEAplA
University of the Azores, R. Mãe de Deus, 9501 801 Ponta Delgada, Portugal
Pedro Pimentel
Department of Economics and Management and CEEAplA
University of the Azores, R. Mãe de Deus, 9501 801 Ponta Delgada, Portugal
José Cabral Vieira
Department of Economics and Management and CEEAplA
University of the Azores, R. Mãe de Deus, 9501 801 Ponta Delgada, Portugal
Abstract
Tourism is a growing industry in the Autonomous Region of the Azores. However, little is known about how tourists evaluate this destination, something which certainly constitutes a shortcoming if one takes into consideration that this is a very competitive industry, with new destinations appearing every year and others increasing their market share. This paper focuses on the quality of the Azores destination in the perspective of tourists and, to an extent, has the goal of contributing to reduce this shortcoming. According to our findings, 74% of the tourists interviewed consider the global quality of the Azores destination to be very good or excellent, with the landscape, the climate/weather, the hospitality, the cleanliness and the security being the most highly-rated partial indicators. Additionally, a regression analysis indicates that the evaluation of the global quality of this destination varies according to the individual characteristics of tourists.
1 - Introduction
It is increasingly recognized that quality is an important differentiation factor of products and services (see Box, 1983; McDougall & Levesque, 1994; Zeithaml et al., 1996; Sweeney et al., 1997; Duffy & Ketchand, 1998; Bloemer et al., 1999; Norsworthy & Tsai, 1999; Wong & Sohal, 2003; Thach e Olsen, 2006; Rabinovich, 2007; Alexandris et al., 2008). Companies, regions and countries increasingly invest in this strategic and competitive factor.
Globalization has increased competition and reinforced the role of quality. Tourism is certainly one of the sectors, among many others, where quality plays a crucial role. The Azores have recently opted for a strategy of expanding their tourism industry, yet little is still known about how tourists rate this destination. This is a shortcoming that is certainly important to overcome in order to implement correct and adequate policies. This paper intents to contribute to this end.
The paper is organized in the following manner; in section 2, we argue how tourism is important for the growth and development process of the Azores and about the role of quality. Section 3 presents the definition of the methodology and the econometric model, with section 4 presenting the surveys, their application and a description of the data. Finally, section 5 includes the findings from the econometric model estimation, with section 6 providing the major conclusions.
2 - Tourism: a crucial sector for the Azores
In a small economy, the growth and development process always has to encompass the production of goods and services intended for export. Thus, along with the agro-food industry, tourism plays a strategic role in the development of the Azores.
Considering the natural characteristics of the Azores, as well as the expansion of global demand, tourism is undoubtedly a promising sector. Actually, tourism
is part of a limited number of opportunities capable of widening and diversifying the export economic base of the Azores.
The Azores are a small, archipelagic and dispersed island region, where 2.3% of the Portuguese population lives. A measure of wealth is the GDP per capita which was 90% of the national average in 2006.
Nonetheless, the growth of the Azores, along with the catching-up process with the national average, has been notable and very significant. To prove it, one just needs to take into account that that indicator only reached 75% of the national average in 1996, according to official data.
The standard of living significantly improved in the Azores over the last few years. As it is known, the model of development was based on transfers of funds coming from the exterior and on taking advantage and exporting natural resources. Regarding the transfers, these originated in the National Budget and the European Union and were destined not only to the Regional Budget for also to the Local Councils. For the time being, the export sector is essentially based on the agro-food industry, especially on milk and dairy products.
As for the future, transfers from the National Budget and the European Union are not expected to substantially increase, and a significant growth in the production of milk also does not seem likely.
The lower than national average GDP per capita is not the result of lower labor productivity but essentially of a smaller participation of the population in the labor market. This happens, in particular, because women’s participation is lower in the Azores (about 34%), when compared to the national average (about 47%).
In the past, the model of development did not incorporated women into the labor market, since agriculture and construction predominantly employed men. Moreover, the industrialization model of the Mainland based on the textile and footwear industries was not replicated in the Region. Opportunities only appeared with the introduction of the autonomous regime and the expansion of public services, but the latter would not expand continuously, due to the restrictions of the State Budget.
The diversification and enlargement of the export economic base, along with women’s employment, depends on a commitment on the development of tourism. Some, namely the World Tourism Organization, forecast that revenue from this industry will surpass, in little over a decade, that of other important sectors, such as the oil and car industries
It is obviously important to commit to growing industries. Tourism is, therefore, a sector that has been correctly identified, over the last few years, as strategic to continue the growing and development process of the Azores.
Chart 1 – Evolution of the number of guests at accommodation units
Tourism is in expansion and tends to become the main worldwide economic activity. The Azores could not lose this opportunity, and the answer of public and private players has precisely been in this direction over the last few years.
Chart 2 – Evolution of the number of overnight stays at accommodation units
Accommodation capacity substantially increase over the last decade, with over 50% of the current capacity being completely new and a considerable part of the remaining one having been deeply extended and remodeled.
The expansion of capacity and the promotion of the Azores in the exterior have contributed to significantly increase the number of guests and overnight stays in the Region, as it can be seen by the figures of Charts 1 and 2 respectively.
The origin of visitors has equally been significantly diversified. In 1997, foreigners accounted for only 25% of overnight stays in the Autonomous Region of the Azores. In 2007, they represented more than 50%.
However, we know that this is not a finished process. We live in a world in constant change. The success of the Azores in the fight for this market will depend upon the quality of the products and services that they have to offer visitors.
Landscape and built heritage are not enough to thrive in this market. There is great international competition, with new destinations appearing almost every year. Thus, it is important to create and promote skills that allow us to satisfy the world’s most demanding standards of quality.
3 - Quality of the Azores Destination in the Perspective of
Tourists
3.1 - Partial Indicators of Quality
In order to collect the so-called partial indicators of quality, we used a Likert-type scale. For this purpose, participants are asked, at a certain time of the survey, to evaluate in a scale from 1 (poor) to 5 (excellent) the quality of some of the features of the Azores destination, without comparing it with other competing destinations.
Among the several features, there are the traveling and accommodation cost, the landscape, the weather/climate, the beaches, the historical heritage, the hospitality, the tourist information, the taxi and bus services, the hotels, the restaurants, the bars and cafes, the shops, the nightlife and entertainment, the security, the cleanliness and the general attractions (whale watching, museum, etc.).
Subsequently the participants are confronted with the quality of the Azores destination when compared to competing destinations (islands). For this purpose, we used the same partial indicators described above, rated in a scale ranging from 1 (much worse) to 5 (much better).
Nonetheless, it is not easy to identify/select the competing tourist destinations. To compare the Azores with a single or a reduced number of islands (Martinique or the Canary Islands, for instance) is a risky proposal, since a part of the participants may not be capable of doing that comparison, because they may not know those other places. Thus, we have opted to compare the quality of the Azores destination with the one of other islands, with this being a broader concept, therefore reducing the changes of the participants not answering.
This type of methodology does not seem to be inadequate; recently, a panel of experts of the National Geographic Traveler, a subsidiary magazine of the prestigious National Geographic, compared a number of islands in terms of their
quality as a tourist destination. In this study, the Azores were considered one of the most attractive destinations by a vast panel of experts on sustainable tourism, achieving the second best score among 111 competing islands or archipelagos.
Only the Faroe Islands in Denmark beat the Azores, with the former registering a punctuation of 87 (out of 100) and the latter 84 points. From the 111 islands and archipelagos that were analyzed, only 9 reached a score equal or higher than 80 points. In the third category, there are 43 islands, including Madeira, the Canary Islands and Cape Verde. S. Tomé and Príncipe is part of the category that comprises the Azores, as well as Hawaii, Iceland and Bermuda.
The features that were evaluated were the environmental quality, the social and cultural integrity, the status of the architecture, the aesthetic attraction, the management of tourism and the future perspectives. Above all, the experts examined the degree in which the islands were still not damaged by mass tourism.
The magazine writes about the Azores Archipelago, stating that it is “Not a beach destination or otherwise susceptible to mass tourism; indeed, its capricious climate probably impedes the flow of tourists. The islands' green volcanic mountains and picturesque black-and-white towns look set to remain unspoiled. Wonderful place. Built environment in good shape. Locals are very sophisticated as most have lived overseas. Remote and temperate, the Azores remain lightly touristed. Main visitor type is the independent traveler staying in B&Bs. The ecosystem – from the beautiful hydrangea-covered hills of Flores to the rock-bottomed bays of Terceira – is in great shape. Whales still a frequent sight. Local culture strong and vibrant.” These comments helped to identify some of the partial features/indicators of quality that were used in the present research.
3.2 - Global Indicator of Quality
3.2.1 - Description of the Methodology
In order to obtain the perception of tourists about the global quality of the Azores destination, participants were asked this question based on rating scale ranging from 1 (poor) to 5 (excellent). A question about the perception of the quality of the Azores destination when compared to other islands was also asked, with participants equally rating it in a scale ranging from 1 (much worse) to 5 (much better).
We expect these global indicators of quality to correspond to variations in the partial indicators of quality. In order words, the global indicator of quality is a weighted sum of the partial indicators.
In the regression analysis, the dependent (or to be explained) variable is the perception of the global quality of the Azores destination. The independent (or explicative) variables are the partial indicators of quality.
The rating of the global quality of the Azores destination may, nonetheless, vary according to some characteristics of the visitor, such as nationality, age, gender and education. It may also vary according to some indicators related to the trip, such as its reason, the number of islands visited, the number of days spent in the Azores, among others.
With the aim of gathering this heterogeneity in the perception of the global quality of the Azores destination, the regression also includes in its explicative variables the characteristics of the participant, along with some elements of the trip.
3.2.2 - Ordered Probit Model
3.2.2.1 - Description and Justification of the Model
The dependent variable, which measures the tourists’ perception of the global quality of the Azores destination, is defined in an ordinal scale. For this reason, a large part of the analysis uses the Ordered Probit model.
The propensity for individual i to attribute a certain rating to the global quality of the Azores destination should be considered according to the following process:
i i i X
I* =β' +ε
i = 1, 2, ..., N (1)
where I is a (non-observed) latent variable, i* β a vector of parameters to be
estimated, X a vector of explicative (or exogenous) variables and εi a random
component that is independent and identically distributed N (0, 1).
It is not the variable *
i
I that is observed in the sample, but an I indicator that
represents the quality perception level to which the individual belongs, where:
(2)
The µk (k=1, 2, 3, 4) thresholds are known parameters of the partition of the
standard normal distribution in five intervals. These parameters are estimated together with the vector of parametersβ.
Thus, the probabilities of an individual being in each one of the possible alternatives, regarding the Global Quality of the Azores destination, are provided by: ) ' ( 1 ) ( 1 ) | 5 ( ) ' ( ) ' ( ) ' ' ( ) ( ) | 4 ( ) ' ( ) ' ( ) ' ' ( ) ( ) | 3 ( ) ' ( ) ' ( ) ' ' ( ) ( ) | 2 ( ) ' ( ) ' ( ) ( ) | 1 ( 4 4 * 3 4 4 3 4 * 3 2 3 3 2 3 * 2 1 2 2 1 2 * 1 1 1 1 * i i i i i i i i i i i i i i i i i i i i i i i i X I P X I P X X X X P I P X I P X X X X P I P X I P X X X X P I P X I P X X P I P X I P β µ µ β µ β µ β µ ε β µ µ µ β µ β µ β µ ε β µ µ µ β µ β µ β µ ε β µ µ µ β µ β µ ε µ − Φ − = ≤ − = = − Φ − − Φ = = − ≤ < − = ≤ < = = − Φ − − Φ = = − ≤ < − = ≤ < = = − Φ − − Φ = = − ≤ < − = ≤ < = = − Φ = − ≤ = ≤ = = (3)
whereΦ indicates the distribution function of the standard normal probability.
The model may be estimated through the maximum likelihood method. Given the probabilities defined in (3), the likelihood function is provided by:
{
}
Zij N i j i j i j X X L∏∏
= = − − Φ − − Φ = 1 4 1 1 ' ) ( ) ' (µ β µ β (4)where Zij is an indicator function of the type:
Nonetheless, to facilitate the optimization process, we have opted to maximize the following function:
{
}
∑∑
= = − − Φ − − Φ = N i j i j i j ij X X Z LogL 1 4 1 1 ' ) ( ) ' ( log µ β µ β (5)As long as X contains a constant limit, the parameters to be estimated are not i
identified. To overcome this problem, we use a normalization process in which we establish that µ1=0.
Tourists’ perception of the global quality of the Azores destination corresponds to variations of the partial indicators, allowing the formulation of political options, taking into consideration, namely, the relative value and the relevance of each one of the Region’s attributes. It equally corresponds to variations in the characteristics of individuals and of the trip, something which, once again, allows the definition of policies to turn the Azores into an increasingly attractive destination.
These variations may be obtained through the marginal effects, determined in the following manner:
[
]
[
]
[
]
[
]
[
]
f f f f f f f f f f X X I P X X X I P X X X I P X X X I P X X I P β β µ φ β β µ φ β µ φ β β µ φ β µ φ β β µ φ β µ φ β β µ φ ) ' ( ) 5 ( ) ' ( ) ' ( ( ) 4 ( ) ' ( ) ' ( ) 3 ( ) ' ( ) ' ( ) 2 ( ' ( ) 1 ( 4 4 3 3 2 2 1 1 − = ∂ = ∂ − − − = ∂ = ∂ − − − = ∂ = ∂ − − − = ∂ = ∂ − − = ∂ = ∂ (7)where φ indicates the standard normal density function.
In the case of artificial variables, the marginal effects may be determined through the following formula:
5 ,..., 1 ) 0 | ( ) 1 | ( = = − = = = = ∆ P I j d P I j d j (8)
which provides the marginal effect of the respective probability when the artificial variable changes from 0 to 1.
3.2.2.2 - Hypothesis Tests
The hypothesis test for a number of variables (indicators) is relatively easy, and under some conditions, the values of the restricted likelihood function LogLR and of the unrestricted likelihood function LogLI allow a test of the likelihood ratio of the type:
) (
2 LogLR LogLI
LRT =− − (6)
This function has a chi-square distribution with m degrees of freedom, with m corresponding to the number of restrictions imposed.
4 - Data
The data was collected from surveys made during the month of August 2008. 509 surveys were conducted at the boarding gates of the John Paul II Airport in Ponta Delgada. SATA International, TAP, Sterling, Solveson and Finnair were some of the companies that operated the flights of those who participated in the survey. The forms were printed in both Portuguese and English, with the data collecting document being divided into four sections.
The first section concerned the economic and demographic characteristics of the participant, such as nationality, age, sex, marital status, education, employment and net monthly income.
The second section surveyed, among others, some of the characteristics of the trip, such as its objective, if the participant was visiting the Azores for the first time, the number of days of the stay, the number of islands visited and the number of family members traveling together in this trip.
The third section focused on the global quality of the Azores as a tourism destination and on some partial quality indicators, evaluated on a scale from 1 to 5. Among these, traveling cost, landscape, climate/weather, beaches, historical heritage, hospitality, tourism information, taxis and buses, rent-a-car, hotels, restaurants, bars and cafes, shops, night life and entertainment, safety, cleanness and general attractions (such as whale watching and museums) were included.
Finally, the fourth part aimed to evaluate the quality of the Azores, as well as some quality indicators, in comparison to other islands.
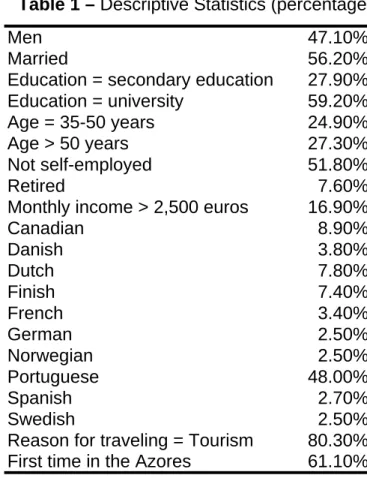
Table 1 includes some descriptive statistical elements to characterize the survey. As it can be seen, 47.1% of the participants were males and 56.2% were married.
Regarding education, the majority of the participants had higher education, meaning university degrees, and approximately 27.3% of them were over 50 years old; 51.8% are non-self-employed workers and about 8% were retired. Only about 17% earned a net monthly income higher than 2,500 euros.
Table 1 – Descriptive Statistics (percentage)
Regarding nationality, 48% were Portuguese, and as for the reason for traveling, 80% traveled for tourism purposes. Approximately 61% of the participants visited the Azores for the very first time.
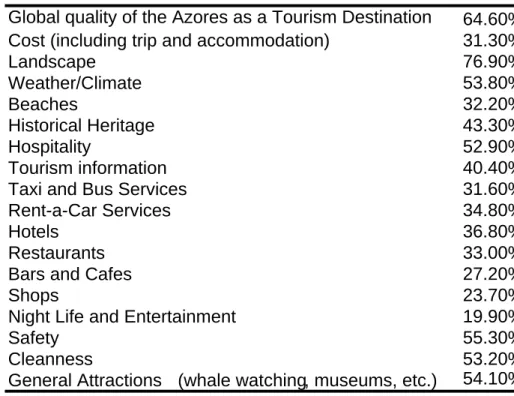
Some results are included in Table 2 regarding the quality of the Azores as a tourism destination, according to the participants’ perspective. In accordance with the information presented, 74% held the opinion that the Global Quality of the Azores as a tourism destination was very good or excellent.
Regarding the results of the partial indicators of quality, it should be highlighted that the ones most highly-rated by the visitors were the landscape, weather/climate, hospitality, cleanness, safety and general attractions (in which whale watching was included).
Among the items less appreciated by the participants were the cost (including trip and accommodation), taxi and bus services, beaches, restaurants, bars and cafes, shops, night life and entertainment.
Men 47.10%
Married 56.20%
Education = secondary education 27.90% Education = university 59.20%
Age = 35-50 years 24.90%
Age > 50 years 27.30%
Not self-employed 51.80%
Retired 7.60%
Monthly income > 2,500 euros 16.90%
Canadian 8.90% Danish 3.80% Dutch 7.80% Finish 7.40% French 3.40% German 2.50% Norwegian 2.50% Portuguese 48.00% Spanish 2.70% Swedish 2.50%
Reason for traveling = Tourism 80.30% First time in the Azores 61.10%
Table 2 – Percentage of individuals who evaluated the quality of the Azores, as
a tourism destination, as “very good” or “excellent”
As for the quality of the Azores in comparison to other islands, approximately 65% of the visitors considered the Azores better or much better.
Regarding the partial indicators of quality, also when the Azores were compared to other islands, the most popular, as per the results indicated in Table 3, were once again the landscape, the weather/climate, the hospitality, the safety, the cleanness and the general attractions (including whale watching). Among the less popular were the beaches, the taxi and bus services, the restaurants, the bars and cafes, the shops, the night life and the entertainment.
Global Quality of the Azores as a Tourism Destination 74.20% Cost (including trip and accommodation) 29.80%
Landscape 89.60% Weather/Climate 76.50% Beaches 53.50% Historical Heritage 56.20% Hospitality 62.80% Tourism Information 49.90%
Taxi and Bus Services 40.80%
Rent-a-Car Services 39.30%
Hotels 46.70%
Restaurants 44.80%
Bars and Cafes 41.20%
Shops 28.80%
Night life and Entertainment 25.60%
Safety 60.30%
Cleanness 59.80%
Table 3 – Percentage of individuals who evaluated the quality of the Azores, in
comparison with other islands, as “better” or “much better”
5 - Regression Analysis: estimated results
5.1 - Global Quality of the Azores as a Tourism Destination
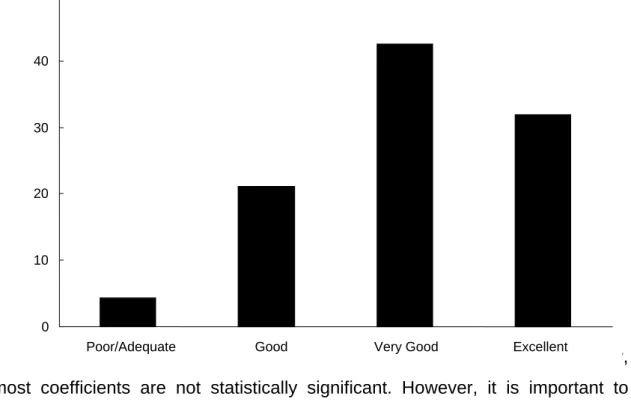
This section attempts to analyze the variations in the Global Quality of the Azores in tourists’ eyes. As per Chart 3, 4.4% of the participants considered the Global Quality of the Azores as a Tourism Destination as poor or adequate, 21.0% as good, 42.6% as very good and 31.9% as excellent.
Thus, the global quality of the Azores as a tourism destination is represented as a numerical indicator. Due to the small amount of replies given in the two lower levels of the scales (poor or adequate), these results were grouped in a single level.
As previously mentioned, the appreciation of the global quality of the Azores destination may vary in accordance to the visitor. This possible heterogeneity is captured by a regression analysis (Ordered Probit).
Global quality of the Azores as a Tourism Destination 64.60% Cost (including trip and accommodation) 31.30%
Landscape 76.90% Weather/Climate 53.80% Beaches 32.20% Historical Heritage 43.30% Hospitality 52.90% Tourism information 40.40%
Taxi and Bus Services 31.60%
Rent-a-Car Services 34.80%
Hotels 36.80%
Restaurants 33.00%
Bars and Cafes 27.20%
Shops 23.70%
Night Life and Entertainment 19.90%
Safety 55.30%
Cleanness 53.20%
Chart 3 – Global Quality of the Azores as a tourism destination (%)
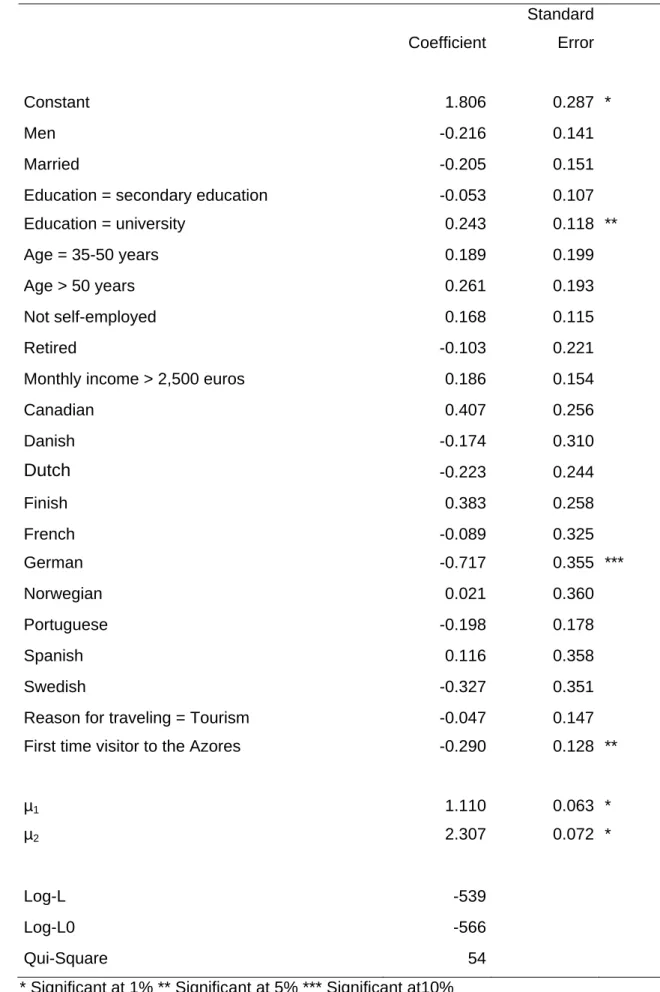
The estimated results of the model are included in Table 4. As one can verify, most coefficients are not statistically significant. However, it is important to highlight some aspects. Firstly, when the Germans are compared to the other visitors, there is a lower probability of the global quality of the Azores destination being considered excellent and a higher probability of it being rated as poor or adequate. The same goes for those who visit the Azores for the first time (when compared to those who had previously visited the region).
As for education, visitors with higher education, when compared to those who have primary or secondary education, demonstrate a higher probability of considering the Azores destination as having an excellent global quality.
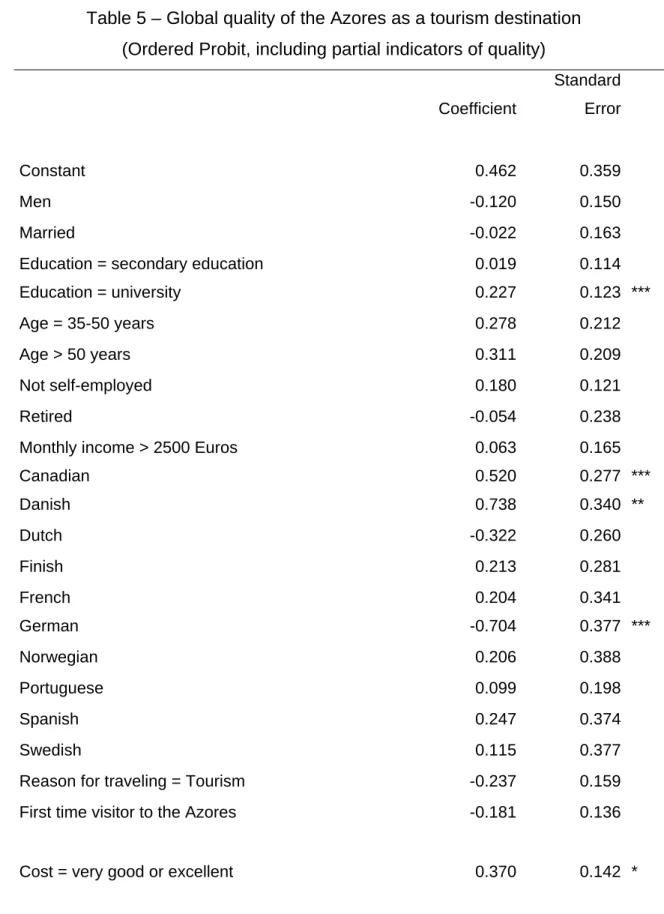
Table 5 tries to capture the fact that the global quality indicator corresponds to the variations of the partial indicators. For this purpose, besides the individual characteristics of the participants, some relating to the evaluation of the quality of some partial indicators were also included among the explicative variables.
As for the characteristics of the participants, some changes were noted when compared to the previous model, but the findings remain valid regarding higher education and the German nationality. The participation of the Danish and the
0 10 20 30 40 50
Poor/Adequate Good Very Good Excellent
Canadian should equally be noted, since they have a higher probability of stating that the quality of the Azores is excellent, when compared to the other nationalities. However, in this model, the fact that the individual was visiting the Azores for the very first time is no longer explanatory.
Table 4 – Global Quality of the Azores as a tourism destination (Ordered Probit) Coefficient Standard Error Constant 1.806 0.287 * Men -0.216 0.141 Married -0.205 0.151
Education = secondary education -0.053 0.107
Education = university 0.243 0.118 **
Age = 35-50 years 0.189 0.199
Age > 50 years 0.261 0.193
Not self-employed 0.168 0.115
Retired -0.103 0.221
Monthly income > 2,500 euros 0.186 0.154
Canadian 0.407 0.256 Danish -0.174 0.310 Dutch -0.223 0.244 Finish 0.383 0.258 French -0.089 0.325 German -0.717 0.355 *** Norwegian 0.021 0.360 Portuguese -0.198 0.178 Spanish 0.116 0.358 Swedish -0.327 0.351
Reason for traveling = Tourism -0.047 0.147 First time visitor to the Azores -0.290 0.128 **
µ1 1.110 0.063 *
µ2 2.307 0.072 *
Log-L -539
Log-L0 -566
Qui-Square 54
The global appreciation of the quality of the Azores as a tourism destination depends on the evaluation of some of the partial indicators made by the visitor, such as cost, weather/climate, hospitality, tourism information, shops, safety and general attractions (whale watching and museums among others).
Table 5 – Global quality of the Azores as a tourism destination (Ordered Probit, including partial indicators of quality)
Coefficient Standard Error Constant 0.462 0.359 Men -0.120 0.150 Married -0.022 0.163
Education = secondary education 0.019 0.114
Education = university 0.227 0.123 ***
Age = 35-50 years 0.278 0.212
Age > 50 years 0.311 0.209
Not self-employed 0.180 0.121
Retired -0.054 0.238
Monthly income > 2500 Euros 0.063 0.165
Canadian 0.520 0.277 *** Danish 0.738 0.340 ** Dutch -0.322 0.260 Finish 0.213 0.281 French 0.204 0.341 German -0.704 0.377 *** Norwegian 0.206 0.388 Portuguese 0.099 0.198 Spanish 0.247 0.374 Swedish 0.115 0.377
Reason for traveling = Tourism -0.237 0.159 First time visitor to the Azores -0.181 0.136
Landscape = very good or excellent 0.057 0.198 Weather/Climate = very good or excellent 0.428 0.152 * Beaches = very good or excellent 0.268 0.124 Historical Heritage = very good or excellent -0.044 0.132 Hospitality = very good or excellent 0.227 0.129 *** Tourism Information = very good or excellent 0.307 0.138 ** Taxi and Bus Services = very good or excellent -0.129 0.134 Rent-a-Car Services = very good or excellent -0.185 0.134 Hotels = very good or excellent 0.180 0.127 Restaurants = very good or excellent 0.066 0.155 Bars and Cafes = very good or excellent -0.078 0.154
Shops = very good or excellent 0.284 0.143 **
Night life and Entertainment = very good or excellent -0.109 0.148
Safety = very good or excellent 0.374 0.132 *
Cleanness = very good or excellent 0.157 0.131 General Attractions = very good or excellent 0.514 0.134 *
µ1 1.397 0.079 *
µ2 2.907 0.092 *
Log-L -456.0
Log-L0 -565.0
Qui-Square 218.0
* Significant at 1% ** Significant at 5% *** Significant at 10%
5.2 - Global Quality of the Azores when compared to other
islands
This section examines the factors underlying the variation of the Global Quality of the Azores as a tourism destination when compared to other islands. As per Chart 4, 4.1% of the participants evaluated the Global Quality of the Azores destination as worse or much worse, 30.9% as similar, 44.2% as better and 20.8% as much better.
Chart 4 – Global Quality of the Azores as a tourism destination when compared
to other islands
The regression analysis included in Table 6 indicates that there is a higher probability of men declaring that the global quality of the Azores is worse or much worse than that of the other islands when compared to women. On the other hand, for those individuals with a higher education there is a higher probability that they will declare that the quality of the Azores is much better. The same applies to the Danish and to those who travel for tourism purposes.
Table 6 – Global Quality of the Azores as a tourism destination in comparison to other islands (Ordered Probit)
Coefficient Standard Error Constant 2.276 0.378 * Men -0.369 0.165 ** Married -0.134 0.183
Education = secondary education -0.063 0.128
Education = university 0.250 0.145 *** Age = 35-50 years 0.155 0.277 0 10 20 30 40 50
Worse/Much worse Similar Better Much better
Age > 50 years -0.217 0.269
Not self-employed -0.151 0.139
Retired -0.543 0.280 ***
Monthly income > 2500 Euros 0.059 0.173
Canadian 0.462 0.297 Danish 0.786 0.462 *** Dutch -0.332 0.279 Finish 0.417 0.278 French -0.153 0.382 German -0.114 0.501 Norwegian 0.560 0.391 Portuguese -0.373 0.207 *** Spanish -0.354 0.425 Swedish -0.519 0.395
Reason for traveling = Tourism 0.391 0.174 **
First time visitor to the Azores -0.485 0.157 *
µ1 1.554 0.083 *
µ2 2.905 0.094 *
Log-L -364 Log-L0 -405 Qui-Square 82 * Significant at 1% ** Significant at 5% *** Significant at 10%
There is a higher probability of the Portuguese, who are the majority of the visitors, declaring that the quality of the Azores is worse or much worse. The same applies to those who visit the Azores for the first time.
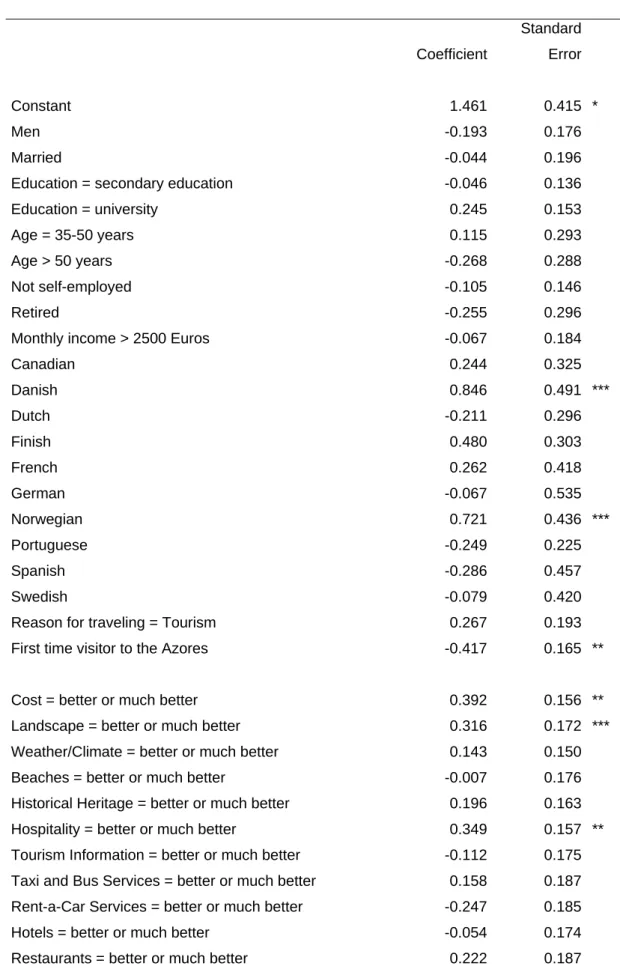
Table 7 – Global quality of the Azores as a tourism destination in comparison to
other islands
(Ordered Probit, including partial indicators of quality)
Coefficient Standard Error Constant 1.461 0.415 * Men -0.193 0.176 Married -0.044 0.196
Education = secondary education -0.046 0.136
Education = university 0.245 0.153
Age = 35-50 years 0.115 0.293
Age > 50 years -0.268 0.288
Not self-employed -0.105 0.146
Retired -0.255 0.296
Monthly income > 2500 Euros -0.067 0.184
Canadian 0.244 0.325 Danish 0.846 0.491 *** Dutch -0.211 0.296 Finish 0.480 0.303 French 0.262 0.418 German -0.067 0.535 Norwegian 0.721 0.436 *** Portuguese -0.249 0.225 Spanish -0.286 0.457 Swedish -0.079 0.420
Reason for traveling = Tourism 0.267 0.193
First time visitor to the Azores -0.417 0.165 **
Cost = better or much better 0.392 0.156 **
Landscape = better or much better 0.316 0.172 *** Weather/Climate = better or much better 0.143 0.150 Beaches = better or much better -0.007 0.176 Historical Heritage = better or much better 0.196 0.163 Hospitality = better or much better 0.349 0.157 ** Tourism Information = better or much better -0.112 0.175 Taxi and Bus Services = better or much better 0.158 0.187 Rent-a-Car Services = better or much better -0.247 0.185 Hotels = better or much better -0.054 0.174 Restaurants = better or much better 0.222 0.187
Bars and Cafes = better or much better 0.021 0.218
Shops = better or much better -0.333 0.204
Night life and Entertainment = better or much better 0.585 0.228 * Safety = better or much better -0.015 0.163 Cleanness = better or much better 0.287 0.165 *** General Attractions = better or much better 0.241 0.170
µ1 1.726 0.096 *
µ2 3.329 0.114 *
Log-L -323 Log-L0 -405 Qui-Square 162 * Significant at 1% ** Significant at 5% *** Significant at 10%
The global appreciation of the quality of the Azores as a tourism destination in comparison to other islands depends on the evaluation that the visitor makes of some partial indicators such as cost, landscape, night life and entertainment, hospitality and cleanness (see Table 7).
6 - Conclusions
Tourism is an activity in expansion in the Autonomous Region of the Azores. As it is well known, this is a region with few opportunities to diversify its export economic base. Tourism has been regarded as a sector that can attain this goal, and thus, contribute to the development and growth of the Azores.
This appears to be an adequate strategy as a significant growth in tourism is expected worldwide. Nonetheless, this is a very competitive industry in which new destinations appear every year and others increase their market share. Destinations are compared to each other, and quality is an important factor in their distinction. Therefore, quality has to be promoted and must always be present within the scope of any strategy that aims at being successful.
Decision making normally requires technical support, based on strict and elaborate studies. This study concerns the Quality of the Azores Destination in the Perspective of Tourists.
According to its findings:
• 74% of those interviewed consider that the global quality of the Azores destination is very good or excellent;
• 65% of those interviewed classified the global quality of the Azores when compared to other islands as better or much better;
• The landscape, weather/climate, hospitality, cleanness and safety were the partial indicators of quality that were most appreciated by the participants;
• The cost of the trip, night life, entertainment and shopping were among the partial indicators of quality that received the worst classification (all of these can be improved by the intervention of public and private entities).
The results of the regression analysis also show that the global indicators of the quality of the Azores as a tourism destination vary with the characteristics of the individuals (heterogeneity) and correspond to variations in some of the partial indicators of quality.
Bibliography
Alexandris, K., Douka, S., Papadopoulos, P. & Kaltsatou A. (2008). “Testing the role of service quality on the development of brand associations and brand loyalty.” Managing Service Quality, 18, 239-254.
Bloemer, J., Ruyter, K. & Wetzels, M. (1999). “Linking perceived service quality and service loyalty: a mutli-dimensional perspective.” Journal of Marketing, 33 11/12, 1082-106.
Box, J. (1983). “Product Quality Assessment by Consumers — the Role of Product Information.” Industrial Management & Data Systems, 3, 25-31.
Crespi, J. & Marette, S. (2006). “Quality and Competition: an empirical analysis across industries.” Iowa State University, Center for Agricultural and Rural Development, Working paper 06-WP 420.
Duffy, J.A.M. & Ketchand, A.A. (1998). “Examining the role of service quality in overall service satisfaction." Journal of Managerial Issues, 10, 240-55.
Elizabeth, T.& Janeen, O. (2006). “The Role of Service Quality in Influencing Brand Attachments at Winery Visitor Centers.” Journal of Quality Assurance in
Hospitality & Tourism, 7, 59 – 77.
Greene, W. (1990). Econometric Analysis. McMillan: New York.
Lancaster, D. (1966). “A New Approach to Consumer Theory.” Journal of
Political Economy, 74, 132-157.
McDougall, G & Levesque, T. (1994). “A revised view of service quality dimensions: an empirical investigation.” Journal of Professional Service
Marketing, 11, 189-209.
Norsworthy, J. & Diana, T. (1999). “The role of service quality and capital technology in telecommunication regulation.” Information Economics and Policy, 11, 127-145.
Rabinovich, E. (2007). “Linking E-Service Quality and Markups: The Role of Imperfect Information in the Supply Chain.” Journal of Operations Management, 25, 14-27.
Sweeney, J., Soutar, G. & Johnson, L. (1997). “Retail service quality and perceived value: a comparison of two models." Journal of Retailing and
Consumer Services, 4, 39-48.
Wong, A. & Sohal, A. (2003). “Service quality and customer loyalty perspectives on two levels of retail relationship.” Journal of Services Marketing, 17, 495-513.
Zeithaml, V., Berry, L. & Parasuraman, A. (1996). “The behavioral consequences of service quality." Journal of Marketing, 60, 31-46.