JRHS
Journal of Research in Health Sciencesjournal homepage: www.umsha.ac.ir/jrhs
Original Article
Should Lifestyles Be a Criterion for Healthcare Rationing? Evidence from a
Portuguese Survey
Ana Pinto Borges (PhD)1*, Micaela Pinho (PhD)2
1 Department of Economic and Management, School of Management, University of ISAG European Business School, Porto, Portugal & Department of Economic,
Faculty of Economics and Business Sciences, University of Lusíada - North
2
Economics, Management and Informatic Department; University Portucalense, OPorto, Portugal & Economics, Management, Industrial Engineering and Tourism Department; University of Aveiro, Aveiro, Portugal
ARTICLE INFORMATION ABSTRACT
Article history:
Received: 15 September 2017
Revised: 13 October 2017
Accepted: 02 November 2017 Available online: 18 November 2017
Background: We evaluated whether different personal responsibilities should influence the allocation healthcare resources and whether attitudes toward the penalization of risk behaviours vary among individual’s sociodemographic characteristics and health related habits.
Study design: A cross-sectional study.
Methods: We developed an online survey and made it available on various social networks for six
months, during 2015. The sample covered the population aged 18 yr and older living in Portugal and we got 296 valid answers. Respondents faced four lifestyle choices: smoking, consumption of alcoholic beverages, unhealthy diet and illegal drug use, and should decide whether each one is relevant when establishing healthcare priorities. Logistic regressions were used to explore the relation of respondents’ sociodemographic characteristics and health related behaviours in the likelihood of agreeing with the patients engaged in risky behaviour deserve a lower priority.
Results: Using illegal drugs was the behaviour most penalized (65.5%) followed by heavy drinkers (61.5%) and smoking (51.0%). The slight penalization was the unhealthy dieting (29.7%). The sociodemographic characteristics had different impact in penalization of the risks’ behaviours. Moreover, the respondents who support the idea that unhealthy lifestyles should have a lower priority, all strongly agreed that the smoking habit (OR=36.05; 95% CI: 8.72, 149.12), the unhealthy diets (OR=12.87; 95% CI: 3.21, 51.53), drink alcohol in excess (OR=20.51; 95% CI: 12.09, 85.46) and illegal drug use (OR=73.21; 95% CI: 9.78, 97.83) must have a lower priority in the access to healthcare.
Conclusions: The respondents accept the notion of rationing healthcare based on lifestyles.
Keywords: Rationing healthcare Risk behaviours Health responsibility Priority setting Portugal * Correspondence Ana Pinto Borges (PhD) Tel:+351 220 303 200 Fax:+351 226 099 223 Email: anaborges@isag.pt
Citation: Borges AP, Pinho M. Should Lifestyles Be a Criterion for Healthcare Rationing? Evidence from a Portuguese Survey. J Res Health Sci. 2017; 17(4): e00399.
Introduction
criterion that has gained importance during the last years supports the concept of equality of substantive opportunities, by taking into account the importance of personal responsibility when allocating the healthcare resources1-3. There is an increasing amount of information about
the relation between health and lifestyles. According to WHO4,
68% of the 56 million deaths worldwide in 2012 were caused by non-communicable diseases and are projected to increase to 52 million in 2030. Four major non-communicable diseases (cardiovascular diseases, cancer, chronic respiratory diseases and diabetes) are responsible for 82% of the non-communicable disease deaths4. This has much to do with lifestyle habits, such as
smoking, alcohol consumption and unhealthy dieting5,6.
Portuguese population has been performing poorly in terms of individual responsibility with their health. The national nutritional and physical activity survey, conducted in 2016, concluded that the Portuguese daily food intake was unbalanced, rich in sodium and sugar, poor in vegetables and fruits7. Furthermore, the
Portuguese are mostly sedentary, with only 27% engaging in one-hour of moderate daily exercise, or half an one-hour of intensive exercise7.This combination may explain that more than half of the
Portuguese population is obese or at risk of becoming obese. In relation to smoking habits, 20% of the Portuguese population (aged 15 yr or over) were regular smokers in 2014. The tobacco consumption was responsible for 19.9% of all of the respiratory disease deaths, 18.6% of the total cancer deaths and 15.2% of the total cardiovascular deaths8. Portugal had the highest alcohol
consumption rates, at the European level, for almost all of the indicators investigated9. Finally, the prevalence of the illicit
substance use throughout life, in 2012, was at 9.5% for the Portuguese population aged 15-64 years9.
This level of incidence of health damaging behaviours is particularly worrying as Portugal insofar as there is enormous pressure to reduce public expenditure on health. In this context we may raise a quite relevant question: ‘Due to the scarcity of the healthcare resources, will it be fair to ration healthcare resources according to each person’s degree of contributing to a particular illness?’
There is a growing empirical literature on the views of the general public regarding the equitable of treating patients differently based on their lifestyles10-15. The results seem to be
inconsistent. While some studies suggest that the general public
would indeed less prioritize those considered in some way responsible for their ill-health10-12,16, others do not find such
evidence13-15. Besides, risk behaviours seem not to be equally
penalized. Few studies have, however, directly and systematically explored simultaneously different health behaviours17,18.
This study examined whether different personal
responsibilities could be taken into consideration when allocation healthcare resources in Portugal, characterized by a universal coverage healthcare system, and whether attitudes toward the penalization of risk behaviours vary among individuals with different sociodemographic characteristics and health related habits. We focused on four risk behaviours: smoking, consumption in excess of alcohol beverage, unhealthy dieting habits and illegal drug use.
Methods
QuestionnaireWe developed an online survey and made it available on various social networks for six months, during 2015. We obtained 296 valid answers. The sample covered the population aged 18 yr and older living in Portugal. Before the implementation of the questionnaire we tested it through a previous sample (with different qualifications, professions and age), in order to verify whether the questions were clearly understood and analyse the overall degree of answers variability. The questionnaire was also validated by experts in the health economy and management. As will be described below (Table 1), our sample approaches the profile of the Portuguese population of most of the variables considered. We applied the test of the validity and reliability for the dependent variables of the questionnaire and we got a high internal reliability (Cronbach's alpha=0.841).
The questionnaire comprises four sections developed elsewhere18and adapted to Portuguese reality. Section A included
the sociodemographic characteristics – gender, age, marital status, monthly income, degree and the employment status. Section B comprises health related habits: smoking status, alcohol consumption habits, consumption of fruits and vegetables, engagement in physical activities, fast food consumption, taking prescribed medication and acute illness. Section C included five general statements concerning the: level of satisfaction with life (one statement), self-reported health status (two statements), recognition that risk behaviours are harmful for health (one statement) and relationship between unhealthy lifestyles and lower priority in access to healthcare (one statement). In this section, respondents expressed the extent of their agreement on a five-point Likert scale (1-completely disagree, 2 - partly agree, 3 -neutral, 4 -partly disagree, 5 -completely disagree). In section D respondents were faced with the following question: “If rationing healthcare is necessary, do you think that the following risk behaviours should determine the priority loss?” The options “yes” and “no” were given. The risk behaviours were: smoking, overeating/unhealthy dieting, heavy drinking and illicit drug use. This last section constitutes the dependent variable while the other three sections reported the independent variables (Table A1).
Respondents were presented with an information sheet and gave their consent for the use of the data.
Data analysis
All the analyses were performed with STATA (version 14). All statistical tests were two-sided and level of significance was set at 0.05. The logistic regressions were used to explore the determinants of the likelihood of agreeing (or disagreeing) with the notion that engaging in risk behaviours (smoking, alcohol abuse, unhealthy dieting and illegal drug use) should justify a lesser priority to healthcare. These models are more appropriate
than the least squares model (OLS)19. Four models where
conducted, with the dummy dependent variable assuming the value of 1, whenever respondents agreed that patients engaged in risk behaviour deserve a lesser priority.
Results
SampleIn the resulting sample of 296 respondents, 57.1% were female. The average age of the sample was 36 years; 58.1% were married and the majority were employed (90.5%). In terms of the monthly income, 18.9% received less or equal than 1000EUR, 34.8% between 1001 EUR and 2000 EUR, 24.0% between 2001EUR and 3000 EUR and 22.3% above 3000 EUR. Concerning qualifications, 1.4% of the respondents had a basic level, 12.8% had secondary education and 63.2% had higher education (Table 1).
Although our sample may not be fully representative of the Portuguese society at large, it is similar in terms of the respondents’ main characteristics - gender, age, marital status and monthly income.
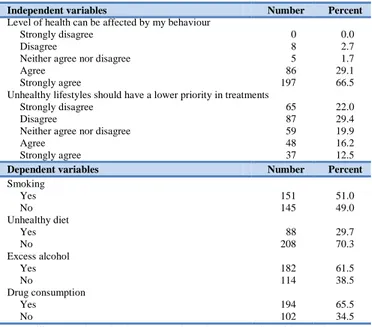
Descriptive statistics of the four dependent variables (smoking; overeating/unhealthy dieting, alcohol abuse and illicit drug use) can be found in the bottom panel of Table 1. Using illegal drugs was the behaviour most penalized (65.5%) followed by heavy drinkers (61.5%) and smoking (51.0%). In the opposite direction appears the slight penalization imposed on the unhealthy dieting (29.7%).
The results from the logistic regression models are summarized in Tables 2-5.
Model 1 – Dependent Variable: Smoking
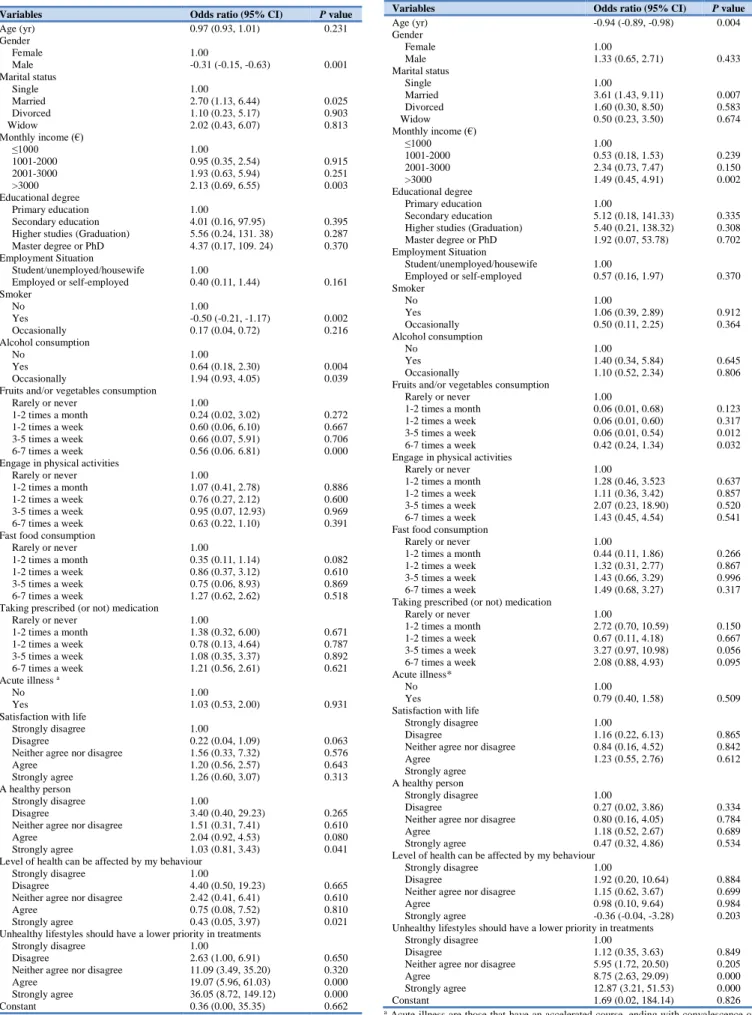
Results of Table 2 suggest that women penalized smoking habit, in relation to those who do not have this habit, less than men (odds ratio (OR)=-0.31; 95% confidence interval (95% CI): -0.15, -0.63). In turn, the respondents with high monthly income penalize more the smokers’ patients than the respondents with lower monthly income (OR=2.13; 95% CI: 0.69, 6.55).
Respondents that smoke (OR=-0.50; 95% CI: -0.21, -1.17) in relation to non-smokers are less likely to agree with the smoking patients’ priority loss when accessing healthcare. On the opposite side, we have the respondents that drink (OR=0.64; 95% CI: 0.18, 2.30) and drink occasionally (OR=1.94; 95% CI: 0.93, 4.05) in relation to those who do not drink have more propensity to defend that the smokers should lose priority over non-smokers. Besides, the respondents that consume 6-7 times a week fruits and/or vegetables (OR=0.56; 95% CI: 0.06, 6.81) in relation to respondents that do not consume fruits and/or vegetables have more propensity to penalize the smoker patients. Furthermore, the respondents that strongly agree (OR=1.03; 95% CI: 0.81, 3.43) with the statement that “I consider myself a healthy person” and strongly agree (OR=36.05; 95% CI: 8.72, 149.12) with “Individuals with unhealthy lifestyles should have a lower priority in treatments” defend that the smoking habit warrants a lower priority in the access to healthcare.
Model 2 – Dependent Variable: Unhealthy Diet
Elderly respondents (OR=-0.94; 95% CI: -0.89, -0.98) tend to agree less with the notion that patients with unhealthy food habits deserve loosing priority in accessing to healthcare (Table 3). On the other side, the married respondents (OR=3.61; 95% CI: 1.43, 9.11), in relation to singles, and those that have high monthly income (OR=1.49; 95% CI: 0.45, 4.91), in relation to respondents with low income, agree more with the notion that patients with unhealthy food habits (when compared with respondents with healthy diet) deserve losing priority in accessing to healthcare.
Within the scope of health related habits, the respondents with a healthier diet, that is to say, those who consume 3-5 times a week (OR=0.06; 95% CI: 0.01, 0.54) or consume 6-7 times a week (OR=0.42; 95% CI: 0.24, 1.34) fruits and vegetables penalize more the access to healthcare for the patients with unhealthy diet. Finally, the respondents who support, strongly agree (OR=12.87; 95% CI: 3.21, 51.53) in relation to strongly disagree the idea that unhealthy lifestyles should have a lower priority in treatments, defend that the patients with unhealthy diets must have a lower priority in the access to healthcare.
Table 1: Descriptive statistics
Independent variables Number Percent
Sociodemographic variables Gender Female 169 57.1 Male 127 42.9 Age (yr) <25 38 12.8 25-35 112 37.8 36-45 95 32.1 46-55 39 13.2 56-68 12 4.1 Marital status Single 101 34.2 Married 172 58.1 Divorced 22 7.4 Widow 1 0.3 Monthly income (€) ≤1000 56 18.9 1001-2000 103 34.8 2001-3000 71 24.0 >3000 66 22.3 Educational degree Primary education 4 1.4 Secondary education 38 12.8
Higher studies (Graduation) 187 63.2
Master degree or PhD 67 22.6 Employment situation Student/unemployed/housewife 43 14.5 Employed/self-employed 253 85.5 Smoking status No 214 72.3 Yes 64 21.6 Occasionally 18 6.1 Alcohol consumption No 117 39.5 Yes 32 10.8 Occasionally 147 49.7
Fruit or vegetables consumption
Rarely or never 2 0.7
1-2 times a month 5 1.6
1-2 times a week 28 9.5
3-5 times a week 95 32.1
6-7 times a week 166 56.1
Engage in physical activities
Rarely or never 73 24.7
1-2 times a month 56 18.9
1-2 times a week 98 33.1
3-5 times a week 62 20.9
6-7 times a week 7 2.4
Fast food consumption
Rarely or never 116 39.2
1-2 times a month 149 50.3
1-2 times a week 27 9.1
3-5 times a week 2 0.7
6-7 times a week 2 0.7
Taking prescribed (or not) medication
Rarely or never 130 43.9 1-2 times a month 93 31.4 1-2 times a week 17 5.7 3-5 times a week 14 4.7 6-7 times a week 42 14.3 Acute illness a No 134 45.3 Yes 162 54.7
Satisfaction with life
Strongly disagree 1 0.3
Disagree 21 7.1
Neither agree nor disagree 15 5.4
Agree 165 55.7
Strongly agree 93 31.5
A healthy person
Strongly disagree 1 0.3
Disagree 13 4.4
Neither agree nor disagree 14 4.7
Agree 177 59.8
Strongly agree 91 30.8
Independent variables Number Percent
Level of health can be affected by my behaviour
Strongly disagree 0 0.0
Disagree 8 2.7
Neither agree nor disagree 5 1.7
Agree 86 29.1
Strongly agree 197 66.5
Unhealthy lifestyles should have a lower priority in treatments
Strongly disagree 65 22.0
Disagree 87 29.4
Neither agree nor disagree 59 19.9
Agree 48 16.2
Strongly agree 37 12.5
Dependent variables Number Percent
Smoking Yes 151 51.0 No 145 49.0 Unhealthy diet Yes 88 29.7 No 208 70.3 Excess alcohol Yes 182 61.5 No 114 38.5 Drug consumption Yes 194 65.5 No 102 34.5
a Acute illness are those that have an accelerated course, ending with convalescence or
death for example, cardiovascular diseases, cancer, among others
Model 3 – Dependent Variable: Alcohol abuse
Elderly respondents (OR=-0.98; 95% CI: -0.93, -1.03) agree less with the penalization of patients drinkers in priority of treatment (Table 4). The respondents with a high monthly income (OR=5.97; 95% CI: 1.60, 22.24) in relation to those who have a lower income and the respondents employed or self-employed (OR=0.20; 95% CI: 0.05, 0.79) in relation to non-employed or unemployed students or homemakers defend more the penalization of heavy drinkers. We also observe that the respondents that smoke (OR=0.62; 95% CI: 0.26, 1.46) and smoke occasionally (OR=0.11; 95% CI: 0.02, 0.64) in relation to non-smokers, who consume alcohol (OR=0.33; 95% CI: 0.08, 1.27) in relation to respondents that do not consume alcohol, who consume 6-7 times a week fruits and/or vegetables (OR=10.05; 95% CI: 0.53, 16.06) in relation to respondents that do not consume fruits and/or vegetables, who have more physical activity (OR=0.21; 95% CI: 0.07, 0.64) in relation to those who practice less sports and who are on medication 1-2 times a month (OR=10.69; 95% CI: 1.40, 81.49) in relation to rarely or never, agreed more with the policy of granting a lower priority to healthcare access for the heavy drinkers. Moreover, the respondents that strongly agree (OR=20.51; 95% CI: 12.09, 85.46) with the notion of setting a lower priority to patients engaged in unhealthy lifestyles, defend more giving a lower priority to healthcare access for the heavy drinkers.
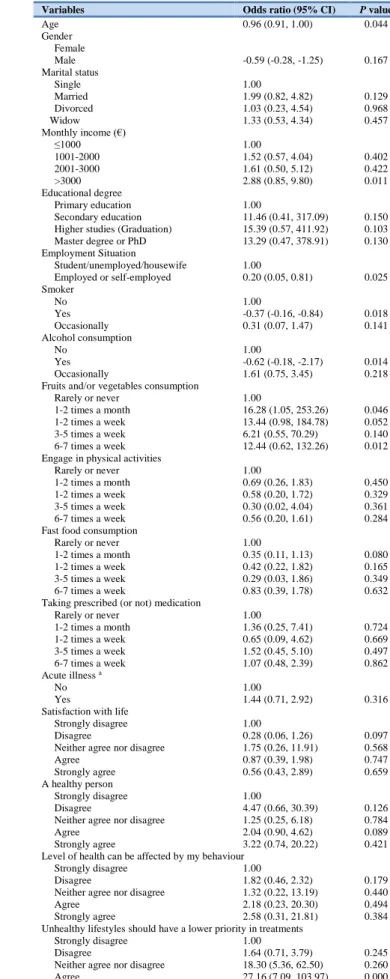
Model 4 – Dependent Variable: Illegal Drug use
Elderly respondents (OR=0.96; 95% CI: 0.91, 1.00) and those with a higher monthly income (OR=2.88; 95% CI: 0.85, 9.80) in relation to those with less income, defend the idea of penalizing illicit drug users in treatment priority (Table 5). On the opposite side are the respondents that smoke (OR=-0.37; 95% CI: -0.16, 0.84) in relation to non-smokers and those who consume alcohol (OR=-0.62; 95% CI: -0.18, -2.17) in relation to the respondents that do not consume alcohol agree with the idea of penalizing illicit drug users in treatment priority. The respondents that consume 6-7 times a week fruits and/or vegetables (OR=12.44; 95% CI: 0.62, 132.26) in relation to respondents that do not consume agree to penalize the priority to the patients that have a drug use habit (in relation to the patients that do not have this habit). Lastly, the respondents who strongly agree (OR=73.21; 95% CI: 9.78, 97.83) with the idea that unhealthy lifestyles should have a lower priority in treatments, defend that the drug use habit warrants a lower priority in the access to healthcare.
Table 2: Association between agree that smoking habit should lost the priority in access
to healthcare (To evaluate the possibility of correlation, we test relations between income and degree - Corr (Monthly Income, Education) = 0.0887.)
Variables Odds ratio (95% CI) P value
Age (yr) 0.97 (0.93, 1.01) 0.231 Gender Female 1.00 Male -0.31 (-0.15, -0.63) 0.001 Marital status Single 1.00 Married 2.70 (1.13, 6.44) 0.025 Divorced 1.10 (0.23, 5.17) 0.903 Widow 2.02 (0.43, 6.07) 0.813 Monthly income (€) ≤1000 1.00 1001-2000 0.95 (0.35, 2.54) 0.915 2001-3000 1.93 (0.63, 5.94) 0.251 >3000 2.13 (0.69, 6.55) 0.003 Educational degree Primary education 1.00 Secondary education 4.01 (0.16, 97.95) 0.395 Higher studies (Graduation) 5.56 (0.24, 131. 38) 0.287 Master degree or PhD 4.37 (0.17, 109. 24) 0.370 Employment Situation Student/unemployed/housewife 1.00 Employed or self-employed 0.40 (0.11, 1.44) 0.161 Smoker No 1.00 Yes -0.50 (-0.21, -1.17) 0.002 Occasionally 0.17 (0.04, 0.72) 0.216 Alcohol consumption No 1.00 Yes 0.64 (0.18, 2.30) 0.004 Occasionally 1.94 (0.93, 4.05) 0.039
Fruits and/or vegetables consumption
Rarely or never 1.00
1-2 times a month 0.24 (0.02, 3.02) 0.272
1-2 times a week 0.60 (0.06, 6.10) 0.667
3-5 times a week 0.66 (0.07, 5.91) 0.706
6-7 times a week 0.56 (0.06. 6.81) 0.000
Engage in physical activities
Rarely or never 1.00
1-2 times a month 1.07 (0.41, 2.78) 0.886
1-2 times a week 0.76 (0.27, 2.12) 0.600
3-5 times a week 0.95 (0.07, 12.93) 0.969
6-7 times a week 0.63 (0.22, 1.10) 0.391
Fast food consumption
Rarely or never 1.00
1-2 times a month 0.35 (0.11, 1.14) 0.082
1-2 times a week 0.86 (0.37, 3.12) 0.610
3-5 times a week 0.75 (0.06, 8.93) 0.869
6-7 times a week 1.27 (0.62, 2.62) 0.518
Taking prescribed (or not) medication
Rarely or never 1.00 1-2 times a month 1.38 (0.32, 6.00) 0.671 1-2 times a week 0.78 (0.13, 4.64) 0.787 3-5 times a week 1.08 (0.35, 3.37) 0.892 6-7 times a week 1.21 (0.56, 2.61) 0.621 Acute illness a No 1.00 Yes 1.03 (0.53, 2.00) 0.931
Satisfaction with life
Strongly disagree 1.00
Disagree 0.22 (0.04, 1.09) 0.063
Neither agree nor disagree 1.56 (0.33, 7.32) 0.576
Agree 1.20 (0.56, 2.57) 0.643
Strongly agree 1.26 (0.60, 3.07) 0.313
A healthy person
Strongly disagree 1.00
Disagree 3.40 (0.40, 29.23) 0.265
Neither agree nor disagree 1.51 (0.31, 7.41) 0.610
Agree 2.04 (0.92, 4.53) 0.080
Strongly agree 1.03 (0.81, 3.43) 0.041
Level of health can be affected by my behaviour
Strongly disagree 1.00
Disagree 4.40 (0.50, 19.23) 0.665
Neither agree nor disagree 2.42 (0.41, 6.41) 0.610
Agree 0.75 (0.08, 7.52) 0.810
Strongly agree 0.43 (0.05, 3.97) 0.021
Unhealthy lifestyles should have a lower priority in treatments
Strongly disagree 1.00
Disagree 2.63 (1.00, 6.91) 0.650
Neither agree nor disagree 11.09 (3.49, 35.20) 0.320
Agree 19.07 (5.96, 61.03) 0.000
Strongly agree 36.05 (8.72, 149.12) 0.000
Constant 0.36 (0.00, 35.35) 0.662
a Acute illness are those that have an accelerated course, ending with convalescence or
death for example, cardiovascular diseases, cancer, among others
Table 3: Association between agree that unhealthy diet should lost the priority in access
to healthcare (To evaluate the possibility of correlation, we test relations between income and degree - Corr (Monthly Income, Education) = 0.0887)
Variables Odds ratio (95% CI) P value
Age (yr) -0.94 (-0.89, -0.98) 0.004 Gender Female 1.00 Male 1.33 (0.65, 2.71) 0.433 Marital status Single 1.00 Married 3.61 (1.43, 9.11) 0.007 Divorced 1.60 (0.30, 8.50) 0.583 Widow 0.50 (0.23, 3.50) 0.674 Monthly income (€) ≤1000 1.00 1001-2000 0.53 (0.18, 1.53) 0.239 2001-3000 2.34 (0.73, 7.47) 0.150 >3000 1.49 (0.45, 4.91) 0.002 Educational degree Primary education 1.00 Secondary education 5.12 (0.18, 141.33) 0.335 Higher studies (Graduation) 5.40 (0.21, 138.32) 0.308 Master degree or PhD 1.92 (0.07, 53.78) 0.702 Employment Situation Student/unemployed/housewife 1.00 Employed or self-employed 0.57 (0.16, 1.97) 0.370 Smoker No 1.00 Yes 1.06 (0.39, 2.89) 0.912 Occasionally 0.50 (0.11, 2.25) 0.364 Alcohol consumption No 1.00 Yes 1.40 (0.34, 5.84) 0.645 Occasionally 1.10 (0.52, 2.34) 0.806
Fruits and/or vegetables consumption
Rarely or never 1.00
1-2 times a month 0.06 (0.01, 0.68) 0.123
1-2 times a week 0.06 (0.01, 0.60) 0.317
3-5 times a week 0.06 (0.01, 0.54) 0.012
6-7 times a week 0.42 (0.24, 1.34) 0.032
Engage in physical activities
Rarely or never 1.00
1-2 times a month 1.28 (0.46, 3.523 0.637
1-2 times a week 1.11 (0.36, 3.42) 0.857
3-5 times a week 2.07 (0.23, 18.90) 0.520
6-7 times a week 1.43 (0.45, 4.54) 0.541
Fast food consumption
Rarely or never 1.00
1-2 times a month 0.44 (0.11, 1.86) 0.266
1-2 times a week 1.32 (0.31, 2.77) 0.867
3-5 times a week 1.43 (0.66, 3.29) 0.996
6-7 times a week 1.49 (0.68, 3.27) 0.317
Taking prescribed (or not) medication
Rarely or never 1.00 1-2 times a month 2.72 (0.70, 10.59) 0.150 1-2 times a week 0.67 (0.11, 4.18) 0.667 3-5 times a week 3.27 (0.97, 10.98) 0.056 6-7 times a week 2.08 (0.88, 4.93) 0.095 Acute illness* No 1.00 Yes 0.79 (0.40, 1.58) 0.509
Satisfaction with life
Strongly disagree 1.00
Disagree 1.16 (0.22, 6.13) 0.865
Neither agree nor disagree 0.84 (0.16, 4.52) 0.842
Agree 1.23 (0.55, 2.76) 0.612
Strongly agree A healthy person
Strongly disagree 1.00
Disagree 0.27 (0.02, 3.86) 0.334
Neither agree nor disagree 0.80 (0.16, 4.05) 0.784
Agree 1.18 (0.52, 2.67) 0.689
Strongly agree 0.47 (0.32, 4.86) 0.534
Level of health can be affected by my behaviour
Strongly disagree 1.00
Disagree 1.92 (0.20, 10.64) 0.884
Neither agree nor disagree 1.15 (0.62, 3.67) 0.699
Agree 0.98 (0.10, 9.64) 0.984
Strongly agree -0.36 (-0.04, -3.28) 0.203 Unhealthy lifestyles should have a lower priority in treatments
Strongly disagree 1.00
Disagree 1.12 (0.35, 3.63) 0.849
Neither agree nor disagree 5.95 (1.72, 20.50) 0.205
Agree 8.75 (2.63, 29.09) 0.000
Strongly agree 12.87 (3.21, 51.53) 0.000
Constant 1.69 (0.02, 184.14) 0.826
a Acute illness are those that have an accelerated course, ending with convalescence or
Table 4: Association between agree that drinking alcohol in excess should lost the
priority in access to healthcare (To evaluate the possibility of correlation, we test relations between income and degree - Corr (Monthly Income, Education) = 0.0887)
Variables Odds ratio (95% CI) P value
Age (yr) -0.98 (-0.93, -1.03) 0.003 Gender Female 1.00 Male 1.12 (0.52, 2.42) 0.769 Marital status 1.00 Single 1.99 (0.79, 5.03) 0.144 Married 3.45 (0.73, 16.4) 0.120 Divorced 2.03 (0.04, 0.70) 0.820 Widow Monthly income (€) 1.00 ≤1000 3.59 (1.25, 10.27) 0.017 1001-2000 3.40 (1.00, 11.59) 0.050 2001-3000 5.97 (1.60, 22.24) 0.032 >3000 Educational degree 1.00 Primary education 8.79 (0.25, 313.15) 0.233 Secondary education 10.62 (0.31, 360.67) 0.189 Higher studies (Graduation) 6.98 (0.19, 254.74) 0.290 Master degree or PhD Employment Situation Student/unemployed/housewife 1.00 Employed or self-employed 0.20 (0.05, 0.79) 0.022 Smoker No 1.00 Yes 0.62 (0.26, 1.46) 0.002 Occasionally 0.11 (0.02, 0.64) 0.014 Alcohol consumption No 1.00 Yes 0.33 (0.08, 1.27) 0.001 Occasionally 1.07 (0.50, 2.32) 0.858
Fruits and/or vegetables consumption
Rarely or never 1.00
1-2 times a month 5.27 (0.29, 94.82) 0.259 1-2 times a week 11.75 (0.73, 18.00) 0.082 3-5 times a week 3.71 (0.29, 47.52) 0.313 6-7 times a week 10.05 (0.53, 16.06) 0.012 Engage in physical activities
Rarely or never 1.00
1-2 times a month 0.26 (0.09, 0.76) 0.014 1-2 times a week 0.37 (0.12, 1.15) 0.085 3-5 times a week 0.14 (0.01, 2.00) 0.149 6-7 times a week 0.21 (0.07, 0.64) 0.003 Fast food consumption
Rarely or never 1.00
1-2 times a month 1.33 (0.94, 4.08) 0.260 1-2 times a week 1.22 (0.98, 3.46) 0.553 3-5 times a week 0.23 (0.06, 0.87) 0.130 6-7 times a week 0.88 (0.40, 1.95) 0.756 Taking prescribed (or not) medication
Rarely or never 1.00 1-2 times a month 10.69 (1.40, 81.49) 0.022 1-2 times a week 0.59 (0.09, 3.89) 0.583 3-5 times a week 1.07 (0.31, 3.61) 0.919 6-7 times a week 1.58 (0.69, 3.61) 0.281 Acute illness* No 1.00 Yes 1.50 (0.72, 3.11) 0.282
Satisfaction with life
Strongly disagree 1.00
Disagree 0.20 (0.04, 0.94) 0.042
Neither agree nor disagree 2.16 (0.37, 12.72) 0.396
Agree 1.36 (0.58, 3.17) 0.482
Strongly agree 4.16 (3.06, 13.44) 0.878 A healthy person
Strongly disagree 1.00
Disagree 3.88 (0.38, 39.61) 0.252
Neither agree nor disagree 2.28 (0.40, 13.09) 0.356
Agree 1.51 (0.65, 3.53) 0.338
Strongly agree 3.25 (2.43, 8.64) 0.446
Level of health can be affected by my behaviour
Strongly disagree 1.00
Disagree 0.32 (0.27, 6.5) 0.738
Neither agree nor disagree 1.11 (0.22, 16.22) 0.532
Agree 0.77 (0.07, 8.5) 0.829
Strongly agree 1.08 (0.11, 10.72) 0.947 Unhealthy lifestyles should have a lower priority in treatments
Strongly disagree 1.00
Disagree 2.92 (1.17, 7.31) 0.222
Neither agree nor disagree 23.38 (6.86, 79.62) 0.340
Agree 47.74 (12.15, 187.54) 0.000
Strongly agree 20.51 (12.09, 85.46) 0.000
Constant 0.02 (0.00, 3.13) 0.126
a Acute illness are those that have an accelerated course, ending with convalescence or
death for example, cardiovascular diseases, cancer, among others
Table 5: Association between agree that illegal drug user should lost the priority in access
to healthcare
Variables Odds ratio (95% CI) P value
Age 0.96 (0.91, 1.00) 0.044 Gender Female Male -0.59 (-0.28, -1.25) 0.167 Marital status Single 1.00 Married 1.99 (0.82, 4.82) 0.129 Divorced 1.03 (0.23, 4.54) 0.968 Widow 1.33 (0.53, 4.34) 0.457 Monthly income (€) ≤1000 1.00 1001-2000 1.52 (0.57, 4.04) 0.402 2001-3000 1.61 (0.50, 5.12) 0.422 >3000 2.88 (0.85, 9.80) 0.011 Educational degree Primary education 1.00 Secondary education 11.46 (0.41, 317.09) 0.150 Higher studies (Graduation) 15.39 (0.57, 411.92) 0.103 Master degree or PhD 13.29 (0.47, 378.91) 0.130 Employment Situation Student/unemployed/housewife 1.00 Employed or self-employed 0.20 (0.05, 0.81) 0.025 Smoker No 1.00 Yes -0.37 (-0.16, -0.84) 0.018 Occasionally 0.31 (0.07, 1.47) 0.141 Alcohol consumption No 1.00 Yes -0.62 (-0.18, -2.17) 0.014 Occasionally 1.61 (0.75, 3.45) 0.218
Fruits and/or vegetables consumption
Rarely or never 1.00
1-2 times a month 16.28 (1.05, 253.26) 0.046 1-2 times a week 13.44 (0.98, 184.78) 0.052 3-5 times a week 6.21 (0.55, 70.29) 0.140 6-7 times a week 12.44 (0.62, 132.26) 0.012 Engage in physical activities
Rarely or never 1.00
1-2 times a month 0.69 (0.26, 1.83) 0.450
1-2 times a week 0.58 (0.20, 1.72) 0.329
3-5 times a week 0.30 (0.02, 4.04) 0.361
6-7 times a week 0.56 (0.20, 1.61) 0.284
Fast food consumption
Rarely or never 1.00
1-2 times a month 0.35 (0.11, 1.13) 0.080
1-2 times a week 0.42 (0.22, 1.82) 0.165
3-5 times a week 0.29 (0.03, 1.86) 0.349
6-7 times a week 0.83 (0.39, 1.78) 0.632
Taking prescribed (or not) medication
Rarely or never 1.00 1-2 times a month 1.36 (0.25, 7.41) 0.724 1-2 times a week 0.65 (0.09, 4.62) 0.669 3-5 times a week 1.52 (0.45, 5.10) 0.497 6-7 times a week 1.07 (0.48, 2.39) 0.862 Acute illness a No 1.00 Yes 1.44 (0.71, 2.92) 0.316
Satisfaction with life
Strongly disagree 1.00
Disagree 0.28 (0.06, 1.26) 0.097
Neither agree nor disagree 1.75 (0.26, 11.91) 0.568
Agree 0.87 (0.39, 1.98) 0.747
Strongly agree 0.56 (0.43, 2.89) 0.659
A healthy person
Strongly disagree 1.00
Disagree 4.47 (0.66, 30.39) 0.126
Neither agree nor disagree 1.25 (0.25, 6.18) 0.784
Agree 2.04 (0.90, 4.62) 0.089
Strongly agree 3.22 (0.74, 20.22) 0.421
Level of health can be affected by my behaviour
Strongly disagree 1.00
Disagree 1.82 (0.46, 2.32) 0.179
Neither agree nor disagree 1.32 (0.22, 13.19) 0.440
Agree 2.18 (0.23, 20.30) 0.494
Strongly agree 2.58 (0.31, 21.81) 0.384
Unhealthy lifestyles should have a lower priority in treatments
Strongly disagree 1.00
Disagree 1.64 (0.71, 3.79) 0.245
Neither agree nor disagree 18.30 (5.36, 62.50) 0.260
Agree 27.16 (7.09, 103.97) 0.000
Strongly agree 73.21 (9.78, 97.83) 0.000
Constant 0.02 (0.00, 3.05) 0.131
a Acute illness are those that have an accelerated course, ending with convalescence or
death for example, cardiovascular diseases, cancer, among others. To evaluate the possibility of correlation, we test relations between income and degree - Corr (Monthly Income, Education) = 0.0887.
Discussion
In Portugal, as in most western societies, the rapidly rising healthcare expenditures, coupled with the increasing pressure to maintain a balanced state budget may jeopardize the universal healthcare access. One possible way of differentiating the patients’ healthcare access is through taking into account their specific lifestyle behaviours. This selection maybe particularly relevant in Portugal insofar as Portuguese citizens seem to fail in meeting their societal obligation as is contemplated in the Constitution of Portuguese Republic: “Everyone has the right to health protection and the duty to protect and promote it”20.
In this context, we conducted an exploratory study to identify whether Portuguese respondents accept lifestyles (smoking, unhealthy dieting, alcohol abuse and illicit drug use) as a criterion to access to healthcare and, if so, to identify which is the most condemned one. One key strength of our study is that it is the first time that views about establishing priorities between patients supported by lifestyles choices in Portuguese society have been assessed in a systematic way. The results seem to be, in general, quite robust. The notion that individuals with unhealthy lifestyles should indeed have lower priority in treatments was statistically significant for all of the detrimental behavioural patterns. This result is consistent with the desert-based distribution principle of healthcare.
One common desert issue in healthcare context is the lifestyle choices of people whose ill-health is related to those choices.3This
idea rests in the principle of equality of substantive opportunity for health,1according to which inequality in achieving health
outcomes may be acceptable if it arises from unhealthy lifestyle choices for which individuals ought to be held responsible. An implication is that patients who are deemed partly responsible for their own illness should receive lower priority for treatment. The results indicate a wider consensus, among respondents, in giving lower priorities to patients that use illegal drugs, that drink alcohol in excess and that smoke. From all the lifestyles, illicit drug use was the most penalized. Heavy drinking was more penalized than smoking, which is consistent with some previous research results14. Following an unhealthy diet, by contrast, was the
lifestyle less penalized. We can only speculate with regard to the reasons of such a lower penalty rate. One possible explanation is that it is commonly known that maintaining a healthy diet is quite expensive preventing numerous people from following it. So, consuming a cheaper diet, rich in fat and sugar may be excused. This notion seems to be corroborated by the results in Table 3. Those respondents who believed that harmful behaviours affect health were also those that most disagreed with limiting the access to healthcare to patients not following a healthy diet. The same notion was revealed by the respondents following a healthy diet. Recent data suggests that during 2015-2016, 10.1% of Portuguese families experienced food insecurity. This means that they had difficulty in providing sufficient amounts of food for the entire family, due to the lack of financial resources7.
Furthermore, respondents’ attitudes with regard to the penalization of risk behaviours seem to adhere to the rational choice theory. With the exception of the unhealthy diet habit, respondents seem to prefer the distribution mechanism that is most advantageous for them. This was notorious with patients’ smoking and drinking habits. Smoking respondents (heavy drinkers) disagreed that smoking (alcohol abuse) should bar the access to healthcare. These results converge to international findings.15 Our analysis also shows that older respondents are
significantly less likely to penalize unhealthy diet practices and heavy alcohol beverage consumption. Both risky behaviours are more prevalent among the elderly. Recent data revealed that the prevalence of obesity in Portugal is much higher among the
elderly (39.2%, compared with the national average of 22.3%) and the consumption of alcohol beverages is particularly higher for the same group (298 g/d, compared with the national average of 146 g/d).7Contrary to previous findings, there is no evidence of
gross-behaviour effects.18 Our results seem to suggest that smokers or
heavy drinkers are more willing to agree that heavy drinkers or smokers should lose priority in access to healthcare. On the other hand, respondents with higher levels of income are significantly more likely to agree that risky behaviour should influence the establishing of priorities to healthcare access, penalize all the harmful behavioural patterns. This may be explained by the fact that they contribute more to the health system, through taxes, and as such think the money should be most effectively spent.
The results should be interpreted with appropriate caution, however, given the non-random nature of the sample. The findings cannot be generalized to the Portuguese people at large. According to recent data, in Portugal, there is a predominance of female inhabitants (52.6%), the average age of the population is 41.8 yr, 40.5% are married and the monthly income is 1083 EUR (Pordata, 2017). The sample was better educated than the general population (only 17.1% of the population has higher education)21.
Furthermore, the data were collected through an online questionnaire. We are quite aware that the mode of administrating the questionnaire has important repercussions for the subsequent respondents’ sample. The online surveys method enables a large number of responses to be collected quickly and relatively cheaply, but raises concerns with regard to the quality of data obtained and denies the researcher a representative population sample. Even so, in the recent years there has been an increasing interest in collecting data online22-24. There is a lack of literature
examining the impact of this mode of administrating a survey, in order to elicit societal preferences. The majority of the studies find an overall, broadly similar response throughout all the different survey administration modes22-24. Besides this sampling
limitation, there are also concerns with regard to submitting the questions related to setting healthcare priorities to individuals under the universal coverage health system.
Conclusions
Overall, Portuguese respondents accept the notion of rationing healthcare based on lifestyles. This serves to explain the public’s acceptance of the measures undertaken by the Portuguese government during the last few years in order to control tobacco and alcohol abuse (through indirect tax increases and the prohibition of indoor smoking) and, more recently, by controlling the excessive intake of sugars in non-alcohol beverages. Our analysis suggests that future policies, advocating rationing based on individual responsibility, might be supported by the Portuguese population. We believe that given the high incidence of risk behaviours in Portuguese society it would be worth investing in health literacy policies. This policy could decrease the incidence of chronic diseases by informing citizens about the social costs of their lifestyles and the potential hazard on their health status.
In follow-up research, it would be useful to explore the views of health professionals about using lifestyles as a criterion to establish priorities between patients. Moreover, it would be useful to extend this study to a representative sample of the Portuguese population and then compare the opinions of general population with those of health professionals. It would also be useful to conduct international comparative research using a common study design – either this one or another common format – in order to explore existing cultural differences and trace the patterns of common distributive principles.
Acknowledgements
We are deeply grateful to Duje Petricevic for useful comments and suggestions.
Conflict of interest statement
The authors declare that they have no conflict of interest.
Funding
The authors disclosed receipt of any financial support for the research, authorship, and/or publication of this article.
Highlights
More than half of the Portuguese respondents penalized unhealthy lifestyles (smoking, consumption of alcoholic beverages, unhealthy diet and illegal drug use).
Illegal drug users were the most penalized group, followed by those consuming alcohol excessively, as well as those smoking. However, unhealthy dieting was only residually penalized.
Sociodemographic characteristics and health related behavior play a different role when penalizing the unhealthy lifestyles.
References
1. LeGrand J. Equity, efficiency and the rationing of health care. In:
Culyer A, Wagstaff A, editors. Reforming health care systems: Experiments with NHS. Cheltenham: Edward Elgar; 1996. pp. 150-64.
2. Cappelen AW, Norheim OF. Responsibility in health care: a
liberal egalitarian approach. J Med Ethics. 2005; 31(8): 476-80.
3. Cappelen AW, Norheim OF. Responsibility, fairness and
rationing in health care. Health Policy. 2006; 76(3): 312-9.
4. WHO. Global status report on non-communicable diseases. WHO Web Site; 2014 [cited 7 Jun, 2017] Available from:
http://www.who.int/nmh/publications/ncd-status-report-2014/en/.
5. Alwan A, Maclean DR, Riley LM, d' Espaignet ET, Mathers CD,
Stevens GA, Bettcher D. Monitoring and surveillance of noncommunicable diseases: progress and capacity in high burden countries. Lancet. 2010; 376: 1861-68.
6. Van der Star SM, Van der Berg B. Individual responsibility and
health-risk behaviour: A contingent valuation study from the ex-ante societal perspective. Health Policy. 2011; 101(3): 300-11.
7. IANAF. Inquérito Alimentar Nacional e de Atividade Física
2015-2016. IANAF Web site; 2017 [cited 5 Jun, 2017] Available from: https://ian-af.up.pt/resultados.
8. DGS - Direção Geral de Saúde. Portugal-Prevenção e Controlo
do tabagismo em números 2015. DGS web site; 2015 [cited 11
Feb, 2016] Available from:
https://www.dgs.pt/em- destaque/portugal-prevencao-e-controlo-do-tabagismo-em-numeros-201511.aspx.
9. SICAD – Serviço de intervenção nos Comportamentos Aditivos
e nas Dependências. A situação do país em matéria de álcool; SICAD Web site; 2015 [cited 11 Feb, 2016] Available from: http://www.sicad.pt.
10. Olsen JA, Richardson J, Dolan P, Menzel P. The moral relevance
of personal characteristics in setting health care priorities. Soc Sci Med. 2003; 57(7): 1163-72.
11. Van Exel J, Baker R, Mason H, Donaldson C, Brouwer W,
EuroVaQ Team. Public views on principles for health care priority setting: Findings of a European cross-country study using Q methodology. Soc Sci Med. 2015; 126: 128-37.
12. Gu Y, Lancsar E, Ghijben P, Butler JR, Donaldson C. Attributes
and weights in healthcare priority setting: A systematic review of what counts and to what extent. Soc Sci Med. 2015; 146: 41-52.
13. Pinho M, Borges A. Bedside healthcare rationing dilemmas: a
survey from Portugal. Int J Hum Rights Healthc. 2015; 8(4): 233-46.
14. Pinho M. Social and ethical criteria for prioritizing patients: a
survey of students and health professionals in Portugal. Ciência & Saúde Coletiva. 2016; 21(12): 3917-26.
15. Rogge J, Kittel B. Who Shall Not Be Treated: Public Attitudes on
Setting Health Care Priorities by Person-Based Criteria in 28 Nations. PLoS One. 2016; 11(6): e0157018.
16. Kasemsup V, Schommer JC, Cline RR, Hadsall RS. Citizen´s
preferences regarding principles to guide health care allocation decisions in Thailand. Value in Health. 2008; 11(7): 1194-202.
17. Bringedal B, Feiring E. On the relevance of personal
responsibility in priority setting: a cross-sectional survey among Norwegian medical doctors. J Med Ethics. 2011; 37(6): 357-61.
18. Miraldo M, Galizzi MM, Merla A, Levaggi R, Schulz PJ, Auxilia
F, Castaldi S, Gelatti U. Should I pay for your risky behaviours? Evidence from London. Prev Med. 2014; 66: 145-58.
19. Wooldridge JM. Introductory econometrics: A modern approach.
5th ed. Mason, OH: South-Western, Cengage Learning; 2013.
20. CRP - Constituição da República Portuguesa. Sétima Revisão.
Assembleia da República; 2005.
21. PORDATA. PORDATA - Fundação Francisco Manuel dos
Santos (2014/2015). PORDATA Web site; 2017 [cited 26 Mar, 2017] Available from: http://www.pordata.pt/en/Portugal.
22. Covey J, Robinson A, Jones-Lee M, Loomes G. Responsibility,
scale and valuation of rail safety. J Risk Uncertain. 2010; 40: 85-108.
23. Mulhern B, Longworth L, Brazier J, Rowen D, Bansback N,
Devlin N, Tsuchiya A. Binary choice health state valuation and mode of administration: Head-to-head comparison of online and CAPI. Value in Health. 2013; 16(1): 104-13.
24. Rowen D, Brazier J, Keetharuth A, Tsuchiya A. Comparison of
modes of administration and alternative formats for eliciting societal preferences for burden of illness. Applied Health Econ Health Policy. 2016; 14(1): 89-104.