Faculdades de Medicina Enfermagem e Nutrição da Universidade Federal de Goiás Mailing address: Maria do Rosário Gondim Peixoto - 1a Avenida, S/N – 2º piso
-Hospital das Clínicas – 74605-080 – Goiânia, GO - Brazil
Objective - To evaluate the effects of diet and
medica-tion, either isolated or associated, on serum levels of uric acid in patients with hyperuricemia.
Methods - We studied patients from the Hypertension
Unit of the University of Goias who had hyperuricemia (men >8.5mg/dL and women >7.5mg/dL). We divided the patients into three groups: G1 (low purine diet), G2 (low purine diet + medication), and G3 (medication only). Pa-tients received allopurinol, 150mg/day titrated up to 300mg/dL when necessary. Patients were evaluated with regards to their lifestyles (diet, smoking, physical, activity, alcohol consumption), uric acid, blood pressure, use of medication, body mass index, cholesterol, and triglyceri-de. Follow-up took place in weeks 0 (M1), 6 (M2), 12 (M3) during the intervention and in week 36(M4) after the study was completed.
Results - Fifty-five patients participated in the study,
31 women, mean age 54.4±10.6 years, body mass index 28.6±3.9kg/m2. A similar reduction (p<0.001) in uric acid levels occurred in the three intervention groups. In week 36 (M4), after 24 weeks without intervention, a tendency toward elevation of uricemia was noted in G2 and G3, and a continuous drop in uricemia was noted in G1. No signifi-cant modifications were observed in the other variables analyzed.
Conclusion - Considering the cost x benefit
relation-ship, a diet low in purine should be the 1st therapeutic op-tion for controlling hyperuricemia in patients with similar characteristic to the ones presented in this study.
Key words: arterial hypertension, uric acid, low-purine diet
Arq Bras Cardiol, volume 76 (nº 6), 468-72, 2001
Maria do Rosário Gondim Peixoto, Estelamaris Tronco Monego, Paulo César B. Veiga Jardim, Magna Maria Carvalho, Ana Luiza Lima Sousa, Jonivan Siqueira de O liveira, O tavio Balestra N eto
Goiânia, GO - Brazil
Diet and Medication in the Treatment of Hyperuricemia in
Hypertensive Patients
Hyperuricemia is a metabolic disorder marked by an ex-cess of uric acid in the blood, which is the product of a disor-der in purine etabolism. Urates, deposited in tophi in joints, and tissues produce a state called gout (inflammatory arthritis or tophaceous gout). This term “gout” should not be used when referring to isolated hyperuricemia. For a rea-son yet unknown, some individuals have difficulty in elimi-nating uric acid, the final product of purine metabolism 1,2.
Although it is not an independent risk factor for the development of ischemic heart disease and general mortali-ty, uric acid levels have proved to be important markers for other risk factors of cardiovascular diseases, such as hyper-tension, obesity, dyslipidemia, hyperinsulinemia and a “sedentary” lifestyle. Hyperuricemia is, therefore, frequen-tly found in the same clinical conditions that are associated with insulin resistance 3-6.
The most common causes of hyperuricemia are diet, alcohol consumption, and physical activity excesses, and obesity is a strongly associated factor. Hyperuricemic thera-py consists of recommendations for a diet low in purines, hydration, alkalinization of urine, and the use of drugs that increase excretion or decrease uric acid production 7. During clinical follow-up of these patients, little emphasis has been given to nonpharmacologic control of hyperuricemia, com-pared with other risk factors for cardiovascular diseases.
The present study was aimed at evaluating the reduc-tion of uric acid levels in hypertensive patients with hyperu-ricemia without the acute gout syndrome, through dietary treatment, drug treatment, and the combination of both the-rapies.
Methods
Sixty patients, males and females, who had enrolled in the Liga de Hipertensão Arterial da Universidade Federal
de Goiás (LHA/UFG) (Arterial Hypertension Division of
in-cluded in this study values had to be >8.5mg/dL for men and >7.5mg/dL for women.
Criteria for exclusion included hepatic, renal, or thyroid illness, pregnancy, stroke, or myocardial infarction in the last six months, hypertension, or uncontrolled diabetes, as well as patients using drugs of the following types: allopu-rinol, corticoids, appetite suppressants, hypoglycemic (gli-clazide) drugs, xanthine oxidoreductase and hormone inhi-bitors, use of which would influence uricemia.
The protocol for this study was approved by the ethics committee of the University Hospital of the Federal Univer-sity of Goias, and all patients were informed about and agreed to the terms of the study.
The study was of the clinical essay type, in which pa-tients were randomly distributed into three groups: G1 – pati-ents were prescribed a diet for hyperuricemia; G2 – patipati-ents were prescribed a diet for hyperuricemia + allopurinol; and G3 – patients were prescribed only allopurinol.
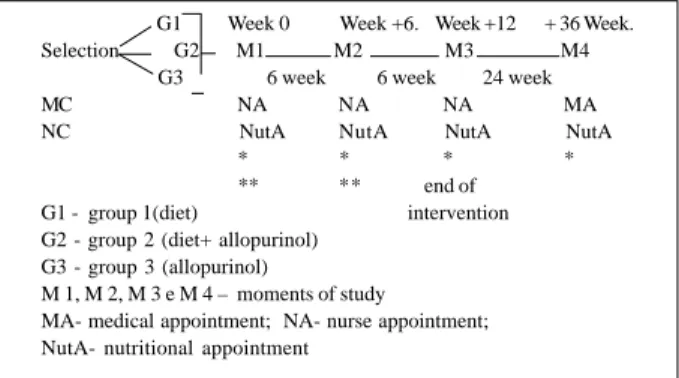
The experiment lasted for 36 weeks, and the follow-up was divided into 4 periods (M1, M2, M3, and M4). The first evaluation (M1) was carried out at the beginning of the study, the 2nd (M2) after six weeks, the 3rd (M3) after 12 wee-ks, and the 4th (M4) after a period of another 24 weeks wi-thout any kind of intervention, including no use of medica-tion. At each stage, apart from the orientation for the use of either diet or medication or both, evaluation of anthropome-tric measurements (weight, height, body mass index), dietary consumption, biochemical examination (uric acid, total cho-lesterol, triglyceride, and glycemia at fasting), and blood pressure were also carried out (Fig. 1).
At each appointment, the patients answered a semi-quantitative questionnaire about the frequency of food consumption n which intake of high caloric macronutrients (carbohydrates, proteins, and lipids) was calculated, and the frequency of consumption of dietary sources of purine and oxalic acid was observed. The questionnaire also inclu-ded questions regarding consumption of ethanol (alcohol), physical activity, and smoking.
The basic objective of the dietary regimen to control hyperuricemia was to reduce the usual intake of food
sour-ces of purine, oxalic acid, and fat, as well as to encourage an increase in the ingestion of liquids. Nutritional orientation was aimed at promoting a gradual alteration in dietary ha-bits, and was, therefore, customized according to the dieta-ry and socioeconomic histodieta-ry of the patients.
The recommended diet was moderate in protein (0.8g/ kg/day), high in carbohydrates, low in fat (up to 30% of the total caloric value), and it restricted the consumption of food with a high purine content (100 to 1000mg of purine by 100g of food) such as consommé, meat extract, viscera, fish (su-ch as herring, mackerel, and sardines), mussels, an(su-chovies, alcoholic beverages, yeast, food in which yeast and eggs were used, and partridge 8.
If the hyperuricemic patient already followed a diet wi-th wi-the previously mentioned characteristics, a decrease in the consumption of foods with moderate purine content (9 to 100mg of purine per 100g of food) such as meats of all ty-pes, seafood, and vegetables was recommended, as well as a decrease in the consumption of food high in oxalates, such as dark green vegetables, cauliflower, beet/chard, beetroot, eggplant, okra, sweet potatoes, chestnuts, coconuts, wheat germ, tomatoes, asparagus, mushrooms, strawberries,
whole wheat cereals, quince marmalade, and chocolate 8.
Reduction of fat in the diet followed the recommendation of the National Cholesterol Education Program Phase I diet (NIH, 1993) 9. The recommended ingestion of liquids was 2.5 to 3.5 liters/day 8.
Patients in G2 and G3 received an initial prescription of 150mg/day of allopurinol, taken in a daily dose during lun-ch, and when the levels of uric acid remained high in week + 6, the dosage was increased to 300mg/day.
Height and weight were measured according to the tech-nique recommended by Gordon et al 10, and body mass index was calculated as weight in kilograms, divided by the squa-re of the height in meters. Individuals with body mass index of 25 to 29.99kg/m2 were considered overweight, and those
with body mass index of over 30kg/m2 were considered
obese 11.
Biochemical examinations (uric acid, total cholesterol, triglyceride, and glycemia at fasting) were made at the clini-cal analysis laboratory of the University Hospital/Federal University of Goias, with the patient on a 12-hour fast. Bio-chemical dosages were automatized, according to the enzy-matic method.
Blood pressure was measured in calm surroundings wi-th wi-the patient following, at least, a five-minute rest. Measure-ments were taken on the right arm, using a mercury-column sphygmomanometer according to the procedures recom-mended during the III Brazilian Congress of Hypertension, and the interpretation of the values obtained were also made in accordance with those established in the consensus 12.
The variables studied were expressed in terms of avera-ge ± standard deviation. The statistical analysis of variance
was carried out using the General Linear Models (GLM) 13
so that the outline would be totally randomized, with the treatments displayed in subdivided portions in time, in that, the portions were the groups, and the smaller portions were
G1 Week 0 Week +6. Week +12 + 36 Week. Selection G2 M1 M2 M3 M4
G3 6 week 6 week 24 week MC NA NA NA MA NC NutA NutA NutA NutA
* * * * ** ** end of G1 - group 1(diet) intervention G2 - group 2 (diet+ allopurinol)
G3 - group 3 (allopurinol)
M 1, M 2, M 3 e M 4 – moments of study
MA- medical appointment; NA- nurse appointment; NutA- nutritional appointment
* times of anthropometric biochemical, food consumption, and arterial blood pressure evaluation;
** groups 2 and 3 received allopurinol pills (150 to 300 mg/day).
further reduction in uric acid in relation to the levels obser-ved in week 12 (M3), maintaining significantly lower con-centrations than those observed at the beginning of study M1 (p<0.001).
No significant alterations were observed during the study regarding body mass index and the other biochemical variables (Table III).
Patients had hyperuricemia associated with other risk factors for cardiovascular diseases. Besides hypertension, 60% had dyslipidemia, and 36.4% were obese. Although patients with a previous diagnosis of diabetes were have excluded from the present analyses, 21.82% had glycemia greater than 110mg/dL.
With regards to food consumption, it was observed, through the 24-hour record sheet and the semiquantitative frequency questionnaire of food applied during nutritional evaluation, that the patients from groups 1 and 2 reduced their usual ingestion of food with high purine content (es-pecially consumption of viscera, red meat, and sardines), and oxalic acid (chocolate, pineapple, black tea, tomatoes, and dark green vegetables). Caloric intake remained unchan-ged during the study, as well as the ingestion of fat, which was near the 30% recommended during the experiment. Protein consumption had a tendency to decrease in groups 1 and 2; this decrease was significant in G1 (Table IV).
Discussion
Hyperuricemia may result from increased production of uric acid, or decreased renal excretion. The excretion of uric acid in healthy individuals is approximately 7%, indica-ting that only a small quantity escapes from tubular reabsor-ption. In the study of Galvan et al. 14,this rate declined by the periods. The differences found were considered
signifi-cant at a level of 5%. The analyses were carried out in groups as a whole, and the eventual differences between them were corrected with relation to the variables.
Results
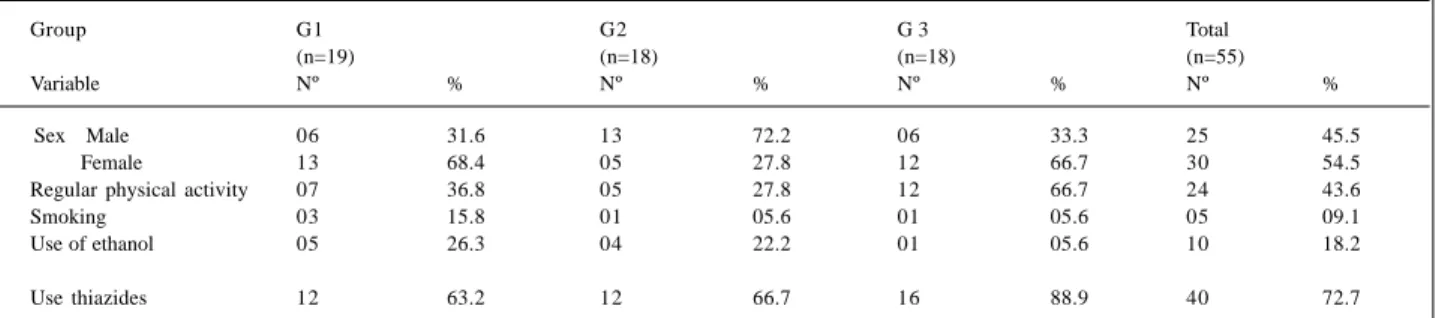
We selected 60 patients; 55 completed the study, 31 (56.3%) women and 24 (43.6%) men. G2 had a greater per-centage of men (n=13, 72.2%). The average age of the groups was 54.4±10.6 years (30-75years), 51.0±13.28 years, 54±8.70 years, and 59±6.41 years for G1, G2, and G3, respec-tively. Five patients were excluded from the beginning, four for missing the first scheduled appointment (G1) and one for not accepting the use of medication (G2).
Regarding lifestyles, the practice of physical activity was more prevalent in G3 (n=12, 66.7%); however, the inten-sity of practice was not evaluated; the consumption of etha-nol was lower in G3 (n=1.56%) and similar in G1 and G2. G1 was the group where smoking was more prevalent (n=3, 15.8%) (Table I).
Therapy with antihypertensive drugs was present in 100% of the cohort, and thiazide diuretics were the most used drugs (Table I). No significant difference was reported among the groups regarding the type and dosage of medi-cation used during the experiment.
Behavioral variables (physical activity and smoking) and the use of medication did not change during the 12 weeks of the study. However, the number of patients who consumed ethanol frequently decreased from five to three patients in G1, from four to one patient in G2, and to one in G3.
A significant decrease in systolic blood pressure oc-curred only in G1 (p=0.03) between M1 and M3, but diasto-lic blood pressure was similar among the groups (p=0.37) throughout the study.
Serum uric acid level was significantly reduced (p <0.001) in the three groups, without any statistical differen-ce between them (Table II). It is important to emphasize that as of the 6th week (M2) of intervention, this reduction was already significant. Six months after the end of the interven-tion period (M4), a tendency toward elevainterven-tion of uric acid in patients from groups 2 and 3 was observed; however, the concentration of uric acid was significantly lower (p<0.05) than the initial one. G1 patients showed a tendency toward
Table I – Distribution of patients at the beginning of the study per group, sex, physical activity, smoking, use of ethanol, and use of thiazides
Group G1 G2 G 3 Total
(n=19) (n=18) (n=18) (n=55)
Variable Nº % Nº % Nº % Nº %
Sex Male 06 31.6 13 72.2 06 33.3 25 45.5
Female 13 68.4 05 27.8 12 66.7 30 54.5
Regular physical activity 07 36.8 05 27.8 12 66.7 24 43.6
Smoking 03 15.8 01 05.6 01 05.6 05 09.1
Use of ethanol 05 26.3 04 22.2 01 05.6 10 18.2
Use thiazides 12 63.2 12 66.7 16 88.9 40 72.7
Table II - Evolution of uric acid (mg/dL) in the three groups during the study
Movement M1 M2 M3 M4
Group
G1 8.64±1.09 7.08±1.46* 7.40±1.27* 6.55±2.25* G2 9.36±0.89 6.85±1.44* 6.88±1.72* 8.13±2.21** G3 9.05±1.23 7.40±1.78* 6.66±1.73* 7.85±1.76**
approximately 26% in the presence of hyperinsulinemia and in the absence of alterations in the glomerular filtration rate (estimated by creatinine clearance), indicating that insulin inhibits secretion or increases reabsorption of uric acid in the tubular level 15.
The association of essential arterial hypertension and resistance to insulin is well known, as is the fact that hyper-tensive individuals develop hyperuricemia more often than normotensive individuals. Previous studies show that hy-perinsulinemia leads to increased renal sodium reabsorp-tion, and this increase is strongly associated with an in-crease in renal reabsorption of uric acid. Insulin resistance could therefore represent a connection between elevation of arterial pressure and hyperuricemia as well as the relation of this with other metabolic alterations in the state of insulin resistance, such as diabetes, obesity, and dyslipidemia 16-18. In the present study, the presence of associated risk factors for cardiovascular diseases occurred homoge-neously among the three groups. This condition has been frequently observed in several studies, as hyperuricemia is considered one of the variables involved in the insulin resis-tance syndrome 6,14,15.
This finding is of great value. Because no agreement has been reached regarding the fact that uric acid is an inde-pendent risk factor for cardiovascular disease, evidence exists that shows its association with plurimetabolic syn-drome 3-6.
Obesity is another factor that can explain some varia-tion in uricemia as it raises the uric acid levels regardless of insulin levels and fat distribution. Weight reduction in our
study would be desirable because it improves insulin sensi-tivity, reduces arterial pressure, and the concentration of uric acid; however, it was not achieved. We should highlight, however, that obese patients with hyperuricemia should lose weight gradually to avoid an acute gout crisis due to in-tense ketonemia 6,8,19.
Apart from controlling the intake of foods rich in puri-ne, decreasing the consumption of alcoholic beverages should be part of antihyperuricemic therapy, because al-cohol consumption is significantly related to the increase in serum uric acid levels. A possible reason for this association is competition between the metabolites of alcohol and uric acid for renal excretion. Alcohol induces an increase in uric acid production by the activation of adenine nucleotide
tur-nover, and, as it is associated with an increase in abdominal
adiposity, contributes to hyperinsulinemia 6.
Although patients have been randomly distributed, G2 had a greater number of men than the other groups, pro-bably due to the size of the sample. This fact may explain why basal uric acid concentration was greater in G2, which concurs with a study that reported that mean uric acid was 0.5mg/dL higher in men than in women 15.
We verified, also, that the final results in G3 were simi-lar to those in the remaining groups, in spite of lower alco-hol consumption and greater physical activity (which would lead to a better response to treatment).
Metabolic alterations (resistance to insulin, hyperuri-cemia, and dyslipidemia) brought on by the use of thiazides occurred only in some patients and were very mild. Diuretics may increase the serum uric acid level, but seldom induce Table III – Effect of treatment on the physiological parameters at the beginning (M1) and after 12 weeks of intervention (M3)
Variable SBP DBP BMI CH T G1
Group (mmHg) (mmHg) (kg/m2) (mg/dL) (mg/dL) (mg/Dl)
G1 (N=19)
M1 150± 22.6 102± 17.3 28.7± 4.2 224± 50.6 224± 80.5 104± 18.8
M3 133± 21.7 * 92± 12.0 28.7± 3.9 234± 42.4 229± 70.6 106± 12.9
G2 (N=18)
M1 140± 21.3 95± 11.1 28.4± 3.1 226± 58.5 283± 111.2 99± 18.4
M3 140± 20.0 95± 13.1 28.0± 3.0 249± 35.4 327± 134.0 100± 14.8
G3 (N=18)
M1 92± 14.8 141± 23.6 28.5± 4.7 230± 58.1 229± 169.1 105± 20.0
M3 93± 10.6 140± 19.1 28.2± 4.7 236± 52.9 208± 95.2 98± 14.9
*p<0.05 in relation to M1; SBP- systolic blood pressure; DBP- diastolic blood pressure; BMI- body mass index; CH- cholesterol; T- triglyceride; G- glycemia.
Table IV – Average nutritional consumption of groups 1, 2, and 3 estimated through a dietary report at the beginning (M1), and after 12 weeks of intervention (M3)
Patients Group 1 (G1) Group 2 (G2) Group 3 (G3)
M1 M3 M1 M3 M1 M3
Energy (Kcal) 1782 ± 650 1670 ± 635 1854 ± 668 1820 ± 647 1760± 628 1659 ± 487 Carbohydrates (%) 53.0 ± 9.5 56.5 ± 8.3 52.0 ± 8.8 56.8 ± 8.8 54.9 ± 8.4 54.4 ± 7.8 Protein (%) 17.1 ± 3.4 13.1 ± 3.0* 16.6 ± 3.2 14.0 ± 3.6 17.2 ± 4.3 16.4 ± 3.7 Fat (%) 29.9 ± 7.3 30.4 ± 6.9 31.4 ± 8.0 29.2 ± 8.2 27.9 ± 6.6 29.2 ± 5.9
acute gout, in that, their use is not indicated just for those who have a clinical picture of gout, because diuretics have many advantages in the treatment of hypertensive patients (efficacy, price, safety) 12,20.
In this study, the use of thiazides, which were taken by 60%-80% of patients in the three groups, did not interfe-re with the evolution of serum acid levels, probably due to the low dosages prescribed.
The association of hyperuricemia with other risk factors (obesity, dyslipidemia, arterial hypertension, hy-perinsulinemia, and diabetes) raises the need for a global treatment envisaging not only the reduction of uricemia, but also the control of other associated factors.
That is the major difficulty for successful treatment be-cause to control metabolic alterations several dietary res-trictions are necessary. This demands an individualized diet, and gradual changes, respecting preferences and so-cioeconomic conditions of the patients. To achieve this goal, both health education measures and a multidisciplina-ry team are of utmost importance.
Our results clearly show that nutritional care, that is, a reduction in the intake of food sources of purines, fat, and uric acid, and an increase in the intake of liquids have been just as efficient in decreasing serum uric acid levels
as the use of allopurinol either isolated or associated with this diet.
It is important to emphasize that six months after the end of the intervention period (Table II), patients who received only dietary orientation (G1) were the ones who tended to have better results, and a further reduction in uric acid was observed only in this group at that time (although the difference did not reach statistical significance).
These findings reinforce the fact that when we intro-duce the initial pharmacological treatment in a way we take away a part of the patients’ responsibility to change their lifestyles.
We can see in the last analysis that the results were si-milar with the three therapeutical strategies and we can, therefore, recommend any one of the alternatives as the initial approach to a patient with hyperuricemia.
When we use the cost x benefit relationship, taking into account the cost of medication and the importance of delegating a greater responsibility to the patient for changes in his or her lifestyle to reach the expected results, we em-phasize the fact that the treatments that are not pharmaco-logical should be the initial option in the treatment of hy-peruricemia, making use of careful measures of health edu-cation so that a more healthy lifestyle is adopted.
1. Bollet AJ. Nutrition and diet in rheumatic disease. In: Shils ME, Olson JA, Shike M. Modern Nutrition in Heath and Disease, 8th ed. United States of America: Lea
& Febiger, 1994: 1362-73.
2. Cossermelli W. Artropatias metabólicas. In Cossermelli W. Reumatologia Básica. Ed. Sarvier: São Paulo, 1972: 241-71.
3. Culleton BF, Larson MG, Kannel WB, Levy D. Serum uric acid and risk for car-diovascular disease and death: The Framingham Heart Study. An Intern Med 1999; 131: 7-13.
4. Freddman DS, Williamson DF, Gunter EW, Byers T. Relation of serum uric to mor-tality and ischemic heart disease: The NHANES I Epidemiologic follow-up study. Am J of Epidemiol 1995; 141: 637-44.
5. Persky VW, Dyer AR, Soveni I, et al. Uric acid: a risk factor for coronary heart di-sease? Circulation, 1979; 59: 969-77.
6. Lee J, Sparrow D, Vokonas PS, Landsberg L, Weiss ST. Uric acid and coronary heart disease risk: evidence for a role of uric acid in the obesity-insulin resistance syndrome. Am J Epidemiol 1995; 3: 288-94.
7. Wilcox WD. Abnormal serum uric acid levels in children. J Pediatrics 1996; 128: 731-41.
8. Mahan LK, Arlin MT. Alimentos, Nutrição e Dietoterapia. 8ª ed. Cuidado Nutri-cional na Doença Artrítica. São Paulo: Roca, 1995; Cap. 40: 735-43. 9. National Institutes of Health. National Cholesterol Education Program:
defec-tion, evaluation na treatment of high blood cholesterol in adults - second report. Dallas: : 1993: 72p.
10. Gordon CC, Chumlea WC, Roche AF. Stature, recumbent length and weight. In: Lohman TG, Roche AF, Martolrell R. Anthropometric Standardization Reference Manual. Illinois: Human Kinetics Books, 1988: 3-8.
11. Garrow JS. Obesity and related diseases. Health Implications of Obesity.
Edin-References
burg London Mebourne and New York: Churchill Livingstone, 1988: Cap. 1: 329 e Cap. 1: 1-19.
12. Sociedade Brasileira de Hipertensão, Sociedade Brasileira Cardiologia, Socie-dade Brasileira de Nefrologia. III Consenso Brasileiro de Hipertensão Arterial. Campos do Jordão, 1998: 38p.
13. SAS – Statical Analysis System. Institute Inc SAS Version. 6.12. Cary NC, 1996. (Computer program)
14. Saggiani F, Pilati S, Targher G, Branzi P, Muggeo M, Bonora E. Serum acid uric and related factors in 500 hospitalized subjects. Metabolism. 1996; 45: 1557-61. 15. Galvan AQ, Natali A, Baldi S, et al. Effect of insulin on uric acid excretion in
hu-mans. Am J Physiol 1995; 31: E1-E5.
16. Haffner SM, Fong D, Hazuda HP, Puch JA, Patterson. Hyperinsulinemia, upper body adiposity, and cardiovascular risk factors in non-diabetics. Metabolism. 1988; 37: 338-45.
17. Hauner H, Bognar E, Blum A. Body fat distribution and its association with me-tabolic and hormonal risk factors in women with angiographically assessed co-ronary artery disease: evidence for the presence of a metabolic syndrome. Athe-rosclerosis 1994; 105: 209-16.
18. Björntorp P. “Portal” adipose tissue as a generator of risks factors for cardiovas-cular disease and diabetes. Arteriosclerosis 1990; 10: 493-6.
19. Lichtman SW, Pisark A, Berman ER, et al. Descrepancy between sef-reported and actual caloric intake and exercise in obese subjects. N Engl J Med 1992; 327: 1893-8.