Página | 450
https://periodicos.utfpr.edu.br/rbpd
Technical feasibility analysis of the use of
solar chimneys in brazil
ABSTRACT
Christian Scapulatempo Strobel
Universidade Federal do Paraná. Curitiba. Paraná. Brasil.
Luís Mauro Moura
Universidade Federal do Paraná. Curitiba. Paraná. Brasil.
Márcio Fontana Catapan
Universidade Federal do Paraná. Curitiba. Paraná. Brasil.
Solar chimneys are power generation plants, which use solar radiation to promote a flow of heated air, whose kinetic energy is extracted by turbines located at the base of the chimney. The literature regarding this technology is extensive and many studies have been conducted to verify numerical and mathematical models, as well as analyzes of technical and economic viability. However, none of those studies has considered the potential of the application of this technology in Brazil, and this analysis is a decisive factor for the implementation of this kind of energy model as a successful enterprise. Considering that, this work aims to map the energy potential for the use of solar chimneys in Brazil, using a mathematical and numerical model of extreme precision. The results indicate a great potential for the use of this technology in the country, especially in the Northeast, Midwest, and in a state of the Southern region. Considering the annual average solar radiation levels, the city of Cuiabá-MT is the one which has the highest power generation potential, with a daily average of 50 MWh and a peak generation of 5.10 MW, followed by the city of Propriá-CE, generating 49.53 MWh and a peak generation of 5.01 MW. The results were promising and, although the overall efficiency of this technology is not very high, around 1.3%, these plants present low operating costs, long service life, and use materials with low emissions rates of CO2 in their manufacturing process.
KEY WORDS: Solar chimney; Solar Energy; Renewable Energy; Business Technical feasibility.
Página | 451
1 INTRODUCTION
Solar chimneys are power generation plants that use solar energy to heat a mass of air contained in the bottom of a vitreous collector. They also have a chimney installed at their center in order to promote an airflow. This happens by connecting this mass of heated air with great pressure to the exit of the chimney, which is a region of lower pressure. The heated air at the base of the chimney has a lower specific mass, and thus thrust forces promote a flow of this mass of air to the outlet of the chimney. This process produces a continuous airflow, and the created kinetic energy is transformed into mechanical energy by a turbine at the base of the chimney. This energy is then converted into electrical energy through a generator. Figure 1 shows the working principle of a Solar Chimney.
Figure 1: Solar Chimney working principle
The soil beneath the collector is a convenient means for storing some of the solar energy during the day, allowing an airflow to be maintained even at night, when this energy previously stored by the soil can be released to the air.
The speed of the airflow created by the thrust forces is proportional to the increase of temperature promoted by the collector and by the height of the chimney. The power generated by the turbines is proportional to the volumetric airflow rate and the pressure drop in the turbine.
In 1981, an experimental prototype was built in Manzanares, Spain, with the sponsorship of the German government. This pilot plant had a capacity of 50 kW and a nominal height of 200m, with a collector measuring 244m in diameter. Haaf et al. (1983) presented the details of the operation, energy balance and a cost analysis of the plant. Once implemented, the plant was instrumented and operational data were obtained. Haaf et al. (1984) presented the preliminary
Página | 452
results of the operation of the Manzanares plant. This plant was in operation until 1989, and demonstrated the reliability and technical feasibility of this concept of renewable energy generation.
Due to the optimistic scenario related to this type of energy generation system, and after the experiments conducted in Manzanares, an extensive literature began to emerge. Studies with different targets were conducted to determine the influence of several parameters on energy generation and efficiency, such as geometry of the plant, turbine arrangement, material quality of the collector cover, soil roughness and its thermophysical properties, development and validation of mathematical and numerical models. Besides that, technical and economic viability analysis were executed in order to evaluate the implementation of this type of technology in several regions of the world.
According to Corsini et al. (2018), transition towards a fossil fuel free future is not to be understood as a matter of techno-economic innovation but as a process in which the ‘social’ and the ‘technical’ are inextricably intertwined, and technologies co-evolve with programmes of governing. In this case, future energy plans for transition towards a fossil future free future are very important, and demands a more participatory idea of smart cities that emerge from real-world practices.
Among the main studies involving mathematical and numerical modeling, those conducted by Bernardes et al. (2003) stood out, since the model proposed by the authors is based on the application of discrete Euler equations for the collector, using the Boussinesq approximation to predict the velocity in the chimney as a function of the temperature increase in the collector. The model of Bernardes et al. (2003) predicts an error of only -1.6% in power generation when compared to the prototype of Manzanares.
Koonsrisuk et al. (2010) proposed a model based on the sum of the loss of charge throughout the system and the addition of temperature promoted by solar radiation to predict the power generated. Due to great simplifications in the model, there was a difference of 194.8% in relation to Manzanares, according to a study by Strobel et al. (2018).
Strobel et al. (2018) analyzed four models, including the model of Bernardes et al. (2003) and the model of Koonsrisuk et al. (2010). After the analysis, they proposed changes in both models. The adjustment proposed in the model of Bernardes et al. (2003) was the addition of the multiple reflections effect that the radiation undergoes on the cover material. They also added the multiple reflections between the cover and the ground. With this, the error in relation to Manzanares was 1.3%; that is, 2.9% more potency than predicted by Bernardes et al. (2003). As for the modified model of Koonsrisuk et al. (2010), besides the multiple reflections present in the glass cover and between the collector and the soil, the authors included the thermal network proposed by Bernardes et al. (2003) to predict the temperature rise in the collector, including thermal storage in the soil, which was not considered in the original model. In addition to these modifications, other smaller load losses were included in the model in order to make it more precise than the original. Some of those adjustments were the load loss in the collector/chimney transition, internal reinforcements of the chimney and the collector, chimney output and non-adiabatic atmosphere, translating into the model a change in the turbine pressure-drop rate from 0.8 to 0.97. Thus, the
Página | 453
modified model of Koonsrisuk et al. (2010) reached a smaller error percentage than the original one, around 37.5% in relation to the prototype of Manzanares.
The model of Bernardes et al. (2003), modified by Strobel et. al (2018), presents a more complete model, considering solar radiations and their interference in the semitransparent portion of the cover. Because of these improvements and the fact that this model has reached higher accuracy results, it was used as a reference in this study.
Several studies have been carried out regarding the technical and economic feasibility of the implantation of electric power plants, using the concept of solar chimneys, in many regions of the world. However, none of them has been focused on Brazil and its regions. An analysis of this magnitude requires a study of the electrical potential of each region based on climatic conditions, such as temperature history, relative humidity, open sky conditions, direct and diffuse radiation over the months, and some other factors.
Therefore, the objective of this work is to evaluate the energy potential of a solar chimney in Brazil, mapping the energy generated in the whole territory, for a given geometry. The solar radiation data were obtained through the Brazilian Solarimetric Atlas - GPFAE (2003).
2 MATHEMATICAL MODEL
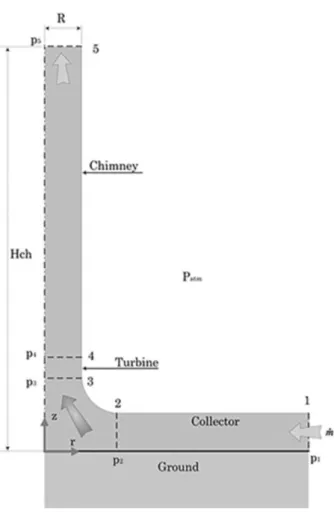
The proposed model considers a semi-permanent regime with prescribed speed conditions, where the working fluid is air. The velocity field is a function of the thrust forces caused by the air temperature increase in the collector. However, this analysis must be carried out with caution, since there is strong influence of the collector and the soil in the transient conduction in the soil. Figure 2 shows a diagram of the airflow inside the Solar Chimney.
To investigate the air behavior inside the collector and the chimney, some hypotheses must be considered, including:
- The collector is treated as a flat surface;
- The height of the collector relative to the ground is constant; - The collector has only one layer of glass;
- The airflow is axisymmetric; that is, uneven heat at the collector surface relative to the chimney can be neglected;
- The temperature gradient between the soil and the collector is negligible. The chimney converts the collector heat flow into kinetic and potential energy. It acts as a connector element between the base of the chimney, which presents a lower density due to the addition of temperature, and the output of the chimney, which presents a higher density. The lighter the air column inside the chimney, the greater the thrust force. This generates a pressure difference between the collector outlet and the environment.
Página | 454
Figure 2: Airflow inside the Solar Chimney
The movement of the fluid occurs only by differences in density as a result of the difference between the temperatures. The equation that represents the conservation of the intensity of movement applied to the chimney can be represented as the following:
𝜌𝑑𝑤⃗⃗
𝑑𝑡 = −∇𝑝 + ∇𝜏 + 𝜌𝑔
It is appropriate, instead of the mass force ρ.g, to introduce the force of thrust, (ρ-ρ_atm).g. This is obtained by decomposing the pressure term into a static pressure component and another dynamic pressure component:
𝑝 = 𝑝𝑒𝑠𝑡+ 𝑝𝑑𝑖𝑛
For a motionless fluid, the term of the static pressure appears as the following: 𝑑𝑝𝑒𝑠𝑡
𝑑𝑧 = 𝜌𝑎𝑡𝑚. 𝑔
Since the process is not isothermal, ρ_atm varies with the temperature field, which varies with the z coordinate of height. Thus, one has:
𝜌 (𝑤𝜕𝑤 𝜕𝑧) =
𝜕𝑝
Página | 455
To determine an expression for the velocity of the fluid, considering the equation of conservation of momentum quoted above, it is necessary to use Euler’s equation for the Cartesian component z:
𝜌 (𝑤𝜕𝑤 𝜕𝑧) =
𝜕𝑝
𝜕𝑧− (𝜌 − 𝜌𝑎𝑡𝑚). 𝑔
Integrating the new expression with the previous equation, one may have: 𝜌. 𝑤2 2 = ∫ (𝜌 − 𝜌𝑎𝑡𝑚) 𝐻𝑐ℎ 0 . 𝑔. 𝑑𝑧 − ∆𝑝𝑡𝑜𝑡𝑎𝑙 Or 𝑤 = √2 𝜌. (∫ (𝜌 − 𝜌𝑎𝑡𝑚) 𝐻𝑐ℎ 0 . 𝑔. 𝑑𝑧 − ∆𝑝𝑡𝑜𝑡𝑎𝑙)
Where ∆p_total already considers the overall loss of load in the system. The tower (chimney) converts the heated airflow produced by the collector into kinetic energy (convection current) and potential energy (pressure drop in the turbine). Thus, the difference in density caused by the increase in temperature in the collector acts as the driving force. The less dense column of air in the tower is connected to the neighbor atmosphere at the base (inside the collector) and at the top of the tower, thereby gaining thrust. A pressure difference is produced between the base of the chimney (outlet of the collector) and the environment, and can be represented as follows:
𝜌. 𝑤2
2 = ∆𝑝𝑡𝑜𝑡𝑎𝑙− ∆𝑝𝑡𝑢𝑟𝑏
Knowing that the pressure drop in the turbine is a function of the total pressure drop multiplied by a fall factor in the turbine, we have:
∆𝑝𝑡𝑢𝑟𝑏 = 𝑥. ∆𝑝𝑡𝑜𝑡𝑎𝑙
It results in:
𝑥. ∆𝑝𝑡𝑜𝑡𝑎𝑙 = ∆𝑝𝑡𝑜𝑡𝑎𝑙−
𝜌. 𝑤2 2 And solving for speed,
𝜌. 𝑤2 2 = (1 − 𝑥). ∆𝑝𝑡𝑜𝑡𝑎𝑙 𝜌. 𝑤2 2 = (1 − 𝑥). 𝜌. 𝑤𝑓𝑟𝑒𝑒2 2 𝑤 = 𝑤𝑓𝑟𝑒𝑒√(1 − 𝑥)
The velocity wfree is the maximum speed that would be obtained without the presence of the turbine. It is calculated as if there were no frictional losses. To calculate this problem, we use Euler’s equation; however, using the Boussinesq approximation method.
Página | 456
The thrust term, due to the density difference, is obtained considering the Boussinesq approximation method, which is a linearization of density dependence as a function of the temperature. The Boussinesq approximation method is widely used in numerical and mathematical modeling of natural convection problems. According to Gray and Giorgini (1976), this method is physically consistent and it facilitates the solution of the problem. It considers the fluid incompressible throughout the system, except in the thrust term of the z-direction motion equation. To determine a mathematical expression for this component, a density ρ_∞ is considered at a corresponding temperature T_∞. After the proper algebraic considerations, using the law of ideal gases, we have:
𝜌 = 𝜌∞[1 − 𝛽(𝑇 − 𝑇∞)]
Based on this equation, other important parameters can be proposed, such as maximum speed, maximum power output, heat collected by the air, plant efficiency and pressure drop in the system.
Based on Euler’s equation and using the hypotheses already stablished, one may have: ∫ 𝑤𝑑𝑤 𝑤𝑓𝑟𝑒𝑒 0 =𝑔. (𝜌∞− 𝜌) 𝜌 ∫ 𝜕𝑧 𝐻𝑡 0
Integrating from 0 to Ht, we have:
∫ 𝑤𝑑𝑤 𝑤𝑓𝑟𝑒𝑒 0 =𝑔. (𝜌∞− 𝜌) 𝜌 ∫ 𝜕𝑧 𝐻𝑡 0 𝑤𝑓𝑟𝑒𝑒= √ 2𝑔. (𝜌∞− 𝜌). 𝐻𝑡 𝜌 So, 𝑤𝑓𝑟𝑒𝑒= √2. 𝑔. 𝛽. 𝐻𝑡. (𝑇 − 𝑇∞)
In this way, the actual maximum speed in the plant considering the turbine load loss is expressed by:
𝑤 = √2. 𝑔. 𝐻𝑡. (𝑇 − 𝑇∞). (1 − 𝑥) 𝑇∞
2.1 Temperature rise in collector
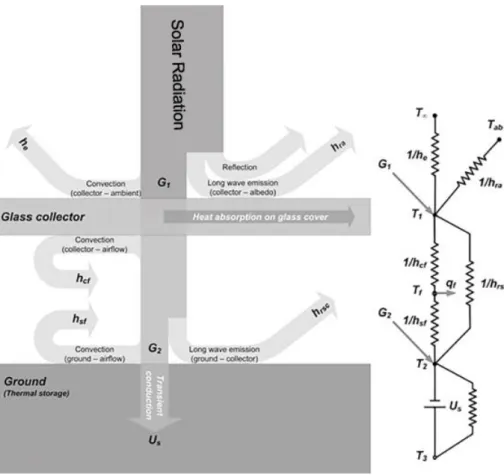
In order to determine the temperature increase in the collector, it is necessary to balance the energy in a specific section of the same. The energy behavior in the collector can be seen in Figure 3.
Página | 457
Figure 3: Energy behavior inside the Solar Chimney
For each intermediate node, an energy balance was performed for a permanent regime, ending with the following equations:
𝑇1: 𝐺1+ ℎ𝑟𝑠𝑐(𝑇2− 𝑇1) + ℎ𝑐𝑓(𝑇𝑓− 𝑇1) = ℎ𝑒(𝑇1− 𝑇∞) + ℎ𝑟𝑎(𝑇1− 𝑇𝑎𝑏)
𝑇𝑓: ℎ𝑐𝑓(𝑇1− 𝑇𝑓) = ℎ𝑠𝑓(𝑇𝑓− 𝑇2) + 𝑞"𝑓
𝑇2: 𝐺2= ℎ𝑠𝑓(𝑇2− 𝑇𝑓) + ℎ𝑟𝑠𝑐(𝑇2− 𝑇1) + 𝑈𝑠(𝑇2− 𝑇3)
Where
𝑇
3= 𝑇
2,0; that is, the surface temperature in the previous time step. To be called:𝑈𝑒= ℎ𝑒+ ℎ𝑟𝑎
And, rearranging the terms as a function of the temperatures, we end at a matrix 3 x 3: [ (𝑈𝑒+ ℎ𝑐𝑓+ ℎ𝑟𝑠𝑐) (−ℎ𝑐𝑓) (−ℎ𝑟𝑠𝑐) (ℎ𝑐𝑓) −(ℎ𝑐𝑓+ ℎ𝑠𝑓+ 𝜓) (ℎ𝑠𝑓) (−ℎ𝑟𝑠𝑐) (−ℎ𝑠𝑓) (ℎ𝑠𝑓+ ℎ𝑟𝑠𝑐+ 𝑈𝑠) ] . [ 𝑇1 𝑇𝑓 𝑇2 ] = [ (𝐺1+ ℎ𝑒. 𝑇∞+ ℎ𝑟𝑎. 𝑇𝑎𝑏) −𝜓. 𝑇𝑓,𝑒 (𝐺2+ 𝑈𝑠. 𝑇2,0) ]
Página | 458
[𝐴]. [𝑇] = [𝐵]
Where the temperature vector can be determined by matrix inversion: [𝑇] = [𝐴]−1. [𝐵]
All the heat transfer coefficients mentioned in the thermal network of the collector depend on the temperature and the properties of the air and the environment. All these convection coefficients are described in the work conducted by Bernardes et al. (2003) and can be easily found in the literature.
2.2 Optical collector properties
According to Siegel and Howell (2002), the radiation in translucid materials, such as glass, are subject to multiple reflections. Using the series theory, we have, considering only the glass coverage:
𝑅𝑣 = 𝜌𝑣. [1 + (1 − 𝜌𝑣)2. 𝜏𝑣2 1 − 𝜌𝑣2. 𝜏𝑣2 ] 𝑇𝑣 = 𝜏𝑣. (1 − 𝜌𝑣)2 1 − 𝜌𝑣2. 𝜏𝑣2 𝐴𝑣= (1 − 𝜌𝑣. 𝜏𝑣). [ (1 − 𝜏𝑣). (1 − 𝜌𝑣) (1 − 𝜌𝑣2. 𝜏 𝑣2) ]
However, the soil also reflects radiation. Besides that, multiple reflections between the soil and the glass cover also occurs. According to Strobel et al. (2016), considering multiple reflections of solar radiation in the glass cover and between the glass cover and the soil, using the series theory, we have the following fraction of reflected radiation from the collector:
𝑅𝑠𝑦𝑠 = 𝑅𝑣+ [ 𝜌𝑠𝑇𝑣2 1 − 𝜌𝑠𝑅𝑣 ] =𝑅𝑣(1 − 𝜌𝑠𝑅𝑣) + 𝜌𝑠𝑇𝑣 2 1 − 𝜌𝑠𝑅𝑣
The portion absorbed by the vitreous system: 𝐴𝑠𝑦𝑠= 𝐴𝑣+ [
𝜌𝑠𝑇𝑣𝐴𝑣
1 − 𝜌𝑠𝑅𝑣
] =𝐴𝑣(1 − 𝜌𝑠𝑅𝑣) + 𝜌𝑠𝑇𝑣𝐴𝑣 1 − 𝜌𝑠𝑅𝑣
And, finally, the fraction transmitted to the interior: 𝑇𝑠𝑦𝑠 =
𝑇𝑣(1 − 𝜌𝑠)
1 − 𝜌𝑠𝑅𝑣
Thus, the radiation incident on the collector and the soil are represented respectively as:
𝐺
1= 𝐺
𝐺
2= 𝐺 𝑇
𝑠𝑦𝑠Página | 459
According to Strobel et al. (2016), the error induced by not using the appropriate methodology can range from 58% for high reflectance soils, and may reach up to 85% depending on glass quality and soil reflectance. Evidently, the difference in power generated does not follow this order of magnitude, since the power generated depends on several other factors besides the transmissibility of the glass.
It is known that the power produced by a flow machine, according to Bird (2007), is given by the product of the volumetric flow, pressure drop in the turbine and its efficiency, resulting in:
𝑊̇ = 𝜌𝐴√2 (𝑔𝐻𝑐ℎ(𝑇 − 𝑇∞) 𝑇∞ ) 3 𝜂 𝑥 √1 − 𝑥 3 METHODOLOGY
The numerical model consists in, primarily, separating the collector into several circular sections. In this study, 2,000 sections were proposed. After this, a velocity is set up as an estimative in the chimney, and, by the conservation of the mass, it is possible to find the velocity that enters the first section, further away from the chimney. At first estimate, all nodes are at room temperature.
For this first time, all convection coefficients are calculated, and the temperature matrix is solved. After convergence, the input temperature in the new section is updated as the output temperature of the analyzed section. After that, the same is applied to the next session. The process is repeated until the last section was analyzed. By computing the temperature at the base of the chimney, the velocity is recalculated in the whole chimney and the velocity is updated at the periphery of the collector. Then the process is repeated until the velocity convergence. Once the convergence is reached, the power generated at that time step is computed, and the time step is advanced in 10 minutes. The whole process is then repeated for 3 days, to avoid the influence of the arbitrariness imposed at the beginning of the iterative procedure.
3.1 Results and discussion
Before starting the simulations for the Brazilian territory, it was necessary to stipulate the dimensions of the proposed plant, as well as the data on the material of the cover and the soil.
The height of the plant is set as 500 meters. Many authors in the literature carry out simulations involving very high towers, in the order of 1000 ~ 1500 meters. However, companies that are doing business in this field are reducing the height of their chimneys to around 250 ~ 500 meters, for reasons of construction technology. Very high chimneys can be considered as a risk from the point of view of engineering, since the construction becomes expensive and dangerous. Besides that, it could jeopardize the investment. The results shown on this study also consider a collector diameter (glass surface) of 1000 meters. A variable that will be kept constant is the diameter of the chimney, which dimensions were defined as
Página | 460
5% of the collector diameter, as presented in Manzanares and in several other studies in the literature.
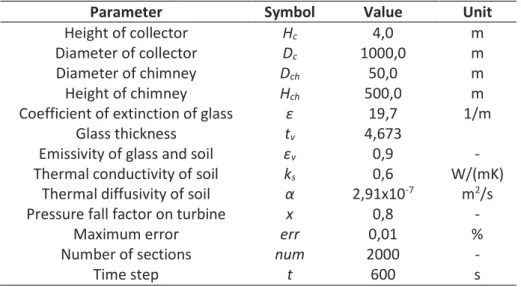
Regarding the quality of the vitreous material, it is important to consider that a vitreous material of classification NFRC ID 5003 with 4,673 mm of thickness and coefficient of extinction 19.7 was used. The complete parameter data used in the simulation are given in Table 1.
Tabela 1 – Parameter data used in simulation
Parameter Symbol Value Unit
Height of collector Hc 4,0 m
Diameter of collector Dc 1000,0 m
Diameter of chimney Dch 50,0 m
Height of chimney Hch 500,0 m
Coefficient of extinction of glass ε 19,7 1/m
Glass thickness tv 4,673
Emissivity of glass and soil εv 0,9 -
Thermal conductivity of soil ks 0,6 W/(mK) Thermal diffusivity of soil α 2,91x10⁻⁷ m2/s
Pressure fall factor on turbine x 0,8 -
Maximum error err 0,01 %
Number of sections num 2000 -
Time step t 600 s
The incidence of solar radiation is important not only to start any simulation, but also to define the best geographic location for the construction of a plant of this type. Thus, it is necessary to know the solar energy potential that affects the region of the study; in this case, Brazil and its borders. The GPFAE (2003) proposed the solarimetric atlas that was used in this research. This atlas shows isoline maps for each month of the year and a map of isolines with the annual average of the country. The values used for making these isoline maps were extracted from internal databases that are fed by numerous actinographic and pyranometric stations scattered throughout the country. These stations are equipped with actinographs and pyranometers that measure total, direct and diffuse solar radiation. This atlas presents a database that allowed the construction of tables for a more precise analysis of the incidence of radiation on the surface of the Brazilian territory.
Based on the proposed geometry, Figure 4 shows the obtained energy potential distribution of solar chimneys in winter throughout the Brazilian territory. The energy generated is expressed in MWh/day.
There is a greater energy potential in the Northeast region, more specifically in the state of Sergipe. The city of Propriá presents an average of 51.4 MW.h/day during winter, with a peak of generation of 5.21 MW. The Southern region has lower energy potential during this season, as well as the shaded regions of the Amazon region.
Página | 461
Figure 4: Energy potential in Brazil during winter
For the summer condition, the energy potential distribution of solar chimneys is obtained in the whole Brazilian territory is shown on Figure 5. The energy generated is expressed in MWh/day.
Página | 462
As in winter, there is great energy potential in the Northeast regions during summer. However, in the Southern region, more specifically in the Southwest of Rio Grande do Sul, there is a strong energy potential. The largest amount of energy generation during summer occurred in the city of Passo Fundo, in the state of Rio Grande do Sul, with a daily generation of 54.03 MWh and an energy peak of around 5.65 MW. Some shaded regions in the North remain with low energy potential during summer due to the Amazonian coverage.
To verify the feasibility of a project with these dimensions in any of these territories, it is necessary to know the daily amount of energy generated in average annually.
Based on the proposed geometry, the data shown in Figure 6 represents the energy potential distribution of solar chimneys - annual average - that was obtained throughout the Brazilian territory. The values acquired are shown in Table 2, for the main Brazilian regions. The energy generated is expressed in MWh/day.
Figure 6: Energy potential in Brazil – annual average
The image shows that there is a great energy potential in the North and Northeast regions. It also shows that the Southern region has a lower potential for energy generation, considering an annual average. Note that, because the scale is constant in all isoline graphs for this parameter, there is a black region on the map that has a daily energy generation of less than 35.5 MWh / day. Some shaded regions in the North remain with low energetic potential throughout the year due to the Amazonian coverage. The highest peak of power found by the annual average was concentrated in the Midwest region, more specifically in the city of
Página | 463
Cuiabá-MT, with 5.1 MW of energy peak and a daily average of 50.01 MWh of power generation.
Tab 2: Energy potential in Brazil – Annual Average
Region State City Annual Average
Solar radiation (MJ/m2) Power peak (MW) Daily energy generation (MWh) Plant efficiency North AP Macapá 18,18 4,45 45,42 1,15% AM Manaus 17,68 4,41 45,68 1,18% PA Belém 18,18 4,41 45,19 1,14% RO Porto Velho 16,90 4,47 47,22 1,28% RR Boa Vista 17,82 4,34 44,58 1,15% TO Palmas 19,23 4,63 47,16 1,12% AL Maceió 19,02 4,26 42,38 1,02% BH Salvador 19,20 4,35 43,31 1,03% CE Fortaleza 20,33 4,64 46,28 1,04% CE Quixadá 20,43 4,62 45,94 1,03% MA São Luiz 19,13 4,42 44,34 1,06% PB João Pessoa 19,78 4,44 43,80 1,01% PE Barreiros 19,68 4,32 42,38 0,99% PE Recife 17,62 4,15 42,08 1,09% PI Teresina 19,75 4,68 47,53 1,10% RN Natal 20,38 4,49 44,34 1,00% SE Aracajú 19,69 4,32 42,48 0,99% SE Propriá 22,60 5,01 49,53 1,00% Midwest DF Brasília 15,38 4,05 42,18 1,26% GO Goiás 17,36 4,27 43,66 1,15% GO Mineiros 17,49 4,08 40,83 1,07% MT Cuiabá 23,24 5,10 50,01 0,99% MS Campo Grande 17,76 4,23 42,89 1,11% ES Vitória 17,57 4,18 42,26 1,10% MG Belo Horizonte 17,88 4,39 44,94 1,15% RJ Rio de Janeiro 16,70 3,90 39,32 1,08% SP São Paulo 13,88 3,50 36,09 1,19% South PR Curitiba 15,09 3,62 36,59 1,11% RS Passo Fundo 18,10 3,87 37,27 0,94% RS Porto Alegre 15,43 3,43 33,80 1,00% SC Curitibanos 16,68 3,71 36,21 1,00% SC Florianópolis 15,25 3,60 36,09 1,08% 4 CONCLUSION
Technologies based on renewable energies, where the fuel used comes from natural resources such as air, solar radiation and others, have a great environmental appeal, because is still very considerable the pressure put on technologies that operate by fossil fuels due to the impacts related to global warming. However, renewable energy still has an unfavorable aspect, which is cost. It is known that building a 500m-high chimney is still a challenge for engineering. In addition, a collector of 1000 meters in diameter (785,000 m²) made of vitreous material is very expensive. However, this technology supports several years of operation at a very low operating cost. Besides that, there are reports of short-term projects that could benefit thousands of people with clean, renewable energy.
Despite having a low efficiency (~ 1.3% for H = 500 m), this technology has low operating costs, low CO2 emissions in the production of its components, compared to other clean energies, and has a long service life (> 60 years). Regarding the technical feasibility, the Brazilian territory is broad and with a great amplitude of solar radiation. The most promising states are the states located in the Northeast
Página | 464
and Midwest regions. However, the state of Rio Grande do Sul, in the Brazilian southern extreme, was also promising. The states in Northern region were not as efficient due to the Amazonian coverage. The states of the Southeast region and the other states of the Southern region, such as Paraná and Santa Catarina, were also less efficient due to the low index of solar radiation when compared to the others States already mentioned.
Página | 465
Análise de viabilidade técnica da
implantação de chaminés solares no Brasil
RESUMOAs chaminés solares são usinas de geração de potência, que usam radiação solar para promover um fluxo de ar aquecido, cuja energia cinética é extraída por turbinas localizadas na base da chaminé. A literatura sobre essa tecnologia é extensa e muitos estudos foram realizados para verificar modelos numéricos e matemáticos, além de análises de viabilidade técnica e econômica. No entanto, nenhum desses estudos considerou o potencial da aplicação dessa tecnologia no Brasil, e essa análise é um fator decisivo para a implementação desse tipo de modalidade energética como negócio de sucesso. Desta forma, este trabalho tem como objetivo mapear o potencial energético do uso de chaminés solares no Brasil, utilizando um modelo matemático e numérico de extrema precisão. Os resultados indicam um grande potencial para o uso dessa tecnologia no país, principalmente no Nordeste, Centro-Oeste e estado da região Sul. Considerando os níveis médios anuais de radiação solar, a cidade de Cuiabá-MT é a que apresenta maior potencial de geração de energia, com média diária de 50 MWh e pico de geração de 5,10 MW, seguida pela cidade de Propriá-CE, gerando 49,53 MWh e uma geração de pico de 5,01 MW. Os resultados foram promissores e, embora a eficiência geral dessa tecnologia não seja muito alta, em torno de 1,3%, essas plantas apresentam baixos custos operacionais, longa vida útil e utilizam materiais com baixas taxas de emissão de CO2 em seu processo de fabricação.
PALAVRAS-CHAVE:Chaminé solar, Energia solar, Energias Renováveis; Viabilidade Técnica de Negócios.
Página | 466
REFERENCES
BEJAN, A.;LORENTE, S.; KOONSRISUK, A. Constructal solar chimney configuration. International Journal of Heat and Mass Transfer, Volume 53, 327-333, 2010.
BERNARDES, M. A. S.; WEINREBE, G.; VOB, A. Thermal and technical analyses of solar chimneys. Solar Energy, Volume 75, 511-524, 2003.
BIRD RB, STEWART WE, LIGHTFOOT EN. Transport Phenomena. 2nd ed. Wiley, 2007.
CORSINI, F.; CERTOMÀ, C.; DYER, M.; FREY, M. Participatory Energy: Research, Imaginaries and Practices on People’s Contribute to Energy systems in the Smart City. Technological Forecasting & Social Change, Article in Press, 2018.
GRAY, D.D.; GIORGINI, A.; The Validity of Boussinesq Approximation for Liquids and Gases. International Journal of Heat Mass Transfer, vol. 19, pp 545-551, 1976.
GPFAE (Grupo de Pesquisa em Fontes Alternativas de Energia). Atlas
Solarimétrico do Brasil. Universidade Federal de Pernambuco. CD-ROM. ISBN 85-7315-188-9 (2003)
HAAF, W. Solar chimneys. Part 2: Preliminary test results from the Manzanares pilot plant. International Journal of Solar Energy, Volume 2, 141-161, 1984.
HAAF, W.; FRIEDERICH, K.; MAYR, G.; SCHLAICH, J. Solar chimneys. Part 1: Principle and construction of the pilot plant in Manzanares. International Journal of Solar Energy, Volume 2, 3-20, 1983.
Siegel R, Howell JR. Thermal Radiation Heat Transfer. volume 1, 2002. doi:10.1002/apj.5500020220.
Strobel C, Moura LM, Mariani VC. Radiative heat transfer considering the
effect of multiple reflections in greenhouse structures. Journal of the Brazilian
Society of Mechanical Sciences and Engineering, Volume 38, 2016. doi:10.1007/s40430-015-0466-6
Página | 467
Strobel C, Moura LM, Mariani VC. Mathematical Methods for Solar Chimney Analysis. Journal of Technology Innovations in Renewable Energy, v.7, p.19 - 26, 2018. doi:10.6000/1929-6002.2018.07.03
Recebido: 16 jun. 2020.
Aprovado: 24 jun. 2020.
DOI: 10.3895/rbpd.v9n3.12636
Como citar: STROBEL, C. S.; MOURA, L. M.; CATAPAN, M. F. Technical feasibility analysis of the use of solar chimneys in brazil. R. bras. Planej. Desenv. Curitiba, v. 9, n. 3, p. 450-467, set./dez. 2020. Disponível em: <https://periodicos.utfpr.edu.br/rbpd>. Acesso em: XXX.
Correspondência:
Christian S. Strobel
Av. Cel. Francisco H. dos Santos, 100 - Jardim das Américas, Curitiba - PR
Direito autoral: Este artigo está licenciado sob os termos da Licença CreativeCommons-Atribuição 4.0 Internacional.