Trademarks as an Indicator of Innovation
Implementation – Evidence from the German
Pharmaceutical and IT-Service Industries
Harm-Julian Schumacher
152113102
Dissertation submitted in partial fulfilment of the requirements of the degree of International MSc in Business Administration at Católica-Lisbon School of Business and Economics
Abstract
This paper examines the potential application of trademarks as a complemen-tary indicator of innovation. Recent innovation literature finds a correlation be-tween innovation and usage pattern of trademarks. Especially for the service industry this new approach offers potential since R&D and patents indicators do not capture innovation in these sectors. To understand the relationships between trademarks and innovation the German pharmaceutical and IT-service industries were studied. As a proxy for innovation sales and employ-ment growth were introduced. The impact of filing a trademark was then com-pared with a control group and correlations with patents examined. The re-sults show that trademarks indeed can be used as an indicator of innovation; however, with some limitations. While IT-service companies show a strong relationship between trademarks and growth, the results for the pharmaceuti-cal industry are ambiguous and need to be further examined.
Table of Contents
APPENDIX DIRECTORY ... III TABLE DIRECTORY ... IV
GRAPHIC DIRECTORY ... VIII
ABBREVIATION DIRECTORY ... IX
1. INTRODUCTION ... 1
2. THEORETICAL AND EMPIRICAL DISCUSSION OF TRADEMARKS AND OTHER INDICATORS OF INNOVATION ... 2
2.1TRADEMARK AS AN INTELLECTUAL PROPERTY RIGHT ... 2
2.1.1 Trademark Law ... 4
2.2INDICATORS OF INNOVATION AT THE COMPANY LEVEL ... 5
2.3TRADEMARKS IN INNOVATION RESEARCH ... 7
2.3.1 Empirical Studies of Trademark Innovation ... 9
2.3.2 Trademarks in the Service Industry ... 10
2.4THE LINK BETWEEN INNOVATION AND GROWTH ... 11
2.4.1 Sales Growth ... 12 2.4.2 Employment Growth ... 13 3. EMPIRICAL ANALYSIS ... 13 3.1DATA ... 14 3.2METHODOLOGY ... 18 3.3RESULTS ... 20 3.3.1 Descriptive analysis ... 20 3.3.2 Growth Analysis ... 37 CONCLUSION ... 60 APPENDIX ... X LITERATURE ... XIV
Appendix Directory
Appendix 1: Scatter graph of patent count and trademark count for the
da-taset
Appendix 2: Scatter graph of patent count and trademark count for the
phar-maceutical industry
Appendix 3: Scatter graph of patent count and trademark count for the
IT-service industry
Appendix 4: Overall trademark distribution by age Appendix 5: Overview Sales cluster
Appendix 6: Employment distribution
Appendix 7: Linear regression of employment per trademark by trademark
Table Directory
Table 1: Trademark status of complete OHIM database – p. 15 Table 2: Trademark features of complete OHIM database – p 15 Table 3: Overview of available growth data – p. 16
Table 4: Distribution of companies among different groups and industries
– p. 17
Table 5: Absolute and relative number of companies within the trademark and
control group – p. 20
Table 6: Trademark and patent distribution – p. 21
Table 7: Trademark cluster overall and by industry – p. 22 Table 8: Types of trademarks – p. 23
Table 9: Combination of different trademark types – p. 23 Table 10: Patent distribution – p. 24
Table 11: Correlation between patents and trademarks – p. 25 Table 12: IPR holdings of companies by industry – p. 25
Table 13: Linear regression of number of patent count on number of
trade-marks – p. 26
Table 14: Age distribution by industry and group – p. 27 Table 15: Trademark distribution by age and industry – p. 27
Table 16: Linear regression of average number trademarks by age for the
overall dataset – p. 28
Table 17: linear regression of number trademarks by age for pharmaceutical
industry – p. 29
Table 18: linear regression of average number trademarks by age for
IT-service industry – p. 29
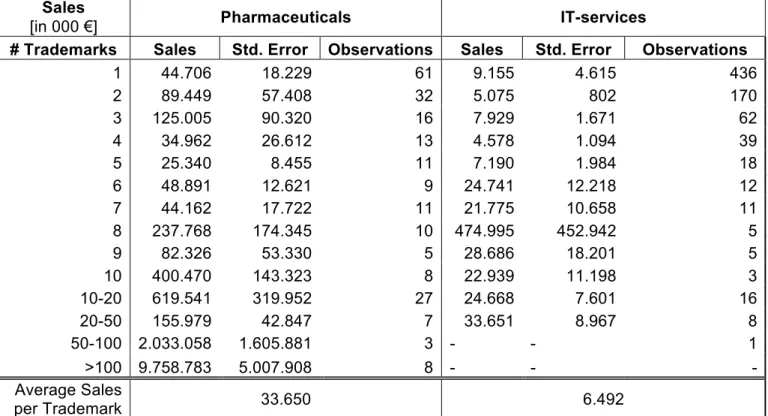
Table 19: Sales distribution by number of trademarks and industry – p. 31 Table 20: Linear regression of average sales by number trademarks for the
overall dataset and by industry – p. 32
Table 21: Average sales per Trademark by industry – p. 33
Table 22: Linear regression of sales per trademark by trademark group for the
overall dataset and by industry – p. 33
Table 24: Linear regression of employment by trademark group for the overall
dataset and by industry – p. 36
Table 25: Distribution of companies by size – p. 36
Table 26: multiple linear regression model for numbers of trademarks – p. 37 Table 27: Growth overview by industry – p. 38
Table 28: sales growth according to years after filing of trademark for the
overall dataset – p. 38
Table 29: Sales growth according to years after filing of trademark for the
pharmaceutical and IT-service industries – p. 39
Table 30: Trademark group sales growth according to year for the overall
da-taset – p. 40
Table 31: Trademark group sales growth according to year for the
pharma-ceutical and IT-service industries – p. 40
Table 32: Control group sales growth according to year for the overall dataset
– p. 41
Table 33: Control group sales growth according to year for the
pharmaceuti-cal and IT-service industries – p. 41
Table 34: Differences in sales growth rates – p. 42
Table 35: employment growth according to years after filing of trademark for
the overall dataset – p. 43
Table 36: employment growth according to years after filing of trademark for
the pharmaceutical and IT-service industries – p. 43
Table 37: Trademark group employment growth according to year for the
overall dataset – p. 44
Table 38: Trademark group employment growth according to year for the
pharmaceutical and IT-service industries – p. 44
Table 39: Control group employment growth according to year for the overall
dataset – p. 45
Table 40: Control group employment growth according to year for the
phar-maceutical and IT-service industries – p. 45
Table 41: Differences in employment growth rates – p. 46
Table 42: Sales growth rates by trademark type for the dataset – p. 47
Table 44: employment growth rates by trademark type for the dataset – p. 48 Table 45: employment growth rates by trademark type for the pharmaceutical
and IT-service industries – p. 49
Table 46: Sales growth according to years after filing of trademark for the all
SMBs – p. 50
Table 47: Sales growth according to years after filing of trademark for SBMS
pharmaceutical and IT-service companies – p. 50
Table 48: Control group sales growth according to year for SMB
pharmaceu-tical and IT-service companies – p. 50
Table 49: Differences in sales growth rates for SMBs – p. 50
Table 50: employment growth according to years after filing of trademark for
all SMBs – p. 51
Table 51: employment growth according to years after filing of trademark for
SMB pharmaceutical and IT-service companies – p. 52
Table 52: Control group employment growth according to year for the
phar-maceutical and IT-service industries – p. 52
Table 53: Differences in employment growth rates for SMB – p. 52
Table 54: sales growth according to years after filing of trademark for young
companies – p. 53
Table 55: sales growth according to years after filing of trademark for young
from the pharmaceutical and IT-service industry – p. 54
Table 56: Control group sales growth according to year for young companies
from the pharmaceutical and IT-service industry – p. 54
Table 57: Differences in sales growth rates for young companies – p. 54 Table 58: employment growth according to years after filing of trademark for
young companies – p. 55
Table 59: employment growth according to years after filing of trademark for
young companies from the pharmaceutical and IT-service industry – p. 55
Table 60: Control group employment growth according to year for young
companies from the pharmaceutical and IT-service industry – p.55
Table 61: Differences in employment growth rates for young companies – p.
56
Table 62: Comparison of sales growth by patent and trademark groups – p.
Table 63: Comparison of sales growth by patent and trademark groups for the
pharmaceutical and IT-service industries – p. 57
Table 64: Comparison of difference in sales growth for only patent and only
trademark group – p. 58
Table 65: Comparison of employment growth by patent and trademark groups
– p. 58
Table 66: Comparison of employment growth by patent and trademark groups
for the pharmaceutical and IT-service industries – p. 58
Table 67: Comparison of difference in sales growth for only patent and only
Graphic Directory
Graphic 1: Scatter plot comparing age and number of trademarks – p. 28 Graphic 2: Scatterplot comparing age and number of trademarks for the
pharmaceutical industry – p. 29
Graphic 3: Scatterplot comparing age and number of trademarks for the
IT-service industry – p. 30
Graphic 4: Scatter graph comparing # trademarks and average sales for the
overall dataset – p. 34
Graphic 5: Scatter graph comparing # trademarks and average sales for the
pharmaceutical industry – p. 34
Graphic 6: Scatter graph comparing # trademarks and average sales for the
Abbreviation Directory
BVDID Bureau van Dijk ID (BVDID)
CTIM Community Trademark (CTM)
CAGR compounded annually growth rate (CAGR)
EPO European Patent Office (EPO)
KIBS knowledge-intensive business services
OHIM Office for Harmonization in the Internal Market (OHIM)
SMB small and medium business (SMB)
1. Introduction
The understanding that innovation is an essential driver of economic growth is established in today’s society. As Schumpeter (1939, p. 83) states “nothing can be more plain or even more trite common sense than the proposition that innovation is at the center of practically all the phenomena, difficulties, and problems of economic life in capitalist society”. The importance of innovation is illustrated by various rankings like Forbes’ world’s most innovative compa-nies ranking, the Global Innovation Index or Bloomberg’s innovation index, which rank companies or countries by its degree of innovation. However, the measurement of innovation is still an ongoing discussion in the scientific community. Many different approaches have been developed and today R&D expenses, number of patents or patents citations are frequently used to de-termine the level of innovation in companies. A relatively new method is the application of trademarks as an indicator of innovation. The purpose of this paper is to determine the usefulness of trademarks to measure innovation based on empirical evidence from the German pharmaceutical and IT-service industry.
7 million trademarks applications have been filled in 2013, making them the most used form of intellectual property, even before patents with 2,6 million applications (WIPO, 2014). The enormous number demonstrates the signifi-cance as a tool for companies and the application of trademarks as an indica-tor of innovation is a logical consequence. The usage of trademarks offers two improvements over the current indicators. Firstly, trademarks are part of the effort of companies to make money with their products, services and inven-tions. While R&D can be viewed as an input into the innovation process and patents represent the output, none of these two indicators establish the con-nection between innovation and commercialization. Trademarks can help to overcome this gap since they are a crucial part of companies marketing activi-ties (Krasnikov, Mishra and Orozco, 2009). Secondly, service industries are adversely affected by R&D and patent indicators because such intellectual property rights (IPR) are hardly used within these sectors. Hence, new indica-tors have to be developed in order to determine innovation for service
compa-nies. Trademarks seem to be a promising approach since they are equally used within all kind of industries.
In order to understand the usability of trademarks as a commentary indicator of innovation, this paper developed a new approach. While many studies tried to examine the usefulness by calculating correlation between trademark and patents or conducting surveys, none uses trademarks to measure the impact of innovation. This study attempts to overcome this gap by linking trademarks to growth statistics, which represents the outcome of successful innovation. Chapter 2 discusses the theoretical and empirical literature of trademarks and innovation. The legal background is outlined and relevant processes in order to obtain a trademark are explained. The legal part is followed by an overview of the current state of research about innovation indicators. Additionally, the bridge is build between innovation and growth statistics. Chapter 3 covers the empirical part of this paper. The data sources and specification are presented and the applied methodology of the empirical work explained. The second part of chapter 4 is split into descriptive and growth analyses and discusses the results obtained by the empirical analyses. This cover sales as well as employment growth. Chapter 5 concludes the paper, summarizes the empiri-cal findings and discusses potential application of trademarks as a commen-tary indicator of innovation.
2. Theoretical and Empirical Discussion of
Trade-marks and other indicators of innovation
In order to examine the usefulness of marks as an indicator of innovation, one has to firstly understand the original purpose of trademarks, its evolution as well as today’s legal background and the rights, which are granted.
2. 1 Trademark as an intellectual property right
The first evidences of marks are found 5.000 BC as an identifier for the own-ership of livestock. Over the centuries the purpose evolved and during the Roman Empire a bricks bored the marks of its manufacturer in order to serve as a designation of the producer and his obligation for quality. With the advent of industrialization trademarks became more relevant for the economy and
hence a number of explicit trademark laws were issued in France (1857), the United Kingdom (1862), the United States (1870) (Mendonça, Pereira and Godinho, 2004). According to the Supreme Court of the United States in 1871 the purpose of a trademark “is to identify the origin or ownership of the goods to which it is affixed” and that this origin or ownership must be of a personal nature (Schechter, 1927, p. 814).
In today’s economy, however, the origin rarely plays a role in consumer deci-sions. The World Intellectual Property Organization (WIPO) defines a trade-mark as a “distinctive sign, which identifies certain goods or services as those provided by a specific person or enterprise” (WIPO, 2004, p. 8). The definition implies two essential objectives of trademarks, namely protection and dissem-ination. These two indistinguishable functions of trademarks grant company exclusive rights to mark its products and at the same time prohibit other par-ties to use the same trademark. Combining the functions allows customers to use trademarks as an identifier for customers to assign a level of satisfaction to a certain product and stimulate future purchases (Schechter, 1927). Hence, trademarks can be regarded as a marketing assets and are highly intertwined with brands (Aaker, 1991). This connection infers that “firms’ trademark activi-ties capture a significant portion of their branding efforts” (Krasnikov, Mishra, and Orozco, 2009, p. 154). However, brands are not identical in value and the determination of this value depends on many factors. In management litera-ture different sets are used, such as name awareness, customer loyalty, per-ceived quality and associations with the brand, that add value to the product being offered (Aaker, 1991). Economides is one of the first to examine the ‘Economics of trademarks’ and draws one important conclusion: a trademark should be filled when its expected revenues its the discounted costs. This means that companies only use brands if they expect a differentiation in the market from it and to extract returns (Economides, 1988).
From simple identifier of origin to complex indicators of satisfaction and reve-nue extraction tools, the evolution of trademarks demonstrates two important facts: 1) successful trademarks can be a highly valuable form of property of companies, even though they are intellectual respectively intangible assets of an organisation, 2) trademarks help to distinguish products from the ones of competitors and hence help providing an economical niche for organisations
in competition (Hunt, Muncy and Ray, 1981). These features make trade-marks an important tool of competition and assign them a key role in today’s economy. Examining the usage of trademarks offers insights into the market-ing activities and the willmarket-ingness to protect its products. In contrast, patents transfer information about the technical knowledge of a company (Sandner and Block, 2011). The next part will explain the legal background of trade-marks and the criteria to obtain one. Furthermore, differences compared to patents will be outlined.
2.1.1 Trademark Law
In the application process, certain legal requirements are checked and an ex-amination of the aspired trademark takes place. Three main requirements have to be fulfilled in order to successfully register a trademark (European Council, 1993). The first and most important requirement is distinctiveness. Since the main purpose of a trademark is to identify products and its quality, a new trademark should not deceive or mislead customers. Similarity and con-flict with other trademarks are hence forbidden. Secondly, a trademark should be able to graphically represent a company, respectively brand. Today vari-ous kinds of trademarks are allowed. The most used ones are word and fig-urative trademarks, but also sounds, colours, fragrances and 3D forms can be registered. Thirdly, a generic sign or word cannot be registered since the pur-pose of a trademark is to establish a direct link between a company and cus-tomers (WIPO, 2012).
The criteria for registering a trademark are in sharp contrast to criteria for pa-tents. Patents are only granted to technical ideas on the basis of non-obviousness, inventiveness in the face of prior art and the potential for indus-trial application Besides the difference in the purpose, there are several other important legal requirements Firstly, the length of the period during which the exclusive rights are granted. While a patent normally expires after 20 years, a trademark can be renewed indefinitely. This renewal however, requires a reg-ular fee and therefore makes it costly for companies to maintain a trademark (WIPO, 2004a). Furthermore, the law requires trademarks to be used and non-usage leads can lead to the cancelation of a trademark after a period of usually five years within the European Union (OHIM, 2014). Millot (2009) finds
evidence that many trademarks are actually not use and cancelled after a pe-riod of six or seven years.
The time between filing and finally obtaining a trademark it is much smaller compared to patents. Successfully registering a trademark in Europe normally takes up to one year. In contrast the process for a patent can last as long as five years. Moreover, the usage of a trademark is not linked to the filings. Companies can use trademarks before or directly after the filing and the regis-tration is a requirement only for protection against the usage of others (WIPO, 2004a).
The first international trademark agreement was reached at the Paris conven-tion 1883. Its main outcome was that foreign applicants enjoy the same rights as local holders. Today the WIPO, which emerged from this conference, facili-tates Intellectual property rights on the global scale. In the Europe Union the Office for Harmonization in the Internal Market (OHIM) was established in 1994 and with it the Community Trademark (CTM), which allows simultaneous registering of trademarks in all European countries and provides a relevant and complete database (Mendonça, Pereira, and Godinho, 2004).
The next chapter demonstrates how brands and trademarks interlink with the theory of innovation and how they might be used to measure innovation in or-ganisations.
2.2 Indicators of Innovation at the Company Level
The key players in the innovation process are business enterprises. Their combination of short-term abilities and long-term vision make them the main driver of technological change (Chandler, 1994). The innovation process is defined as a learning process that generates or acquires new knowledge with the ultimate goal to utilise this knowledge and create an economic value (Witt, 1993). It can be split into two parts: economic creativity and innovation imple-mentation (Williams and McGuire, 2010). Economic creativity is ‘‘any form of creativity that results in codified knowledge with potential economic value’’. However, Innovation ‘‘goes beyond’’ creativity and implementation is a central part of it. Only put together innovation occurs and each part requires different measures and indicators (Guerrero-Cusumano and McGuire, 2001).
The measurement of innovation activities in companies is highly complex and to pinpoint effects and relevance is a difficult undertaking, which is aggravated by economic, social, technological and organisational interdependences (OECD, 1992). In order to be a suitable indicator several requirements have to be fulfilled: 1) a significant correlation between the indicator and innovation has to exist 2) the number of applications has to be sufficiently high in order to achieve statistically relevant results 3) the indicators has to be electronic ac-cessible 4) a partition along various factors is crucial 5) An international com-parison should be possible (Schmoch, 2003). Until this point various indica-tors have been developed and used to measure innovation on a firm level. Like the innovation process itself, its indicators can be divided into the two groups: economic creativity and innovation implementation. Economic creativ-ity can be further divided into input and output driven indicators. R&D expendi-tures are mainly used to measure innovation input, while output and its quality is measured through the number of patents, respectively the number of cita-tions a patent receives. R&D is understood as an investment activity of com-panies into its ‘knowledge stock’ and can thus be used as a proxy to under-stand how much companies invest into its innovation capabilities (Hall, Jaffe, and Trajtenberg, 2005).
Patents are the output of the R&D activity of companies. Pakes and Griliches (1980) were able to prove this strong relationship between R&D and patents. Across various firms and industries they demonstrate a company can change its inventive output (patents) by adjusting the input (R&D). As a first approach on a macro scale, the number of patents per company has been used as an indicator (Griliches, 1984; Scherer, 1965; Schmookler, 1666). Using only the number of patents, however, is inherently limited since patents vary extremely in their value and technological importance and hence, further indicators were developed. A first step towards understanding the heterogeneity of patents was the examination of renewal rates by Pakes and Schankerman (1984), which demonstrated obvious differences in patents. In order to determine the importance of patens, citations were revealed as the obvious mean to achieve this goal. Trajtenberg (1990) and Albert, Avery, Narin and McAllister (1991) were the first among other to follow this new path to classify patents and thus
approach conveys two major implications of innovation. Firstly, citations allow to link inventions and its distribution over the world and influence on new in-ventions. Secondly, it allows assigning ‘values’ to patents and thereby differ-entiating between patents and its importance (Hall, Jaffe and Trajtenberg, 2005).
Even though R&D remains the stronger indicator for market values, several studies examined the usage of citations as a determinant of the market value. While (Hall, 2000) finds that the explanatory power is lower compared to R&D expenses, patents still add useful information above and beyond R&D. Hall, Jaffe and Trajtenberg (2005) demonstrate that patent citations can be used as a complementary indicator besides R&D. Citations are more correlated to R&D than simple patent counts and including them into market value equa-tions increases the predictive power of a Tobin’s q analysis.
While R&D and patents respectively patent citations provide interesting in-sights about invention in companies and their technical level, its explanatory potential is limited. Both do not offer insights into commercial aspects of inno-vation and it is thus questionable if all relevant areas are covered. Looking at Williams and McGuire (2010) definition of the two folded innovation process, only economic creativity is taken into account and innovation implementation left untouched by R&D and patent indicators. Overall, there is no single indi-cator which can fully reflect innovative activity and its results (Malmberg, 2005).
Hence, further proxies have to be developed and combined with the existing ones in order to tackle shortcomings. A new promising approach is to use reg-istered trademarks. Trademarks in particular are an indicator of innovation implementation (Williams and McGuire, 2010) and the next part discusses previous studies and the usefulness of trademarks from a theoretical point of view in order to measure innovation.
2.3 Trademarks in Innovation Research
Examining the current innovation research, theoretical as well as empirical justification for the usage of trademarks as an indicator can be found. Surveys across various industries have found that companies use different means to protect their innovations and extract returns. A common finding of all the
stud-ies is that only in a few industrstud-ies patents are used as the major tool to protect innovation only. Other tools such as secrecy, lead time or exploitation of repu-tation are used and especially marketing activities and assets play a signifi-cant role and are widely spread along various industries (Cohen, Nelson, and Walsh, 2000; Levin. Klevorick,Nelson and Winter, 1987). The importance of marketing, and hence trademarks, is confirmed when examining the associat-ed costs of launching an innovation. Pavitt (1985) concludes that half of the expenditures are linked to R&D activities and the other half to production, en-gineering and marketing.
While not every trademark is linked to a new or innovative product or service Mendonça, Pereira and Godinho (2004) are able to connect innovations stud-ies and trademarks using an economic rational. They argue that trademarks need to have an expected positive net present value in order to be filled. Only if the new product offers a substantial differentiation, a trademark is filled be-cause sufficient profits can be generated. Hence, trademarks connected to an innovation represent the majority of filings. Furthermore, Mendonça, Pereira and Godinho conclude that trademarks are registered only shortly before the launch of a product, indicating a later phase in the innovation process com-pared to patents.
Following the arguments of Mendonça, Pereira and Godinho (2004) trade-marks help understanding the last step in the innovation process, namely the innovation implementation, due to its connection to marketing efforts of com-panies (Hipp and Grupp, 2005). Comcom-panies launching new innovations, asso-ciate it to a new brand and apply for a new trademark to foster the perception by consumers (Millot, 2009). Therefore, it seams reasonable that companies only apply for new trademarks, when they launch major upgrades to inform the customers and not for minor enhancements (Malmberg, 2005). Combin-ing the arguments above, one can conclude that the registration of a trade-mark indicates an innovation new to the firm, either in form of a major upgrade or as a new product or service.
Considering practical arguments, there are several advantage using mark data as an indicator. Firstly, the available data is beneficial since trade-marks have been recorded regularly and systematically for decades in many
number available, electronically accessible, divided by sector and widely spread all over the world, enabling international as well as cross-industry comparison (Millot, 2009).
2.3.1 Empirical Studies of Trademark Innovation
There are also several empirical studies examining the connection between innovation and trademarks. (Allegrezza and Guard-Rauchs, 1999) examine the connection between innovation, proxied by R&D intensity, and trademarks of 2.500 Benelux SMEs. They are able to prove a significant positive relation. Schmoch (2003) finds similar results for the European manufacturing sector, namely a strong correlation between the usage of trademarks and patents. Results from the third Community Innovation Survey (CIS) delivers further ev-idence regarding the usage of trademarks and patents by innovative firms. Across various European countries, the survey rates companies along their innovativeness and ask about the usage of IPRs. In general, the usage of trademarks is more widely spread than patents, which is logical due to the stricter legal requirements. Moreover, the survey demonstrates that innovative firms use more trademarks and patents than in non-innovative firms (Lucking, 2004). These results are confirmed by Mendonça, Pereira and Godinho (2004) in their study about IPRs and in particular trademark usage. The evi-dences from Portugal also suggest that companies, which use one form of IPR, also tend to use other IPRs.
An exploration of the Swedish electromechanical, automotive and pharmaceu-tical industries between 1945 and 1996 delivers ambiguous results. One the one hand trademarks are unreliable as an indicator in the automotive and electromechanical industry due to the inconsistent usage. Companies often use model numbers instead of trademarks to identify products and hence limit the explanatory power of trademarks. Swedish pharmaceutical companies on the other hand have been a frequent user of trademark for a long time. Firstly, a high percentage of new products have been trademarked. Secondly, the number of new trademarks has a significant long-term correlation with the fil-ing of new drugs. Furthermore, a correlation between patents and trademarks in discovered; however, patents follow a 20-year peak interval while trade-marks follow a 10-year peak interval. This lead to the conclusion that the
combination delivers interesting results regarding innovations studies and that trademarks are able to more short-term insight beyond the insights gained from patents (Malmberg, 2005).
Only few studies examined the relationship between trademarks and econom-ic performance of companies; however, these ones were able to find a posi-tive a correlation. Griffiths, Jensen and Webster (2011) use trademark depos-its, patents and industrial designs as an indicator of innovation and examine the influence on the growth of profits. They conclude that trademarks have a positive impact; however, not as strong as the one of patents and designs. Greenhalgh and Rogers (2012) find a similar relationship between trademark and a company’s stock value. It can be inferred that trademarks act as a proxy for unobservable characteristics that raise productivity. Seethamraju (2003) finds a positive correlation between trademarks and sales and are able to link the correlation to increased market values of companies. Krasnikov, Mishra, and Orozco (2009) evaluate the impact of trademark filings on the fi-nancial performance of companies. Distinguishing between brand-identification and brand-association trademarks, they find a positive relation between the filing of a brand-association trademark and a firm’s stability and size of cash flows, Tobin’s q, ROA and stock returns. However, the affect of filings diminishes with increasing customer brand awareness.
2.3.2 Trademarks in the Service Industry
Trademarks as an indicator of innovation are in the service industry are em-phasised for two reasons: Firstly, the importance of the service sector for the economy has constantly risen over the last decades (Arundel, Kanerva, Cruysen and Hollanders, 2007; OECD, 2005) and examining innovation in the tertiary sectors becomes increasingly important. Secondly, the definition of appropriate innovation indicators for services is difficult (Djellal and Gallouj, 1999)and patent and especially R&D measures have proven to be especially disadvantageous for the service industry (Hipp and Grupp, 2005). Hence, the development of new indicators is essential.
Various studies examine the potential usage of trademarks as indicator in the service industries and provide interesting results. A study by Hipp and Grupp (2005) confirms that innovation in services is different to innovation in other
areas and hence, must be handled in a different way. A special emphasis is put on knowledge-intensive business services (KIBS), because these compa-nies facilitate innovations in other economic sectors as well as drive innova-tion in other companies (Hartshorn and Wheeler, 2002). KIBS sectors include computer services, R&D services, legal, accountancy, management services, architecture, engineering, technical services, advertising and market research (Miles, 2005). CTM application data shows that KIBS classes are among the classes which mostly sought trademark protection between 1996 and 2002 (Mendonça, Pereira and Godinho, 2004).
Examining the correlation between trademark and innovation success in KIS and KIBS a particularly strong and statistically significant correlation is found. The explanatory power is especially high for product innovations and trade-marks are likely to be a suitable indicator of innovation in these sectors (Gotsch and Hipp, 2012). Schmoch (2003) finds a significant correlation be-tween trademarks and the level of innovation, which is represented by the share of revenues with new products and services. As a next step subsectors were defined, namely technology-oriented services and knowledge-intensive services (KIS). While KIS companies have a significant correlation (5%) with marks and a low significant correlation with patents (10%), the opposite is true for technology-oriented services with a highly significant (1%) correlation with patents and a low significant correlation with trademarks (10%).
After confirming the usefulness of trademarks as an indicator of innovation in services through theory and practical evidence, the next chapter connects in-novation and growth statistics in order to measure inin-novation within compa-nies.
2.4 The Link between Innovation and Growth
A major difficulty in observing innovation in growth statistics is the time lag be-tween developing an invention and transforming it into measurable economic performance. Especially the long way from R&D as innovation input over pa-tents as output of economic creativity to the commercialisation makes it diffi-cult to link both indicators to sales or employment growth (Coad, 2009). Com-panies have to undertake product development or may even delay this willing-ly (Bloom and Van Reenen, 2002). However, trademarks are onwilling-ly filled shortwilling-ly
before launching a new product and cover the commercialization of innova-tion. Hence, they may overcome the time problem and provide an instant link between innovation and growth.
In the following sales and employment growth are analysed separately since sales growth is an output and employment growth and input.
2.4.1 Sales Growth
A McKinsey Global Survey of Business Executives states that “[e]xecutives overwhelmingly say that innovation is what their companies need most for growth” (Carden, Mendonca, and Shavers, 2005, p. 17). Another survey ex-amining SMEs find out that the most important strategy for expansion is in-vestment in product innovation (Hay and Kamshad, 1994). While in economic theory innovation has been identified as a central aspect of sales growth (Klette and Griliches, 2000), finding empirical evidence is challenging.
Mansfield (1962) undertook on of the first attempts by examining the steel and petroleum industries. Over a 40-year period he concludes that innovators grew more quickly, especially if they were small. Geroski and Machin (1992) provide similar results when looking at large quoted UK firms. Innovators are more profitable and grow than non-innovative firms. Another study compares patents and sales growth within the 365 large US corporations. It can be de-termined that the patents positively influence sales growth and subsequently profits growth (Scherer, 1965). The influence of R&D on sales growth is stud-ies by (Mowery, 1983) in the US manufacturing industry between 1921 and 1946. Only between 1933 and 1946 a positive influence of R&D is observed and no difference between small and large companies can be determined. Roper's (1997) observations of small companies from the UK, Ireland and Germany show that a contribution by innovative products to sales growth. Overall, it can be determined that patents and R&D have several limitations when using them to measure sales growth. R&D is an innovation input and normally relatively smoothed over time. Patents have a skewed value distribu-tion as well as a long time to market. These drawback result in a poor usage as indicators of innovation (Coad, 2009). To tackle this shortcomings, Coad and Rao (2008) create a variable to simulate innovativeness combing R&D and patents. The results challenge the importance of innovativeness for sales
growth and rather determine that it is only crucial for a few high-growth com-panies. Similar results can be found in the pharmaceutical industries, where few blockbuster drugs generate huge profits, but median drugs have a nega-tive net present value below R&D expenditures (Grabowski, Vernon, and DiMasi, 2002).
2.4.2 Employment Growth
The impact of innovation on employment growth is considered two-folded in literature. One the one hand process innovation goes along with an increase in productivity and may lower the required amount of labour. On the other hand product innovations are associated with employment increases. Hence, a differentiation between product and process innovation takes place in the recent innovation research. The impact of process innovation will be disre-garded for the purpose of this study, since it can be assumed that trademarks are rarely filled for process innovations and that product innovations repre-sents the majority of applications. Furthermore, indirect effects between the different forms of innovation on employment will be ignored.
Looking at product innovations studies, many find a positive correlation with employment. Brouwer, Kleinknecht, and Reijnen (1993) examine product re-lated R&D expenditures and prove a small positive effect on employment. Similar results are confirmed by Van Reenen (1997) and (Smolny, 1998) for manufacturing companies from the UK and Western Germany, respectively. A study in four European countries (France, Italy, the UK and Germany) be-tween 1998 and 2000 examines manufacturing as well as service industries. While process innovation appears to have a negative effect, product innova-tion is associated with employment growth in companies (Harrison, Jaumandreu, Mairesse and Peters, 2014). Overall, the evidence presented suggests a correlation between product innovation and employment growth, which will be tested in the following chapter.
3. Empirical Analysis
After providing a theoretical and empirical foundation the next chapter covers an empirical approach to understand the relationship between trademarks and innovation. Chapter 3.1 outlines the data used for this paper and chapter 3.2
explains the method used to gain further insights. Chapter 3.3 summarises the achieved results and differentiates between descriptive and growth statis-tical analysis.
3.1 Data
This paper brings together three different data sources: 1) trademarks data, 2) patent data and 3) economic company data. The following chapter will de-scribe the different data sources as well as the preparation of the data that took place in order to perform different statistical analysis.
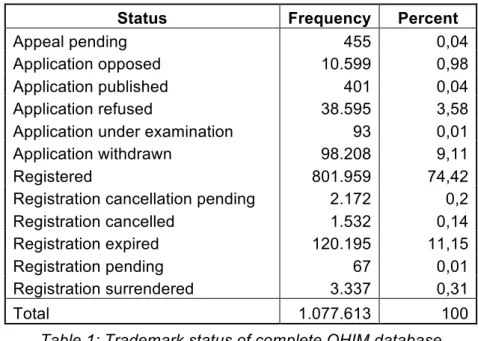
For international comparable trademark statistic, the OHIM database was used. While it is biased towards European companies, it offers many analyti-cal advantages. Firstly, all trademark applications are evaluated the same way and no combination of different criteria takes place, which happens when combining different data sources. Secondly, the OHIM data is freely available and presents a huge amount of comparable data. In particular the information regarding the status of the trademark, its filing, registration as well as expiry date and the kind of trademark are relevant for the statistical analysis. Overall, the database consists of 1.077.613 trademark applications between the years 1996 and 2013. Table 1 demonstrates the different status of the applications for a CTM.
Status Frequency Percent
Appeal pending 455 0,04
Application opposed 10.599 0,98
Application published 401 0,04
Application refused 38.595 3,58
Application under examination 93 0,01
Application withdrawn 98.208 9,11
Registered 801.959 74,42
Registration cancellation pending 2.172 0,2
Registration cancelled 1.532 0,14
Registration expired 120.195 11,15
Registration pending 67 0,01
Registration surrendered 3.337 0,31
Total 1.077.613 100
Table 1: Trademark status of complete OHIM database
The most frequent status are ‘Registered’, ‘Registration expired’, ‘Application withdrawn’ and ‘Application refused. Table 2 demonstrates the different types of the whole database.
Type Frequency Percent
3-D 6.935 0,64 Colour 813 0,08 Figurative 416.142 38,62 Hologram 9 <0,00 Olfactory 7 <0,00 Other 634 0,06 Sound 200 0,02 Word 652.873 60,59 Total 1.077.613 100
Table 2: Trademark features of complete OHIM database
The most frequent used types of trademarks are word and figurative trade-marks representing over 99% of the different trademark types.
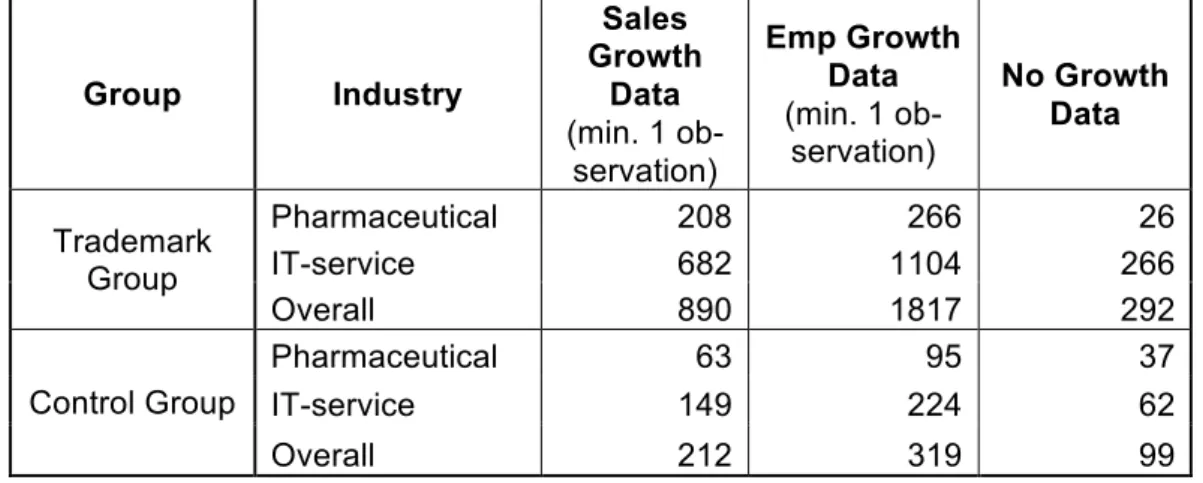
The company information are provided by the Bureau van Dijk database. Based on the Bureau van Dijk ID (BVDID) various information are assigned to a company, namely the foundation date, the last information date, sales and employment information between the years 2005 to 2014 and the NACE clas-sification. The NACE information has advantages over the NICE classification of trademarks, because it more detailed with 615 classes compared to 45 classes. Furthermore, it assigns each company specifically to one industry, while a trademark can have several NICE classes. Regarding the company
information it is important to know that the sales and employment data is not available for each year for each company (see table 3).
Group Industry Sales Growth Data (min. 1 ob-servation) Emp Growth Data (min. 1 ob-servation) No Growth Data Trademark Group Pharmaceutical 208 266 26 IT-service 682 1104 266 Overall 890 1817 292 Control Group Pharmaceutical 63 95 37 IT-service 149 224 62 Overall 212 319 99
Table 3: Overview of available growth data
Only 292 companies in the trademark group and 99 companies in the control group neither have sales nor employment data (taking into account the calcu-lations of a CAGR, see chapter 3.2 Methodology).
As a next step the CTM data and company data is merged using the ‘OHIM-BVDID’ table, which assigns each trademark application to the respective company. By keeping the complete merges as well as the incomplete ones (containing only companies without trademark applications) a database with two groups is created. Firstly, firms which applied for trademarks and have available economic information (merge = 3, called ‘trademark group’ / control = 0) and secondly, companies which did not apply for a trademark and have available economic information (merge = 1, called ‘control group’ group’ / con-trol = 1). The trademark group consists of 621.810 applications form 196.594 companies and the control group of 73.936 companies.
Based on the literature discussion above (see chapter 2.3 Trademarks in In-novation Research) the pharmaceutical and IT-Service industry reveal them-selves as interesting industries to study. In his examination of Swedish com-panies Malmberg (2005) identifies the pharmaceutical industries as a strong user of patents as well as trademarks. Various studies examine KIS and KIBS and find positive correlation between innovation and trademarks (Gotsch and Hipp, 2012; Mendonça, Pereira, and Godinho, 2004; Schmoch and Gauch, 2009). According to the definition of Miles (2005) the IT-service industry, as a computer service, qualifies as a KIBS and furthermore, is a service industry
that registers a relatively high number of patents. Hence, the German phar-maceutical and IT-service industries are selected for further studies due to the evidence found in other papers.
Hence, the new database is filtered for the German pharmaceutical and IT-service companies and only registered trademarks are kept which leaves 7.235 observations. Industry # Companies Trademark Group Pharmaceutical 292 IT-services 1.375 Overall 1.667 Control Group Pharmaceutical 136 IT-services 293 Overall 429
Table 4: Distribution of companies among different groups and industries
The trademark group represents 1.667 companies with 6.816 registered trademarks and the control group 429 companies of the whole dataset. The source for the patent data is the European Patent Office (EPO). The ad-vantages of using the EPO database are similar to the OHIM database. First-ly, EPO and OHIM cover roughly the same geographic area, including Ger-many. Secondly, based on the BVDID the database provides a good over-view, which European patens companies hold. Thirdly, the EPO data is freely available in an electronic form. The overall database comprises 1.355.949 pa-tent entries from various European companies. Each objective was merged with the priority information in order to determine the filing date and hence the expiry date. Based on this information a count of patents by company was created, giving the number of valid patents for each year between 2005 and 2014. As a next step the complete patent information was merged with the trademark and control group. After the merge, companies with and without patents were kept. Overall 620 companies from the dataset hold valid 22.842 patents (see appendix 1).
After the data preparation the dataset contains data of companies from the German pharmaceutical and IT-service sector regarding economic information like sales and employment, trademark information as well as patent
infor-mation. Based on the final database various statistical analyses are per-formed. The methodology will be outlined in the next chapter.
3.2 Methodology
The description of the methodology is separated into two parts. Firstly, the descriptive and afterwards the growth analysis will be described.
Descriptive Analysis
Regarding the descriptive analysis a few relevant steps have been taken. Firstly, in order to analysis sales and employment in a timely independent manner, only the latest available sales, respectively, employment data has been used. Furthermore, different division were created in order to reach a better understanding of the dataset. Firstly, a clustering of the companies us-ing the number of registered trademarks was conducted. Based on these clusters various age, sales and employment analysis were conducted. Sec-ondly, different age clusters were created to understand average number of trademarks based on the time a company existed. Thirdly, clusters based on sales were built in order to get an overview about the different sales groups. Fourthly, the same clustering was performed for employment. Fifthly, a classi-fication regarding size was implemented. Moreover, differentiation along types of trademarks was made in order to identify different usage patterns. The classification in different groups (trademarks, age, size, sales, employment) follows the purpose to simplify descriptive analysis and make them easier to read and interpret.
For the multiple regression analysis three different dummy variables were created, which function as the independent variables: 1) IT dummy (takes val-ue 1 if IT-service company) 2) small dummy (takes valval-ue 1 if size equal or small than 100 employees) 3) age dummy (takes value 1 if company younger than six years). As a dependent variable the number of trademarks in compar-ison to number of employees was chosen. With this variable it is possible to understand the influences of different factors on the number of trademarks and control for size effect through the employment information.
Growth Analysis
As a first step a count of number of trademarks was created for each compa-ny, overall as well as segmented by type for. Next the complete data was col-lapse by company and transformed into a time series in order to perform fur-ther analysis. The time series covers the years 2005 to 2014 for every com-pany and indicates in which year a certain type of trademark was filled. The structure of the time series allows differentiating by years since a trademark was filled.
In order to fill gaps in growth data, a compounded annually growth rate (CAGR) as calculated. The CAGR allows evaluating growth statistics even if no data exists fro the respective year.
Subsequently, the actual growth analyses were conducted. For the trademark group, only growth rates were used that lay within a ten-year time frame after the filing of a registered trademark. This follows the results of Millot (2009) re-garding the long-term effect of trademarks. The usage of the filing year, and not the registration year, is explained by the possibility to directly use a trademark and that trademarks are filled shortly before usage (Hipp and Grupp, 2005; Mendonça, Pereira and Godinho, 2004).
Generally, an overall analysis was performed as well as a separate analysis of the pharmaceutical and IT-service industries. In order to allow comparison with the control group two different outputs were used for the growth statistics. Firstly, an analysis was conducted which estimates the average growth rela-tive to the year a trademark was filled (examination of year 1 to year 10 after the filing separately as well as growth averages of the years 5, 6-10 and 1-10). However, this analysis does not allow a direct comparison between the trademark group and the control group because the control companies did not file trademarks and thus do not have a filing year. Hence, a second analysis was performed comparing the trademark and the control group year by year (from 2006 to 2014).
After the initial general analysis between trademark and control group, growth averages were used for the comparison of different sub categories. Firstly, a differentiation took place between small and medium business (SMB) and big corporation. The objective is to understand the impact of innovation on small
companies and if trademarks are more suitable as an indicator such firms (Krasnikov, Mishra, and Orozco, 2009; Mansfield, 1962). Companies with 100 or less employees were subsequently classified as SMBs.
Along the same objective a separation between young and old companies took place. For this purpose the companies were divided in three different groups: 1) younger or equal to 5 years, 2) between 6 and 10 years and 3) older than 10 years. The age analysis was adapted on a year-to-year basis where the companies became older within the time series.
In order to evaluate the impact of different type of trademarks, a comparison between growth statistics for word, figurative and other trademarks was con-ducted. Other trademarks are defined as 3D, colour and sound and group be-cause of their limited appearance within the dataset.
The last part of the empirical studies covers with the relationship of trade-marks, patents and growth statistics. As a first step a yearly patent and count for each company was created. Based on this count various correlation and growth analysis were performed.
After explaining the methodology of the various analyses the next section pre-sents the outcome and empirical results of this study.
3.3 Results
The following results are split into two parts. Firstly, a descriptive analysis is presented regarding the dataset, the trademarks, companies divided by indus-try as well as sales and employment information. The second part outlines the performed growth analyses for the trademark and control group.
3.3.1 Descriptive analysis
The dataset consist of 2.291 companies.
Absolut
frequency Pharmaceuticals IT-service
Relative Frequency Pharmaceutical IT Ser-vices Trademark Group 292 1.375 1.667 Trademark Group 14% 66% 1667 Control Group 136 293 429 Control Group 6% 14% 429 428 1.668 2.096 20% 80% 2.096
Hereof 1.667 companies are within the trademark group and 429 companies are in the control group. Overall, 428 companies are from the pharmaceutical industry and 1.668 from the IT-service industry. Table 5 reveals that overall the dataset contains 4 times as many IT-service companies as pharmaceuti-cal companies.
Intellectual Property Right Distribution
Table 6 outlines the number of trademarks and patents within each group, giv-ing a split by industry and group. A notable fact is that the absolute number of trademark and patents is higher for the pharmaceutical industry than the IT-Service industry, which is caused by the higher number of IPRs for pharma-ceutical companies.
Year 2014 Industry # Registered Trademarks Trademarks Average # Companies w Trademarks Patents # Valid Average # Patents Companies w Patents
Trademark Group Pharmaceutical 3.829 13,1 292 17.714 121,3 146 IT services 2.918 2,1 1.375 596 4,5 130 Overall 6.747 4,0 1.667 18.310 66,3 276 Control Group Pharmaceutical - - - 4.065 32,2 126 IT services - - - 467 2,1 218 Overall - - - 4.532 13,1 344
Table 6: Trademark and patent distribution
Furthermore, a pharmaceutical company has on average 9,3 patents per trademark, while for the IT-service industry the same ration is much lower with 2,1 patents per trademark. These evidence show that both industries rely on the usage of trademarks as well as patents; however, the IT-service industry, as a KIBS, uses relatively more trademarks and thus confirms findings from previous studies (see chapter 2.3.2 Trademarks in the service industry). The companies were clustered into groups based on the number of registered trademark.
Trademark Cluster
Overall Pharmaceutical IT-Service
# % # % # % 1 939 56,33 94 32,19 845 61,45 2 331 19,86 45 15,41 286 20,8 3 108 6,48 21 7,19 87 6,33 4 70 4,2 20 6,85 50 3,64 5 41 2,46 13 4,45 28 2,04 6 23 1,38 9 3,08 14 1,02 7 29 1,74 12 4,11 17 1,24 8 18 1,08 10 3,42 8 0,58 9 15 0,9 6 2,05 9 0,65 10 13 0,78 9 3,08 4 0,29 ]10-20] 48 2,88 31 10,62 17 1,24 ]20-50] 18 1,08 9 3,08 9 0,65 ]50-100] 6 0,36 5 1,71 1 0,07 >100 8 0,48 8 2,74 - - Total 1.667 100 292 100 1.375 100 Skewness 17,07 7,30 9,76 Kurtosis 336,64 61,60 153,89
Table 7: Trademark cluster overall and by industry
Firstly, it is noticeable that no IT-service company has more than 100 trade-marks and that more than 61% only have a single one. Almost 90% of the companies have three or less trademarks. In the pharmaceutical industry over 80% of the companies have between one and ten trademarks. These findings are confirmed by the skewness and kurtosis of the two distributions. The dis-tribution of trademarks in pharmaceuticals is more evenly than in IT-services and the tail of the IT-service is much heavier showing that the tail is relatively longer. This adds that the IT-service companies only use a more limited num-ber of trademarks compared to pharmaceuticals and that companies with a high number are relatively rare.
Also the usage of different type of trademarks reveals interesting difference between the industries.
Year 2014 Overall Pharmaceutical IT-service Type # % # % # % 3-D 16 0,23% 16 0,41% 0 0,00% Colour 1 0,01% 1 0,03% 0 0,00% Figurative 1344 19,72% 555 14,35% 789 26,76% Sound 3 0,04% 3 0,08% 0 0,00% Word 5452 79,99% 3.293 85,13% 2159 73,24% Overall 6.816 100% 3.868 100% 2.948 100%
Table 8: Types of trademarks
Looking at table 8 it becomes obvious that pharmaceutical not only use more trademarks, but also more advanced ones. While IT-service companies use only word and figurative trademarks, pharmaceutical ones rely on 3-D figures, colours and sounds, even though in very small numbers. This confirms the observation that pharmaceutical companies are heavier users of trademarks, not only in number but also in types. Interestingly, the usage of figurative trademarks is relatively higher in IT-service with 27% compared to 14%. Hol-ograms, olfactory (scents) and any other form of trademarks are not used by any of the two industries. After studying the different types of trademarks on an individual basis, the next step is to analyse the composition within the companies and how they tend to combine.
Trademark Type Combina-tions # % Trademark Type Combina-tions # % Trademark Type Combina-tions # %
fig 307 18,42 fig 41 14,04 fig 266 19,35
word 987 59,21 word 138 47,26 word 849 61,75
word_fig 366 21,96 word_fig 106 36,3 word_fig 260 18,91
word_fig_other 6 0,36 word_fig_other 6 2,05 word_fig_other 0 0
word_other 1 0,06 word_other 1 0,34 word_other 0 0
Total 1.667 100 Total 292 100 Total 1.375 100
Table 9: Combination of different trademark types
Examining table 9 is clearly demonstrates that the single usage of word trademarks is by far the most frequent combination. Especially in the IT-service industry over 60% of the companies solely use word trademarks. Re-garding the second most used combination differences in the industries are noticeable. While in the pharmaceutical industry the word & figurative combi-nation is used by 36% of the companies, companies in the IT-service industry evenly use solely figurative or a combination of word and figurative
trade-marks. 3-D, colour and sound trademarks appear only in combination with word or word and figurative trademarks and only in the pharmaceutical indus-try.
The next part covers the distribution of patents overall and within the tries (table 10). Similar to the pattern of trademarks, the pharmaceutical indus-try is a heavier user of patents.
npat_cluster Overall Pharmaceutical IT-Service
# % # % # % 1 233 38% 51 20% 182 50% 2 121 19% 42 16% 79 22% 3 49 8% 20 8% 29 8% 4 43 7% 21 8% 22 6% 5 24 4% 11 4% 13 4% 6 16 3% 11 4% 5 1% 7 10 2% 6 2% 4 1% 8 10 2% 5 2% 5 1% 9 6 1% 3 1% 3 1% 10 4 1% 2 1% 2 1% ]10;20] 41 7% 28 11% 13 4% ]20;50] 28 5% 23 9% 5 1% ]50;100] 10 2% 9 3% 1 0% ]100;[ 26 4% 26 10% - - Total 2.260 100 258 100 363 100 Average # of Patents 35,78 79,05 3,01
Table 10: Patent distribution
While over 50% of the IT-services have only one patent, the same is only the case for 20% of the pharmaceutical companies. Moreover, 44% have more than 5 patents and 10% even more than 100. None IT-service company has that many patents. This difference in distribution is also reflected in the aver-age number of trademarks with 79 respectively 3 patents per company (if trademark and control group are combined).
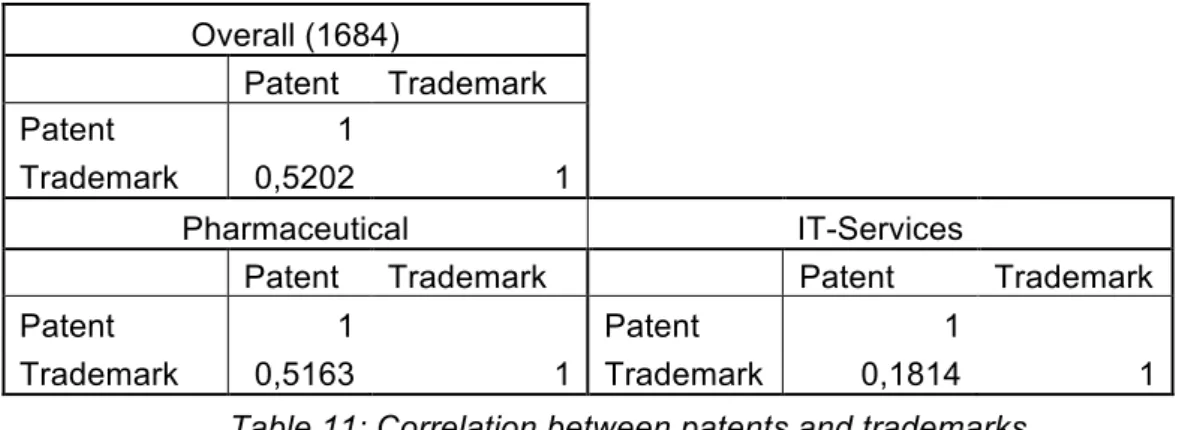
The correlation between the count patents and the count of trademarks re-veals a moderately high value of 0,5202. This is in line with the previous find-ings of the dataset that the trademark group is a heavier user of patents than the control group.
Overall (1684)
Patent Trademark
Patent 1
Trademark 0,5202 1
Pharmaceutical IT-Services
Patent Trademark Patent Trademark
Patent 1 Patent 1
Trademark 0,5163 1 Trademark 0,1814 1
Table 11: Correlation between patents and trademarks
The IT-service industry, however, has a low coefficient of only 0,1814. Hence, the linear relation is positive, but very weak. To get a better understanding, the companies were analysed in absolute and relative terms regarding their IPR holdings.
Year
2014 Group
Overall Pharmaceutical IT-Services
Patent No Patent Patent No Patent Patent No Patent
Absolute Trademark 271 1396 141 151 130 1245
No Trademark 318 111 108 28 210 83
Relative Trademark 13% 67% 33% 35% 8% 75%
No Trademark 15% 5% 25% 7% 13% 5%
Table 12: IPR holdings of companies by industry
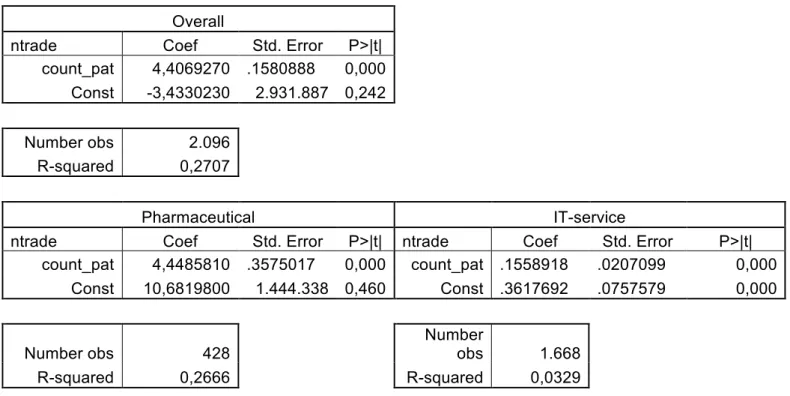
Table 12 show that one third of the pharmaceutical companies combine pa-tents and trademark, while 60% rely on only one of the two. IN the IT-service industry, however, over 88% of the companies use only one form of IPR (13% patents, 75% trademarks) and only 8% combine the two forms. Interestingly, the share of companies within the pharmaceutical industry is higher than in the IT-service industry with 7% and 5%, respectively. The regression analysis confirms this picture. The influence of patents on trademarks in the pharma-ceutical industry is much higher, which is indicated by the patent coefficient of 4,44 compared to 0,16 in the IT-services.
Overall
ntrade Coef Std. Error P>|t|
count_pat 4,4069270 .1580888 0,000 Const -3,4330230 2.931.887 0,242 Number obs 2.096 R-squared 0,2707 Pharmaceutical IT-service
ntrade Coef Std. Error P>|t| ntrade Coef Std. Error P>|t|
count_pat 4,4485810 .3575017 0,000 count_pat .1558918 .0207099 0,000 Const 10,6819800 1.444.338 0,460 Const .3617692 .0757579 0,000 Number obs 428 Number obs 1.668 R-squared 0,2666 R-squared 0,0329
Table 13: Linear regression of number of patent count on number of trademarks
Furthermore, the r-squared it higher for the pharmaceutical industry, showing that 23% (0,26 – 0,03) more of the variation is explained by patents in this in-dustry. In general the findings of Malmberg (2005) study of the Swedish pharmaceutical industry are confirmed and we find a correlation between the number of patents and trademarks, indicating that innovative firms in this in-dustry rely on trademarks (see also appendix 2 – 4). The findings regarding the IT-service industry are inconclusive, since the number of patents is rela-tively low and hence the mutual usage of patents and trademarks is not widely adopted. This confirms previous studies of the KIBS and shows that a new indicators are need (Gotsch and Hipp, 2012; Hipp and Grupp, 2005; Schmoch and Gauch, 2009).
Age Distribution
The next analysis examines the age of companies and its distribution in the dataset. Firstly, a classification into three different age groups was performed: 1) age group 0 – 5 2) age group 6 – 10 3) age group older than 10. Based on this classification the distribution along the age was conducted (see table 14).
Group Absolute [0 ; 5] [6 ; 10] [11 ; [ Relative [0 ; 5] [6 ; 10] [11 ; [ Trade mark Group Pharma 32 31 229 292 Pharma 1,92% 1,86% 13,74% 17,52% IT-Service 553 587 235 1.375 IT-Service 33,17% 35,21% 14,10% 82,48% 782 619 266 1.667 46,91% 37,13% 15,96% 100,00 % Con-trol Group Pharma 17 17 102 136 Pharma 3,96% 3,96% 23,78% 31,70% IT-Service 103 55 135 293 IT-Service 24,01% 12,82% 31,47% 68,30% Total 120 72 237 429 Total 27,97% 16,78% 55,24% 100,00 %
Table 14: Age distribution by industry and group
The distribution of young companies in the IT-service industry attracts atten-tion. Whereas 20% of the pharmaceutical companies in the control group are between the age of 0 and 10, in the IT-services over 80% are within this age group. In contrast young IT-service companies in the control group represent only 53% and young pharmaceutical companies 25%.
Next the distribution of trademarks within different age clusters was examined. Firstly, one notices that the number of trademarks rises with the age of com-panies and that the pharmaceutical comcom-panies are on average more than 30 years older than the IT-service companies
Year 2014 Pharmaceutical IT Services
Age Cluster Trademarks Std. Error Observations Trademarks Std. Error Observations
0 - - - 1,3 0,097353 50 1 2,7 1,085766 10 1,3 0,0683595 156 2 2,3 0,521641 7 1,5 0,1197788 162 3 5,6 3,316288 8 1,6 0,1299780 97 4 3,2 1,019804 5 3,1 1,1471090 63 5 2,0 1,000000 2 1,7 0,1733917 59 6-10 2,7 0,452917 31 2,2 0,2253122 235 10-15 4,8 1,024892 32 2,6 0,2157126 273 15-25 12,2 7,962178 58 2,8 0,2605792 200 25-50 9,9 2,715817 53 2,7 0,4182443 63 50-100 16,1 6,296452 58 2,5 0,5000000 2 >100 47,7 1,845067 27 - - - Mean Age 39,38 9,25 Skewness 2,13 -0,15 Kurtosis 7,07 1,47
Table 15: Trademark distribution by age and industry
Moreover, the age has a much lower impact on the number of trademarks of an IT-service company compared to pharmaceutical companies. While the number of trademarks rises only by 1,2 between the age cluster 1 and 50-100
for IT-service companies, in the pharmaceutical industry the number trade-marks rises by 45. This is also reflected in the skewness and kurtosis of in-dustries. The skewness of IT-services is almost zero indicating an even distri-bution in contrast to 2,13 of pharmaceuticals. Furthermore, the kurtosis is big-ger for pharmaceutical companies, showing that the distribution has more peaked than the other industry.
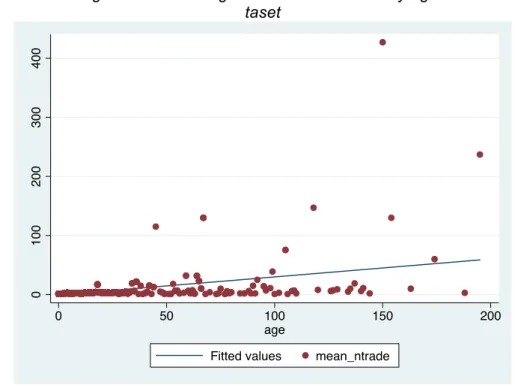
A linear regression analysis extends the insights about the relationship be-tween age and number of trademarks. For the regression the age was used as the dependent variable and number of registered trademarks (more pre-cisely the average number of trademarks by age) as the independent variable. The scatterplot combines age with the number of trademarks. The following tables and graphics outline the results of the regression analysis for the over-all dataset as well as the two industries.
Mean_ntrade Coef Std. Error P>|t| Age 0,3031460 0,0154798 0,000 Const -0,3415158 0,3991046 0,392
Number obs 1.651
R-squared 0,1887
Table 16: Linear regression of average number trademarks by age for the overall da-taset
Graphic 1: Scatter plot comparing age and number of trademarks
0 100 200 300 400 0 50 100 150 200 age
In the overall dataset each year a company ages increases the number of trademarks on average by 0,327. While the R-squared is relatively low with a value of 0,125, the age coefficient is significant at a 1% level.
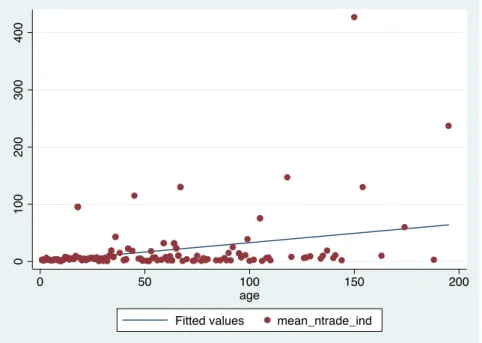
Mean_ntrade Coef Std. Error P>|t|
Age 0,3271566 0,0509051 0,000
Const 0,1630847 2,8130320 0,954
Number obs 291
R-squared 0,1250
Table 17: linear regression of number trademarks by age for pharmaceutical industry
Graphic 2: Scatterplot comparing age and number of trademarks for the pharmaceu-tical industry
The pharmaceutical industry has a slightly higher age coefficient, which again is significant at 1% level. The R-squared is even lower than the one for the overall dataset and furthermore, the scatter graph show that the outliers are mostly companies from the pharmaceutical industry.
Mean_ntrade Coef Std. Error P>|t| Age 0,0519178 0,0020743 0,000 Const 1,6725870 0,0257042 0,000
Number obs 1.360
R-squared 0,3157
Table 18: linear regression of average number trademarks by age for IT-service in-dustry 0 100 200 300 400 0 50 100 150 200 age