Untangling Buybacks
vs. Dividends in
Europe and in the U.S.
Pedro Miguel da Rocha Baptista Dias
Dissertation written under the supervision of Thomas David
Dissertation submitted in partial fulfilment of requirements for the
MSc in Finance at CLSBE, at Universidade Católica Portuguesa and for
Untangling Buybacks vs. Dividends in Europe and
in the U.S.
Pedro Miguel da Rocha Baptista Dias
152417039
Abstract:
The literature shows an increase in activity in share repurchases in the latest years in Europe and in the U.S., alongside a reappearance of dividends. This research reveals a surge in repurchases of 107% in Europe and of 55% in the U.S. for the 2001-18 period, whereas the fraction of dividends slightly increased 7 p.p. in Europe, to 91%, and 6 p.p. in the U.S., to 79%, in 2018. Although these are two forms of disbursing cash to shareholders, dividends tend to be more resilient and carry signaling power, whilst repurchases are more sporadic and their policy can vary without compromise. The focus is on ascertaining the significant drivers for repurchases and dividend payments. Hence, the main characteristics analysed are the Size, Cash Holdings, Investment Opportunities, Leverage Ratio, Profitability and Region. The majority proved to be significant across the models measuring the propensity to pay dividends and repurchase shares, and the natural logarithm of the amount of dividends and repurchases, mostly confirming the expected relationships.
Keywords: Dividends, Share Repurchases, Payout Policy, Earnings, Determinants, Regulation JEL classification: G14, G15, G28, G32, G35, G38
Desmistificando a Recompra de Ações vs. Dividendos
na Europa e nos EUA
Pedro Miguel da Rocha Baptista Dias
152417039
Sumário:
A literatura demostra um aumento na atividade de recompra de ações nos últimos anos na Europa e Estados Unidos, ao mesmo tempo que um reaparecimento de dividendos. Esta pesquisa revela um aumento da recompra de ações de 107% na Europa e 55% nos Estados Unidos entre 2001 e 2018, enquanto que os dividendos subiram ligeiramente, cerca de 7 p.p na Europa, atingindo 91%, e 6 p.p nos Estados Unidos, alcançando 79%, em 2018. Apesar estas serem duas formas de distribuir resultados aos acionistas, os dividendos tendem a ser mais resilientes e têm um maior poder de sinalização, enquanto que as recompras são mais esporádicas e a sua política pode variar sem compromisso. O objetivo é determinar indicadores que expliquem o comportamento da recompra de ações e pagamento de dividendos. Assim, as principais características analisadas são a Dimensão, Tesouraria, Oportunidades de Investimento, Rácio de dívida, Rentabilidade e Região. A maioria é significante em vários modelos medindo a propensão para pagar dividendos e recomprar ações, e o logaritmo do valor desses dividendos e recompras, a maioria confirmando a ligação esperada.
Palavras-chave: Dividendos, Recompra de ações, Política de Distribuição, Rendimentos, Determinantes, Regulação
Acknowledgements
This dissertation marks the end of a fantastic adventure. It is full of amazing and unforgettable experiences with outstanding people that make part of it and of myself. This is only achieved thanks to their constant inspiration and support.
Firstly, I would like to thank my family. For their constant support and always having my back, even though it means almost not seeing me for one week if exams and group works demand it. The first believing and showing faith in me as a student, but mostly as a person. Always working hard to provide me with everything so I have the best chances to succeed and become a better person, inspired by them and by their unconditional love.
There is no such a word to describe how grateful I am to my girlfriend, Madalena Pinheiro. The one that better understands me, capable of saying wise words when needed or just smiling and giving me a tight huge. The first person to take care of me and to push me to thrive and to go forward, never quitting or giving less than 100%. I am constantly being surprised on how much she makes me happy and creates a desire in me to be and do better. An extraordinary testimony of faith and humility. A person I admit to be lucky to have by my side.
To my brother and “co-supervisor”, Tiago Dias, which has helped and provided me with all his knowledge and experience since day one. Always there to give me a hand to push me forward and wishing for my best. It is not possible to imagine all these years without you.
To my dear friend, personal motivator and career advisor, Hanna Nikanorova. She has inspired me to work to be an example and to give my best in every situation. Especially, in never stop doing one thousand programs at the same time, extra to the studies and university life.
To my great friend, Afonso Teixeira Duarte. Always inspiring with his positive mood, smile, capability of making an effort to spend some time with me despite his constant tight schedule. Always with a motivation line ready, such as “If you can take it, you can make it”. Also, an important stone in my path of faith and personal development.
To all my friends, for always supporting me and dealing with my constant desire to be everywhere not missing any program, for the long hours of unstoppable laugh or just for falling asleep alongside them at any time of the day.
To my friends from Católica that at some time shared the Reuters room with: Henrique Carmo, Ana Costa, Cláudia Gaspar, Juliana Crisóstomo, Sofia Gomes, Peter Kleinhans, Roman Schilin and Fabian Arndt.
To the Católica Futsal team, which have been a pillar along these five years. A special word to the “Antigos”: Ricardo Brasil, Miguel Silva and Nuno Plácido. Carrega Caças!
To my close friends, which were very important over these challenging years: Manel Varão, Manel Callé Teixeira, Tomás Vila Luz, Tobias Klein, Miguel José, Miguel Botelho, Carolina Mira, Leonor Moreira Pires, Bernardo Castro, Miguel Magalhães, Diogo Martins and Miguel Ferreira. A sincere word to to Luís Gonçalves, Francisco Duarte Neves, João Garcia, João Fernandes, Pedro Mendonça, Teresa Cunha e Sá, Madalena Dantas, Inês Testa Santos, Diogo Salgueiro, Tomás Carneiro, Pedro Santos, André Aleixo, Zé Maria Duarte and Margarida Vaz. To “Madrugadores” for just being them and continually by my side: Carolina Oliveira, Catarina Silva and Carolina Simões, especially the latter for every word, kind gesture and support. To my supervisor from ESCP Europe, Thomas David, which accepted to guide me even from afar and provided me with valuable insights.
To Escola Beiral and Colégio São João de Brito, for being crucial in the foundation and development of the person I am today.
I would also like to acknowledge all other faculty members and professors, which provided an important and less visible backstage work.
MUITO OBRIGADO! GRAZIE MILLE! MERCI BEAUCOUP! Pedro da Rocha Dias
“The world tells us to seek success, power and money; God tells us to seek humility, service and love” – Pope Francis
Table of Contents
1. Introduction ... 1
2. Literature Review ... 4
3. Data & Methodology ... 8
3.1. Data Extraction ... 8
3.2. Variable creation ... 8
3.3. Empirical Analysis ... 10
3.3.1. Logit Regression Analysis ... 10
3.3.2. Log-Linear Regression Analysis ... 10
4. Time Trends ... 12
4.1. Evolution of firms according to each payout policy group ... 12
4.2. Payout Ratios ... 16 4.3. Firm Characteristics ... 20 4.3.1. Size ... 21 4.3.2. Cash Holdings ... 22 4.3.3. Investment Opportunities ... 23 4.3.4. Leverage Ratio ... 24 4.3.5. Profitability ... 25 5. Empirical Analysis ... 27
5.1. Logit Regressions on the propensity to pay dividends and buy back shares ... 27
5.1.1. Model 1 and 2: Propensity to pay dividends ... 28
5.1.2. Model 3: Propensity to pay dividends with Region as a Dummy variable ... 28
5.1.3. Model 4 and 5: Propensity to repurchase shares ... 29
5.1.4. Model 6: Propensity to pay dividends with Region as a Dummy variable ... 29
5.2. Log-Liner Regressions on the value of dividends and buybacks ... 30
5.2.1. Model 7 and 8: Amount of Dividends ... 30
5.2.3. Model 10 and 11: Amount of Repurchases ... 31
5.2.4. Model 12: Amount of Repurchases with Region as a Dummy variable ... 32
6. Conclusion, limitations and further research suggestions ... 33
7. References ... 34
List of Tables
Table 1: Logistic regressions summary results ... 27
Table 2: Logistic regressions summary results ... 30
Table A1: Compustat item number and Datastream symbol of each Variable ... 41
Table A2: Explanation of variables used ... 42
Table A3 Counts and fraction of European and A ... 43
merican firms by payout policy group for each year ... 43
Table A4: Aggregate cash distributions to shareholders ... 44
Table A5: Firm characteristics by payout policy group ... 45
List of Figures
Figure 1: Fraction of European and American firms by payout policy group for each year ... 15Figure 2: Aggregate cash distributions to shareholders ... 18
Figure 3: Payout mix of the aggregate cash distributions to shareholders ... 20
1
1. Introduction
“Do you know the only thing that gives me pleasure? It's to see my dividends coming in.” - John D. Rockefeller “When stock can be bought below a business’s value it is probably the best use of cash” – Warren Buffett Firms can distribute cash to shareholders by paying dividends or by buying back shares. According to Modigliani and Miller (1961) (hereafter: MM), rational investors do not have any predilection for any of these two forms of payout in efficient capital markets. Nevertheless, Vermaelen (1981) shows that, in inefficient capital markets, companies’ payout decisions reveal information on its future cash flows.
For the last decades, firms have been changing their behavior towards payout policies. In the U.S., dividends were disappearing in the early 2000s given a shift in the characteristics of a firm and a lower propensity to pay by the companies with the specific characteristics of a dividend payer (see Fama and French (2001), hereafter: FF, and DeAngelo and DeAngelo (2006)). On the other hand, Von Eije and Megginson (2008) found an escalating wave of popularity of Share Buybacks in Europe in the late 1990s, although U.S. firms experienced it earlier, and a decrease in the fraction of European and American firms paying dividends. In addition, although Manconi et al. (2013) reports a general increase of repurchases around the world, Skinner (2008) shows repurchases are becoming significantly more important in the U.S. while compared to dividends, which has not been verified in Europe yet.
The target of study of this dissertation is the largest firms in Europe and in the U.S. It covers the firms of the two respective indexes, the S&P 350 Europe Index (417 firms) and the S&P 500 Index (467 firms), over the 2001-18 period. The period of analysis coincides with the reappearance of dividends and increase of popularity of buybacks, chosen strategically so that the impact of the crisis and new regulations could be taken into account. The firms split into categories according to their payout policy, whether: no payout policy, dividends only, repurchases only, or both. The five main characteristics analysed are Size, Cash Holdings, Investment Opportunities, Leverage Ratio and Profitability. The research moves towards an empirical analysis on the propensity to pay dividends, to repurchase, and on the natural logarithm of the amount of dividends and repurchases.
2
To start, contrarily to the tendency found in FF, firms paying dividends in the U.S. increase from 73% in 2001 to 79% in 2018, while in Europe the jump is from 84% to 91%. Following this trend, repurchases boost 107% in Europe and 55% in the U.S. over the same timeframe. The new regulation introducing “safe harbor” provisions in 1982 in the U.S. and in 2003 in Europe are key milestones that drove this peak of repurchases. Moreover, the Bush Tax Cut in the U.S. in 2003 also pushes in favor of dividends. Then, during the crisis, the resilience of dividends is verified. Hence, in 2009, while the decrease in the number of dividend payers was small in Europe (7%) and in the U.S. (4%), the crisis affected repurchases more intensively, registering acute falls in Europe (39%) and in the U.S. (26%). In line with the literature, buybacks (59%) are the dominant form of payout in the U.S., whereas in Europe the higher fraction goes for dividend payers (76%).
Assuming a relation between both forms of distributing cash to shareholders, the fraction of firms that do both in the U.S. (71%) is higher than in Europe (55%). Dividend payers represent only 36% in Europe versus 28% in the U.S., while firms only repurchasing speak for 18% in the U.S. against the modest 3% in Europe.
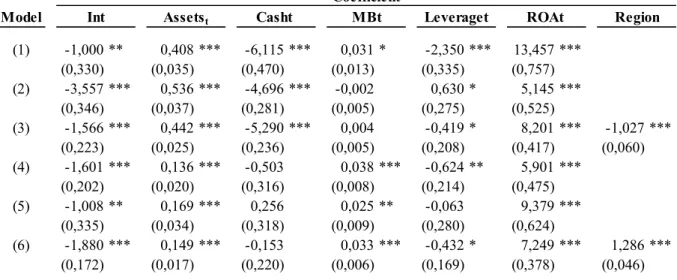
Then, as suggested by FF, the research goes towards the characteristics of firms according to each category. Starting with Size, this paper confirms FF and Andriosopoulos and Hoque (2011) findings, in which firms in both regions that pay dividends and repurchase shares are larger firms than those which do not. Moving on, a firm holding high amounts of cash is less prone to be a dividend-payer and more to repurchase shares (Von Eije and Megginson (2008)). Moreover, Investment Opportunities leads to more repurchases (Barth and Kasznik (1999)), and less dividend payments (DeAngelo et al. (2004)). This paper shows that dividend-paying firms in the U.S. are more leveraged than those in Europe, while firms that repurchase have lower debt ratios, similar for both regions. The fifth characteristic is consensual among literature and both indexes, as companies that pay dividends and engage in share repurchasing are the most profitable ones.
Lastly, in the first model, European firms confirm a positive relationship between Size, Investment Opportunities and Profitability and a negative one for Cash Holdings and Leverage Ratio with the propensity to pay dividends. Whereas in the U.S., firms show a negative relation for Investment Opportunities and a positive one for Leverage Ratio. The joint model shows a statistical significance for the index, confirming that an American firm has, on average, lower propensity to pay dividends. Regarding the propensity to repurchase shares, firms in Europe
3
and in the U.S. show a positive relation with Size, Investment Opportunities and Profitability and a negative with Cash Holdings and Leverage Ratio (same as in dividends). However, this time there is a statistically significant difference in favor of U.S. firms, which reveal higher likelihood to repurchase than European firms do. Considering the amount disbursed, there is evidence of a positive influence of all variables with the dividends paid in the U.S., while in Europe Cash Holdings and Leverage Ratio maintain its negative relation with the amount paid in dividends. Moreover, an American firm pays significantly less dividends than a European one. The findings show that only Leverage keeps a negative relationship with the amount repurchased. Finally, a firm in the U.S. significantly repurchases more shares than one in Europe.
This paper contributes to several areas of the corporate finance literature. Firstly, it contributes with current and updated results on the similarities and differences of the trends of the various payout policies embraced by the largest European and American firms in terms of market capitalization. Secondly, it describes the behavior of these firms according to the five main characteristics identified before, throughout the timeframe, obtaining expected and curious outcomes with small nuances regarding their country of origin. Thirdly, it produces significant findings on the main drivers and the influence of being a European or American firm with respect to the propensity to either pay dividends or repurchase shares as well as to the respective amount disbursed.
The remainder of this paper is structured in the following way. Section 2 presents and describes the data used in the analysis. Section 3 explores the time trends of Dividends, Share Repurchases and firms pursuing each payout policy method. Section 4 presents the findings on the regression analysis for each model. Section 5 provides a conclusion of the study. Section 6 displays the references and Section 7 the appendices.
4
2. Literature Review
MM came up with the assumption that in efficient capital markets, at the most fundamental level, rational investors do not have any preference regarding capital gains and dividends, meaning, they are perfect substitutes. As such, dividend policies should not be relevant; one can use either dividends or repurchases to pay investors the residual cash. However, the following assumptions must verify: a) no taxes; b) symmetric information among all market participants; c) complete contracting possibilities; d) no transaction or issuance costs; e) competitive product and financial markets; f) rational investors and managers. Hence, whenever markets are inefficient, by changing the payout policy the company is disclosing information about their future cash flows (supported by Bhattacharya (1979), Miller and Rock (1985) and Vermaelen (1981)).
However, MM’s results were challenged by DeAngelo and DeAngelo (2006) as they assumed a full distribution policy disbursing 100% of free cash flow, not having the possibility to retain profits. Henceforth, payout policy matters in the same logic that investment policy matters, even in smooth markets.
Accordingly, it gives place to the question on whether dividends and repurchases are substitutes. John and Williams (1985), Bernheim (1991) and Allen et al. (2000) affirm that they are not “interchangeable”. Moreover, MM, Easterbrook (1984), Miller and Rock (1985) and Grullon and Michaely (2002), by saying they are close substitutes, are opposing to DeAngelo et al. (2000) as no evidence that share repurchase programs have replaced special dividends was found, thus no proof for a substitution effect. However, Allen et al. (2000) came to strengthen it by claiming that dividends attract institutions. As they are more prone to detect any misevaluation on a company, only the undervalued companies are willing to be monitored, thus paying higher dividends.
Taxation plays an essential role on payout policy. The most intuitive assumption is that it would be theoretically disadvantageous for a firm to pay dividends as it is highly taxed and share repurchases are both tax-favored and more flexible. Notwithstanding, many firms still pay dividends as, for instance, it provides certainty about a company’s financial well-being and a variation in its distribution affects the stock price. Further, Baker and Wurgler (2004) shows prevailing investor demand mainly induces the payment of dividends. Even though Barclay and Smith (1988) assert that repurchases might be preferred over dividends, as taxation on capital gains is lower than on dividend income, Andriosopoulos and Hoque (2011) does not find any
5
evidence that this tax advantage considerably influences managers’ decision to make a buyback announcement. Likewise, differences in the taxation of dividends and capital gains only bear a second order impact on setting payout policy (Farre-Mensa et al. (2014)).
Throughout the early 2000s the fraction of dividend-paying firms decreased. According to FF and DeAngelo et al. (2006), it was due to a shift in firm characteristics and to a lower propensity to pay dividends by those firms with the typical characteristics of a dividend payer. In the U.S., the portion of public firms that pay dividends plunged from 66.5% in 1978 (and over 80% during the 1950s) to 20.8% in 1999. The proportion of European companies paying dividends constantly declines over the 1989-2005 period, whilst total amount of dividends paid surges alongside share repurchases (Von Eije and Megginson (2008)).
However, in the U.S. in late 2004, Julio and Ikenberry (2004) showed that dividends might be “reappearing”. There is a 5 p.p. rise in the share of U.S. industrial firms that pay dividends. In the paper, the author finds the 2003 Bush Tax Cut one of the most plausible explanations for this turnaround. Following this Tax Cut, Chetty and Saez (2005) and Poterba (2004) estimated a 20% increase in dividend payments in a single-country and single-event study. In theory, such dividend tax cut is supposed to increase investment, profit and dividend distributions in the long term. Brown et al. (2007) and Chetty and Saez (2010) reinforce that companies with high insider ownership are most likely to respond to tax cuts by adjusting their payout. As such, to repurchase shares rather than distributing dividends add Jolls (1998), Fenn and Liang (2001) and Hsieh and Wang (2008).
In 1982 the Securities and Exchange Commission (SEC) passed the Rule 10b-18 in the U.S., covering the manner and time of repurchase, and the prices and the volume of shares repurchased. It reduces liability, or provides “safe harbor” provisions, from market manipulation charges for U.S. companies listed on the stock exchange that choose to buy back shares of their common stock. Hence, the SEC will not consider the firm in violation of anti-fraud provisions of the Securities Exchange Act of 1934, as long as it relies within the four conditions of this rule. Following the passing of this rule, there is an increase of the number of industrial companies that performed share repurchases in the U.S and the total amount of repurchased value, which exceeded dividends in 1999/2000 (Skinner (2008), Grullon and Michaely (2004) and Grullon and Ikenberry (2000)).
Although share repurchase activity started later in the EU than in the U.S., Von Eije and Megginson (2008) reports it evolving at a faster rate, surging in popularity in the late 1990s in
6
Europe. Moreover, over the same period, the number of European firms that pay dividends decreases, while the total amount of dividends paid rises and share repurchases step up.
Furthermore, when comparing the trend of share repurchases and dividends in the U.S., Skinner (2008) realizes that the first has become as important, or even more, than the latter. Therefore, repurchases have become the dominant method of payout, leading to an excess of the total annual value of share repurchases in relation to dividends. FF and Grullon and Michaely (2002) find dividend payout ratios shrinking considerably and a boosting in share repurchases. Dealing with the disappearance of dividends, FF allocated part of the responsibility to changing firm characteristics tested by analysing the Size, Profitability and Investment Opportunities of U.S. listed firms. The climb of IPOs has oddly modified the population of publicly traded firms headed for firms that typically do not pay dividends, being small, low profit and with strong growth opportunities firms. The other part was due to the decrease in the propensity of firms to pay dividends. Maung and Mehrotra (2011) argues that the reason could be the diminished information asymmetry in the market and heightened signaling costs. Baker et al. (2015) remarks that past dividends are functioning as sharper reference points and signaling.
Vermaelen (1981), Oded (2005), Bhattacharya and Jacobsen (2015) and Massa et al. (2007) defend that open-market buybacks usually occur when they represent a benefit for long term shareholders, meaning, when the stock is undervalued. Since companies announce it with no commitment, Babenko et al. (2012) adds that its purpose might be misleading the market. Ikenberry and Vermaelen (1996) adjoins that this type of strategy takes advantage of the uninformed outside investors that own an option to buy back stock. Andriosopoulos and Hoque (2011) found, in Germany, France and in the U.S., that Size, Cash Dividends and Ownership concentration have consistently a significant impact on the announcement of repurchases. If managers properly time repurchases, share prices will increase and will protect against takeovers (Bagwell (1991), Dittmar (2000) and Thein (2013)).
Withal, the upturn of repurchases seems to be driven by the growth in stock options compensation, (Fenn and Liang (2001), Dittmar (2000) and Cuny et al. (2009)). In addition, attempts to reduce dilution caused by the exercise of stock option is also a main driver (Kahle (2002), Weisbenner (2000), Dittmar (2000), Weisbenner (1999) and Jolls (1998)). Consequently, Bens et al. (2003) explain that it results in the loss of some real investment projects whereas managers redirect funds towards repurchases. The pursuit of financial flexibility, which is affected by risk management and payout decisions (Bonaimé et al. (2014)),
7
is also a great driver for repurchases, concluded Jagannathan et al. (2000) and Brav et al. (2005), being negatively related to financial hedging within a firm.
Finally, Grossman and Hart (1982), Easterbrook (1984) and Jensen (1986) argue that the agency theory implies that returning cash to shareholders can control manager’s decisions. It lessens agency costs of free cash flow and systematic risk and rises stock prices. Grullon and Michaely (2004) defends there is a feeling of alleviation that bad managers, pressured by the board members and large investors, do not waste excess cash. Beyond, it says that when a company is at its growth phase, it tends to have positive NPV projects, higher earnings growth, CAPEX, and lower levels of free cash flow. However, for a more mature firm, Berk et al. (1999) realizes there is a shrinkage in growth opportunities, meaning less investment required (less CAPEX and R&D expenses) giving place to agency problems. Hence, current assets represent a greater function in determining firm value as payout is increased (Fenn and Liang (2001) and Grullon et al. (2002)), leading to a decrease in systematic risk. In fact, Oded (2008) shows that mature firms prefer dividends, as they have more stable earnings (Jagannathan, Stephens, and Weisbach (2000)), while growth firms, even though they are less likely to pay out cash, opt for repurchases.
8
3. Data & Methodology
3.1. Data Extraction
The analysis and comparison of the trend and drivers of dividends and share repurchases in the U.S. and in Europe focuses on the two main indexes. It comprises the largest companies by market capitalization of each region, the S&P 350 Europe Index (417 firms) and the S&P 500 Index (467 firms). They are market indexes of vast liquidity and of huge importance in the U.S, Europe and Global Economies. Besides the size, the firms of these indexes are typically globally diversified players that affect various stakeholders. Lastly, in terms of their business activities they are under close examination, and they report their activities in several different ways given they are listed with high visibility. The timeframe of the study lies between 2001 and 2018, in order to cover the Financial Crisis, introduction of new regulations and other significant developments. It subdivides into the following periods: 2001-03, 2004-06, 2007-10, 2011-14 and 2015-18. Hence, the variables for the periods are weighted averages considering the number of firms available in each year, including the joiners and excluding the leavers.
The data used to analyse the elements of the indexes was retrieved, respectively, from CRSP/Compustat Merged, provided by Wharton Research Data Services, and Datastream, provided by Eikon Reuters. Therefore, the data on each constituent contains information on the following variables of Table A1.
Then, the data has to receive some treatment and cleaning. Some industry groups are excluded to make the data collection process more feasible and to focus on a more homogeneous sample. Dittmar (2000), Fenn and Liang (2001) and FF show that financial firms (SIC Code 6,000-6,999) have different reasons to repurchase stock from nonfinancial firms, and utility firms (SIC Code 4,900-4,949) have regulations on dividends payments. Therefore, these firms are excluded from the analysis, as well as firms without industry classification (SIC Code 9,900-9,999). Only observations with non-missing values on DPS, Price, Common Dividends, Purchase of Common Stock and Total Assets and positive observations for Earnings and Market to Book ratio are considered.
To avoid extreme observation from misrepresenting the results, it is necessary to circumvent the outliers. It is then decided to winsorize the observations of the dependent and independent variables that do not lie between the 1st and the 99th percentile, as it is the most accurate method for this sample and did not change a drastic amount of observations.
9
In order to run the analysis, several variables are either retrieved or computed, which are then explained in Table A2.
Two dummy (binary) variables arise: one for the variable Dividends Per Share and another for the Repurchase of Shares, taking the value 1, if the company pays dividends/ buys back shares, and the value 0, if the firm does not pay dividends/ does not buy back shares, respectively, for each firm in each period. Thus, for each year, each firm receives three different classifications, which are according to their dividend payments, share repurchases and the combination of both. According to Dividends payments, companies are split in the following two different categories: a) Dividend Payers (DP), in case the company pays dividends in the current year in analysis; b) Non-Payers (NP), in case the company does not pay dividends in the current year in analysis, which is then subdivided in: i) Never Paid Before (NPB), in case the company has never paid dividends in the previous years; and ii) Former Payer (FP), in case the company is not paying dividends in the current year in analysis but has paid in at least one of the previous years.
Regarding Repurchases, companies are divided in the following two distinctive categories: a) Repurchase (R), if the firm repurchased shares in the current year in analysis; b) Non-
Repurchase (NR), if the firm did not repurchase shares in the current year in analysis, which is consequently subdivided in: i) Never Repurchased Before (NRB), if the firm has not repurchased shares in the previous years; and ii) Former Repurchase (FR), if the firm is not repurchasing shares in the current year in analysis but has repurchased in at least one of the previous years.
Combining the two methods of distributing cash, a deeper analysis was performed to better understand the relation between both behaviors, arising four categories: a) Dividend Payers & Repurchase (DPR); b) Non-Payer & Non-Repurchase (NPNR), further subdivided in: i) Former Payer & Former Repurchase (FPFR); ii) Never Paid Before & Never Repurchased Before (NPNRB); iii) Never Paid Before & Former Repurchase (NPBFR); and iv) Former Payer & Never Repurchased Before (FPNRB); c) Dividend Payers & Non-Repurchase (DPNR), then subdivided in: i) Dividend Payer & Never Repurchase Before (DPNRB); and Dividend Payer &Former Repurchase (DPFR); and d) Non-Payers & Repurchase (NPR), also subdivided in: i) Never Paid Before & Repurchase (NBFR); and ii) Former Payer & Repurchase (FPR).
10
Nevertheless, one drawback of this method is that firms which have distributed cash, either through dividends or share repurchases, before 2001 (Europe) and before 2000 (U.S.), can be misallocated within the categories of Non-Payers and Non-Repurchase. Still, it does not have significant impact the results obtained.
3.3. Empirical Analysis
3.3.1. Logit Regression Analysis
As a way of determining which characteristics drive the choice of payout policy of firms in Europe and in the U.S., two types of logistic regressions were run. Each regression is run for Dividends Payers and Share Repurchases, for Europe, for the U.S. and for the full sample with Region as a Dummy variable. This model (logit model), uses a logistic function to model a binary dependent variable, i.e. with two possible values. The standard logit regression investigates the dividends and share repurchases in isolation, one regression for each without considering the other as an independent variable.
a) Propensity to pay dividends for Europe (Model 1) and for the U.S. (Model 2) b) Propensity to buy back shares for Europe (Model 4) and for the U.S. (Model 5) Model with respect to a) and b):
Ln ( 𝑝
1
1 − 𝑝) = β0 + β1Size + β2Cash Holdings + β3Leverage Ratio + β4InvestmentOpportunities + β5Profitability
c) Model 3: Propensity to pay dividends, with Region as a Dummy variable d) Model 6: Propensity to buy back shares, with Region as a Dummy variable Model with respect to c) and d):
Ln ( 𝑝
1 − 𝑝) = β0 + β1Size + β2Cash Holdings + β3Leverage Ratio
+ β4InvestmentOpportunities + β5Profitability + β6Region 3.3.2. Log-Linear Regression Analysis
After analyzing the determinants of the likelihood to adopt one of the methods to distribute cash to shareholders, a Multiple Log-Linear Regression is used to study the determinants of the amount of Dividends and Share Buybacks. It takes the form of a function whose logarithm
11
equals a linear combination of the explanatory variables. The dependent variable is the natural logarithm of the amount paid as dividends or share repurchases.
a) Aggregate Amount of Dividends for European firms (Model 7) and for American firms (Model 8)
Ln(𝐷𝑖𝑣) = β0 + β1Size + β2Cash Holdings + β3Leverage Ratio + β4Profitability + β5InvestmentOpportunities
b) Aggregate Amount of Share Repurchases for Europe (Model 10) and for the U.S. (Model 11)
Ln(𝑅𝑒𝑝) = β0 + β1Size + β2Cash Holdings + β3Leverage Ratio + β4Profitability + β5InvestmentOpportunities
c) Model 9: Aggregate Amount of Dividends, with Region as a Dummy Ln(𝐷𝑖𝑣) = β0 + β1Size + β2Cash Holdings + β3Leverage Ratio + β4Profitability
+ β5InvestmentOpportunities + β6Region
a) Model 12: Aggregate Amount of Share Repurchases, with Region as a Dummy Ln(𝑅𝑒𝑝) = β0 + β1Size + β2Cash Holdings + β3Leverage Ratio + β4Profitability
12
4. Time Trends
4.1. Evolution of firms according to each payout policy group
This paper aims to investigate the progress of the distribution of cash through paying dividends or buying back shares in Europe and in the U.S., throughout the 2001-18 period. Earlier, companies were categorized in a) Dividend Payers; b) Non-Payers, subdivided into i) Never Paid Before, and ii) Former Payer, and c) Repurchase. Overall, Table A3 shows the proportion of firms belonging to the S&P 350 Europe Index paying dividends in this period increased, from 84% in 2001 to 91% in 2018. Companies under the S&P 500 Index also increased in a similar magnitude, from 73% in the beginning of the analysis to 79% in the last year. Repurchases followed the same path, registering subtler hikes in Europe of 107% and 55% in the U.S. over these years, for the same period. Although Non-Payers in the U.S. represent, approximately, 10 p.p. more in the beginning than in Europe, as payers showed an upward trend, these decreased 7 p.p. and 6 p.p., respectively, along the period.
Analysing the trend over the years (see Figure 1) it is possible to notice the slight impact of the Dotcom Crash over the period 2000-02 period. The proportion of firms paying dividends declined to 71% in the U.S. and to 82% in Europe. Repurchases behave in the same way decreasing to 24% in Europe and to 53% in America.
It is visible that buybacks have been considerably more frequent around the world during the last decade, especially from 2003 onwards. In fact, the regulation introduced in the late 1990s in several European countries has completely changed a firm’s ability to repurchase its own shares. Moreover, Sakinç (2017) shows the new regulation on buyback programs (EC Directive 2003/6/EC and EC Regulation 2273/2003), initiated by the European Commission in late 2003, aims at separating them from insider dealing and market manipulation, providing “safe harbor” provisions. Grullon and Ikenberry (2000) and Grullon and Michaely (2004) found SEC passing the Rule 10b-18 in the U.S. in 1982, also providing “safe harbor provisions” for repurchasing, to be a main driver as it is tax-favored as well as more flexible than paying dividends. Thus, it creates a legal process for buybacks allowing companies to start repurchasing their stock massively. Withal, in 2003 the SEC amended the rule to include block trades so that they stop serving the purpose of manipulating the stock market. As a result, in the 2003-08 period (year before the impact of the crisis is revealed) the percentage of firms repurchasing shares rises 142% in Europe (from 91 firms in 2003) and 68% in the U.S. (from 142 firms in 2003). Nonetheless, after this period, both share buybacks and dividends soar again. The latter is
13
reinforced by the 2003 tax cut, which lowered the individual income tax burden to 15% from a maximum rate of 35%.
Some years later, the Financial Crisis in the U.S. in the period 2007-08, which led to the European sovereign debt crisis in 2009, motivated the second lowest values for the timeframe. As such, in 2009, a modest slippery of dividend payers is verified from 88% to 82% in Europe and from 75% to 72% in America. Nonetheless, the impact in Europe is higher as dividend payers shrink 10 p.p. from 2007 (year that registered its highest). Concerning buybacks, the impact was more severe, plummeting 39% in Europe (from 67% to 41%), and 26% in the U.S. (from 84% to 62%).
In 2018, another tax bill is ruled. The three main points are the decrease in corporate tax rate from 35% to 21%, the reduction of abroad corporate income brought back from 35% to 8-15.5% and the exemption of foreign income for U.S. tax propelling repurchases. Although it is quite recent, the fraction of firms repurchasing shares increased three p.p. to 55% in Europe and to 90% in the U.S. in 2018.
Diving into the comparison between the two indexes, one can take three interesting takeaways. First, the buyback behavior of European firms is systematically reduced compared with American firms. There is more a less a constant difference of 30% of the amount of firms that repurchase shares to the total of firms in analysis. Second, there is still a consistent difference regarding dividends, of only 10%, but in the opposite way. Meaning, Europe is the one yielding higher portion of dividend payers. Third, despite the scale in repurchase activity in Europe, it was only able to narrow the difference in respect to dividend payers (from 56% to 33%). Therefore, dividends remain the dominant form of payout, as it displayed a small but steady growth, offsetting part of the growth in repurchases. In contrast, in the U.S. the path is other as it started with a difference of 15% and soon vanished, in 2005, driven by the reasons mentioned above. Thus, firms that repurchase shares (77%) surpassed firms paying dividends (76%). It keeps as the predominant form of payout until the end of the period, only experiencing a step back in 2009 but immediately recovering in the following year.
Then, to better analyse the behavior of the firms, it considers both forms of payout together, as previously mentioned. These categories also clearly suffer with the crisis and regulations. The members of the four categories of the S&P 350 Europe Index paying dividends and buying back shares decline in the 2001-02 period. It is in line with the Dotcom Crash, as all categories,
14
Dividend Payer & Repurchase (22%), Dividend Payer & Non-Repurchase (61%), Non-Payer & Repurchase (2%) and Non-Payer & Non-Repurchase (15%) get to the extreme values in 2002 of the full timeframe. As explained before, the Financial Crisis heavily damaged these values. Hence, just before that, Dividend Payers & Repurchase (61%) arrives at their highest amount, in 2008. Whilst, Payers & Repurchase (4%) in 2007 and Dividend Payers & Non-Repurchase (26%) in 2008 get to their lowest amounts. As expected, all firms except those that only repurchase go under large changes, as the proportion of firms keeps on the 6% level in the 2008-10 period, then diminishing again to 3%. Dividend Payers & Repurchase went under an arduous time, falling 42% to a level of 35%, contrasting with the increase of Non-Payers & Non-Repurchase (87%) and Dividend Payers Only (77%), driven by the collapse of repurchases. Following, it decreases until 2018, to half (6%) for firms with no payout policy, to 36% for Dividend Payers Only and to 55% for firms that disburse cash in both ways.
Regarding the S&P 500 Index, the firms follow a similar road as the tendency described above, but verifying a higher percentage for the Dividend Payers & Repurchase over the years in relation to the S&P 350 Europe Index. In 2001, the difference is 21 p.p. and, in 2018, it is 16 p.p., although verifying the lowest spread of 6% p.p. in 2008 and, approximately, 9 p.p. in 2009. As in Europe, companies that only repurchase in the U.S. do not suffer any impact through the 2008-10 period, recording a fraction of firms of 18% in 2006 and in 2018, despite minor changes in the between. Lastly, as expected, Non-Payers & Non-Repurchase firms and dividend payers only, also driven by the behavior para repurchases, suffer a jump (respectively, to 11% and 27%) in 2009, then decreasing until 2018 (respectively, to 3% and 7%).
Curiously, at the beginning of the period, buyback activity was already more important for dividend payers than non-payers both in Europe (88% versus 12%) and in the U.S. (77% versus 23%). However, in 2018, it became even more clear and solid, especially for the firms belonging to the S&P 350 Europe. Consequently, the difference on repurchases between firms that distribute cash by paying dividends and by firms that do not pursue this form of payout expanded in both regions, in Europe is currently 95% vs 5%, while in the U.S. it increased to 79% versus 21%.
15
Figure 1 presents the counts and fraction of firms in Europe and in the U.S. in each category over the 2001-18 period. The sample includes S&P 350 Europe and S&P 500 firms. Utilities (SIC Code 4900-4949), Financial Services (SIC Code 6000-6999) and Non Classifiable (SIC Code 9900-9999) firms are excluded. Panel A and C: Dividend Payers paid dividends in year t; Non-Payers did not. Repurchase are firms that repurchased shares in year t. Panel B and D: Dividend Payers & Repurchase engaged in both forms of payout in year t. Dividend Payers Only and Repurchase Only firms just paid dividends and repurchased, respectively, in year t. Non-Payers & Non-Repurchase did not distribute cash to shareholders in year t. Panel A and B contain European firms. Panel C and D contain A.
Panel A: Fraction of European Firms (unrelated) Panel B: Fraction of European Firms (related)
Panel C: Fraction of American Firms (unrelated) Panel D: Fraction of American Firms (related)
16 4.2. Payout Ratios
Following the analysis on the trend of firms paying dividend and firms repurchasing shares, the focus is now on payout ratios using the absolute values of the aggregate sample of the representatives of both indexes.
Underlying Jagannathan et al. (2000), firms tend to use permanent earnings for the dividend payout while unexpected earnings to fund share repurchases, suggesting that buybacks are complements to dividends. Bhargava (2010) shows a positive and significant relationship between earnings and dividends per share. For companies that only repurchase, earnings might explain it in a similar way as Lintner (1956) does with the relationship between dividends and earnings.
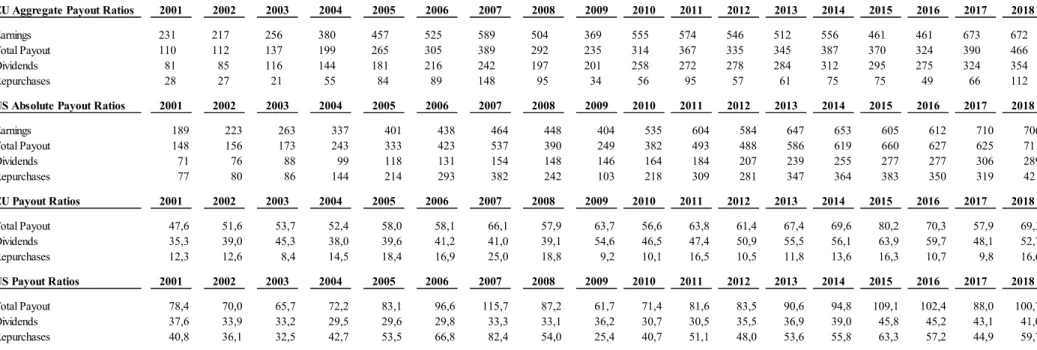
By examining Figure 2, it is possible to realize a tremendous growth over the 2001-18 period on absolute aggregate earnings. As such, in the S&P Europe 350 Index firms grew 191%, or at a CAGR (Constant Annual Growth Rate) of 6% (from $231Tn in 2001 to $672Tn in 2018) and in the S&P 500 Index firms it jumped 274%, at a CAGR of 8% (from $189Tn in 2001 to $706Tn in 2018). The dividends and repurchases behaved accordingly by also drastically increasing throughout the same timeframe. The CAGRs are 9% and 8%, for Europe, and in the U.S. are 9% and 11%, respectively. Thereupon, it results in a total payout ratio in 2018 of 69% in Europe (48% in 2001) and of 101% in the U.S. (78% in 2001). The impressive riding of cash returned to shareholders over this period being higher than the growth in earnings explains this intense growth.
In spite of this general positive trail, Table A4 shows the course has not always been smooth; the companies have been through some oscillations, reflected in the evolution of the payout ratios. As such, the harsh drop on repurchases in both Europe and U.S., arisen by the strong halt marked by the Financial Crisis, is evident on the contraction of the repurchase payout ratio, which is contrasted with the increment of the dividend payout ratio. In the 2007-09 period, the repurchases diminished 64% in Europe (from $148Tn in 2007 to $34Tn in 2009) and 58% in the U.S. (from $382Tn in 2007 to $103Tn in 2009). It causes the repurchase payout ratio in Europe to suffer a downturn of 64% (from 25% in 2007 to 9% in 2009), as well as in the U.S. of 69%, (from 82% in 2007 to 25% in 2009).
The dividends of American firms decrease at a similar and proportional pace as its Earnings, though enough to keep the dividend payout ratio at the same level (goes only from 33% to 36%). Yet, after dividends have reach its second low in 2008 of 39% in Europe, a tiny raise in
17
the aggregate value of dividends of $4Tn contrasting to a bulky deterioration on Earnings of $135Tn gives place to a dividend payout ratio of 55%.
Actually, dividends are the main tool of distributing cash to shareholders with firms adopting a more solid payout policy. During a crisis, companies would rather cut on share buybacks than on dividends, thus the last proving to be more resilient in such a hard time. Then, it is coherent and conforming with the signaling power inherent in dividends, of committing future free cash flows. More concretely, a dividend increase announcement by a company is a clear indication of positive future performance, while a decrease in dividend payout tend to portend negative future prospects. Hence, managers are utterly averse to cut dividends, only doing so in a last case scenario.
Interestingly, by taking a close look at the payout mix on Figure 3, it is possible to have a clear view on the aforementioned. The change in the payout ratios in the U.S. corresponded to a turnaround in payout mixes. After American firms paying out 29% as dividends and 71% as buying back shares in 2007, in 2009 it inverted to 59% by paying dividends versus 41% by doing repurchases, a more balanced distribution. Whereas in Europe it just widened more as dividends, which go from 62% in 2007 to 86% in 2009, were already the main choice of payout, being 2009 the year where the maximum was registered. Soon after 2009, the overall trend continued, meaning, started reverting the impact of the happenings occurred until 2009. The recovering of all variables in both regions, with a special focus for the repurchases that had the best improvement in relative terms, reveals this reversal. For instance, it grew 66% in Europe while it more than doubled in the U.S., landing in $218Tn in 2010 from $103Tn, marking the beginning of a new increasing tendency.
Regardless of the recoil in the 2009, the surge in earnings also boosted in dividends and repurchases in the elements of the indexes, originating historical ceilings and high values. Along these lines, in 2018, total absolute payout is $466Tn in Europe (CAGR of 9%) and $711Tn in the U.S. (CAGR of 10%). Then repurchases in Europe total $112Tn (growth of 70% compared to 2017), representing 24% of the total payout, and in the U.S. total $421Tn (smaller growth in relative terms, of 11%, compared to 2017), which symbolize 59% of the total payout. The dividends represent the remnant, 76% ($354Tn) in Europe and 41% ($289Tn) in the U.S. in the last period.
In order to understand more clearly the differences in behavior of the largest firms based on market capitalization in Europe compared to the ones in the U.S., one can dive into the payout
18
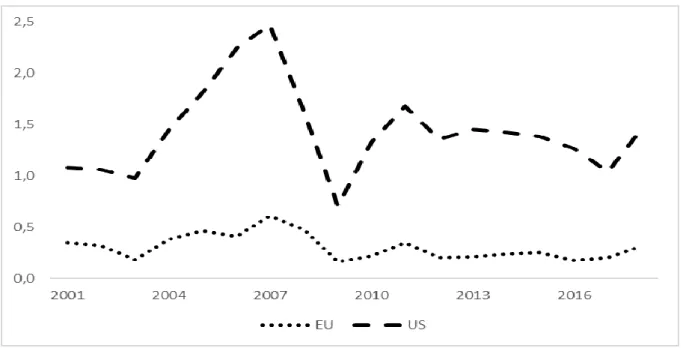
mixes along the years. In Europe the gap has always been broad, showing a predominance for dividends (even with an evident arising of repurchases, taking longer to become the predominant choice), with similar values at the starting point of 75% and finishing point of 25%. For repurchases in the U.S., an opposite movement emerges. In fact, preference for dividends and repurchases has always been side to side, experiencing some brief changes, but mainly the latter has been the preferred one. Only twice, in 2003 with 49% of the total payout, rapidly increased until 2007, and in 2009 with 41% out of the total payout ratio, the path was different. Then, after 2010, it remained at stable levels, ending the period in study at 59%. Interestingly, based on Figure 4, repurchases were strengthening in the U.S. compared to dividends, as increasingly cash was being used for buying back shares per unit of dividends. Whilst in Europe this amount was much lower and only slightly increasing. Then, the trend was reverted by the impact of the Financial Crisis. As previously seen, the use and aggregate amount of share repurchases lessens remarkably compared to dividends, which had somewhat decreased as well, in the 2007-09 period.
Figure 2 reports annual information on aggregate cash distributions to shareholders and respective payout ratios for a sample of European and American firms. Panel A represents the European aggregate payout ratio. Panel B represents the American aggregate payout ratio. Panel C represents the European absolute aggregate payout ratio. Panel D represents the American absolute aggregate payout ratio. The data consist of all firm-year observations
Panel A: European Firms Aggregate payout ratio Panel B: American Firms Aggregate payout ratio
Panel C: European Absolute Aggregate Payout Ratio Panel D: American Absolute Aggregate Payout Ratio
19
on Compustat and Datastream over the 2001-18 period, which contain information on the following variables: Repurchases, Dividends and Earnings. Repurchase is the expenditure on the purchase of common and preferred stocks minus any reduction in the value (redemption value) of the net number of preferred shares outstanding. Dividend is the total dollar amount of dividends declared on the common stock. Earnings is the earnings before extraordinary items. 0% 20% 40% 60% 80% 100% 2001 2004 2007 2010 2013 2016 Dividends/Total Payout Repurchases/Total Payout
Panel A: Payout Mix of European Firms
0% 20% 40% 60% 80% 100% 2001 2004 2007 2010 2013 2016 Dividends/Total Payout Repurchases/Total Payout
20
Figure 3 reports the aggregate payout mix for European and American firms. Panel A represents payout mix for Figure 3 reports the payout mix of the aggregate distribution of cash to shareholders. Panel A represents the payout mix of European firms. Panel B represents the payout mix of American firms. The data consist of all firm-year observations on Compustat and Datastream over the 2001-18 period, which contain information on the following variables: Repurchases and Dividends. Repurchase is the expenditure on the purchase of common and preferred stocks minus any reduction in the value (redemption value) of the net number of preferred shares outstanding. Dividend is the total dollar amount of dividends declared on the common stock.
Figure 4 reports the annual amount spent on a share buyback per unit of dividend for a sample of firms in Europe and in the U.S. The data consist of all firm-year observations on Compustat and Datastream over the 2001-18 period, which contain information on the following variables: Repurchases, Dividends. Repurchase is the expenditure on the purchase of common and preferred stocks minus any reduction in the value (redemption value) of the net number of preferred shares outstanding. Dividend is the total dollar amount of dividends declared on the common stock.
4.3. Firm Characteristics
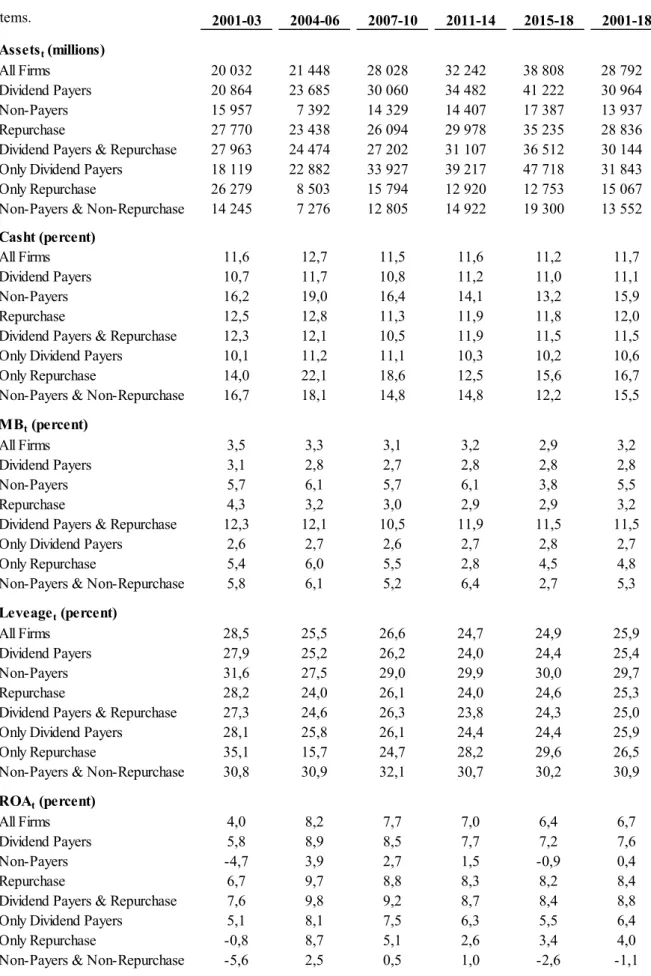
As stated in Data & Methodology, this paper studies the characteristics of the firms in both indexes, according to each payout policy, in the timeframe in analysis (2001-18). Table A5 reports the five characteristics of the sample firms, which are Size, Cash Holdings, Investment Opportunities, Leverage Ratio and Profitability. It reveals various fascinating facts and conclusions on the relation between firm characteristics and the payout policy adopted, according to each index.
Figure 4: Annual amount spent on a share repurchases per unit of dividend
Figure 3: Aggregate cash distributions to shareholders
21 4.3.1. Size
The best proxy for Size is Total Assets. It is a measure of the extent of information asymmetry (Raju L Hyderabad (2013)). In fact, a small firm is under less coverage by analysts and media and tight provisions of the regulators and the accounting standards govern less. It then leads to more information asymmetry than large firms, supported by Vermaelen (1981) and Mitchell (2007). In addition, Aivazian and Booth (2003) says it is a proxy for financial market access of the firm. Larger companies tend to have better market access and more funds available, so they should be capable of paying higher dividends. Indeed, FF shows that dividend payers are more prone to be proportionally bigger than non-payers are. Consequently, it is expected a positive relation between size and dividend payments. Alok Bhargava (2010). Leeuw (2016), Dittmar (2000), Grullon and Michaely (2002), Ikenberry et al. (1995), and Dimitris Andriosopoulos and Hafiz Hoque (2011) confirm these findings. The latter validates it and adds that larger and more mature firms are more likely to repurchase. For that reason, firm size positively relates with repurchases, but in a smaller dimension.
As expected, dividend-paying firms are larger than firms that buy back shares. For example, for European companies that pay dividends and repurchase shares, the average total assets is $30,144M, whereas in the U.S. it is, $30,652M. For firms in Europe that only pay dividends, the average total assets of $31,843Bn is greater than in the U.S., which has $26,952M in average total assets. For firms without payout policy, in Europe ($13,552M) they are much smaller than in the U.S. ($5,589M). The ones that only repurchase are much larger in Total Assets in Europe ($15,067M) than in the U.S. ($13,194M).
Firms in Europe paying dividends (Total Assets of $30,964M) are, approximately, more than twice the size as those not including dividends in their payout policy (Total Assets of $13,937M), while those repurchasing are similar in size ($28,836M). In the U.S. it is possible to infer the same relationship, as firms redistributing cash in dividends (Total Assets of $29,923M) are almost the double in size compared to the ones not paying at all (Total Assets of $15,178M), while companies repurchasing represent $26,730M in Total Assets.
Although the substantial increase on average total assets in Europe and in the U.S. is transversal across all types of payout policies, firms that only buy back shares in Europe experience a decrease in size. Additionally, during the Financial Crisis, the size of firms paying dividends and firms repurchasing intensifies in general, exceptionally in American firms. The results then infer the proposed by the literature, that dividend-paying firms and firms that buy back shares,
22
both in Europe and in the U.S., tend to be larger than ones that do not engage in these types of cash distribution to shareholders. In addition, firms only repurchasing are half the size as those only paying dividends.
4.3.2. Cash Holdings
Then, another variable that plays an important role in defining the payout policy is Cash Holdings. Following Jensen’s free cash-flow hypothesis, positive free cash flow pressures management to enlarge payouts to shareholders. If management fails to do so and prefers to use free cash flow on negative net present value projects, it predicts a decline on firm value. Thence, conflicts of interest between shareholders and management are quite severe and might induce the company to distribute cash to shareholders to reduce them. Von Eije and Megginson (2008) reports that the propensity to repurchase increases with large cash holdings, implying a positive correlation between cash and repurchases. Yet, it reduces the propensity of paying cash dividends although it increases the amount paid for a cash dividend payer.
The average Cash Holdings in firms in Europe that only pay dividends is 10.6%, increasing to 11.5% for the ones that engage in repurchases, giving already the hint on a positive relationship between holding cash and buying back shares. The expected negative relationship of cash holdings with dividends is also present in Europe, as firms not applying any payout policy hold 15.5% of cash and firms only repurchasing carry 16.7% of cash. Firms in the U.S. provide strength to this argument as the difference is even ampler. As such, dividend-paying firms that repurchase shares hold, on average, 11.5% of cash. As seen before, if one excludes the ones not repurchasing, this value drops to 8.4%. In contrast, showing the vehemence of dividends, firms that do not pay dividends nor buy shares back tend to maintain 19.6% cash, whereas a firm only does share repurchases, on average, carry 21.2% of cash. More broadly, European firms that repurchase shares, 12.0%, and firms that do not pay dividends, 15.9%, hold less cash, on average, than the American ones, 13.4% for firms that buy back shares and 20.7% for non-payers. On the other hand, dividend-payers tend to possess the same amount regardless the region (more a less 11%).
As a final note, S&P 350 Europe index constituents’ cash holdings decreased for non-payers (from 16.2% to 13.2%, although registering a jump in the period preceding the Financial Crisis, 2004-09, getting to 19.0%) and for repurchase only firms (from 12.5% to 11.8%). The path of dividend-payers is quite stable (only suffering minor fluctuations), increasing 3 p.p. from 2001 to 2018. On the other side, S&P 500 Index’s firms behaved according in respect to firms doing
23
buybacks, in which the respective cash holdings started as 11.7% and finished as 13.3%, the opposite tendency compared to Europe. Non-payers also lessen their cash holdings from 19.7% to 18.8%, even though in the 2011-14 period they reached 21.9%, period in which dividend-payers had the highest jump (from 7.4% to 11.7%). This way, the results allow to surmise the anticipated relationship of cash holdings with payout policy. A firm that repurchases tends to hold slightly more cash, in contrast to a firm that pays dividends. This confirms on the striking difference in Cash Holdings that a firm only repurchasing has compared to one only paying dividends, in both indexes.
4.3.3. Investment Opportunities
Investment Opportunities, with Market to Book Ratio as a proxy, is a good indicator to capture a firm’s under or overvaluation (Ikenberry et al. (1995) and Dechow et al. (1999)). As such, Ikenberry et al. (2002) reports that a firm buy back more shares when it is undervalued rather than overvalued. From Barth and Kasznik (1999) it is expected a lower Market-to-Book Ratio to indicate lower intangibles, as they are not identified as accounting assets, but are returned in market value of equity. Hence, it implies a negatively relationship between Market-to-Book Ratio and the propensity to repurchase shares. In the case of an undervalued firm, the management pays less for the shares than its belief on how much they are worth. Contrarily, a lower Market-to-Book Ratio indicates more undervaluation as market value is lower relative to book value. Furthermore, according to the pecking order theory, a firm rather finance itself with first internally, with retained earnings. If not available, then opt for debt. Only in a last case scenario a firm should finance itself through the issue of equity. Therefore, companies with higher investment opportunities are more likely to hold more cash. DeAngelo et al. (2004) says low investment opportunities, on average, lead to the payment of dividends and Alok Bhargava (2010) agrees, stating that investments have a positive and significant relationship with dividends per share. Whereas Aivazian and Booth (2003) joints that more growth opportunities should mean lower dividend payments.
As foreseen, both S&P 350 Europe Index and S&P 500 Index firms are in line with the literature on this variable just referred above. In fact, non-payers reveal to have, on average, the highest investment opportunities in Europe, 5.5%, and in the U.S., 6.6%. In opposition, dividend-payers are the firms that have less investment opportunities, 2.8% in Europe and 3.0% in the U.S. Repurchases are on the midfield, given that they have a positive relationship with investment opportunities in Europe (3.2%) and in the U.S (3.8%).
24
However, by combining both forms of payout, it is possible to take some other conclusions. The highest investment opportunities belong to firms that engage in both forms of payout in Europe (11.5%) and in the U.S. (11.5%). In Europe, firms initially have 12.3% of investment opportunities and, in 2018, it declines to 11.5%, registering a more intense decrease to 10.5% during the Financial Crisis. In the U.S. there is surge to 24.4% in the 2015-18 period (from 8.1% in the 2001-03 period). The group with lowest investment opportunities is the one with firms paying dividends but not doing share buybacks in Europe (2.7%) and in the U.S. (2.6%). Nonetheless, firms with no payout policy went in the opposite route over the timeframe in Europe (5.8% to 2.7%) compared to the U.S. (5.7% to 13.5%). Companies that only buy back shares had their investment opportunities slipping in Europe (from 5.4% to 4.5%) and in the U.S. (from 6.6% to 6.3%), where it is constantly greater than in Europe. As expected, firms of both indexes that have high investment opportunities pay less dividends and do more repurchases.
4.3.4. Leverage Ratio
Furthermore, Leverage Ratio is also a variable of importance to be analysed regarding payout policy. Von Eije and Megginson (2008) shows high-leveraged firms are less likely to pay dividends and Aivazian and Booth (2003) adds that they make lower dividend payments, inferring that financial constraints influence dividend policy. Regarding repurchases, Bagwell and Shoven (1988) suggests large levels of debt increase its likelihood. Kahle (2002) concludes that it prompt in lower repurchases, while Hovakimian et al. (2001) accordingly displays that lower ratios increase the propensity to buy back shares. Bagwell and Shoven (1988) and Hovakimian et al. (2001) argue firms buying back shares reveals the management’s preference to use debt instead of equity to reach the right Leverage Ratio. Hence, Mitchell and Dharmawan (2007) and Dittmar (2000) propose that below target debt ratios increases the likelihood to repurchase shares and Jagannathan and Stephens (2003) that repurchasing shares more frequently represents lower debt ratios for those firms.
Supporting the literature, S&P 350 Europe Index dividend-paying firms hold, on average, a Leverage Ratio of 25.4%, having decreased from 27.9% to 24.4% along with an increase in dividends. However, in the U.S. the trend revealed the opposite, going from 27.0% to 32.1%, resulting in an average of 26.8%. Moreover, a decrease in the firms in the category of repurchases in Europe, from 28.2% to 24.6% (average over the years of 25.3%) contrasts with the large increase in the U.S., from 23.9% to 31%, reaching an average over the timeframe of
25
25.3% as well. Additionally, non-dividend payers also behaved in opposite ways, as the leverage ratio of those in Europe is, on average, 29.7% (from 31.6% in the first period to 30.0% in the last one), while in the U.S. it surged from 23.9% to 31.0%, arriving to an average of 25.3% for all periods.
Nonetheless, the joint payout policies allow enriching this interpretation. In Europe, the highest leverage ratios (30.9%) are on firms that do not have a payout policy. It remained around the same values along the periods, from 30.8% in the first period to 30.2% in the last one, slightly increasing to 32.1% during the Financial Crisis. It diverges with the U.S. firms with a ratio of 24.4%, which demonstrated an acute increase over the years, from 23.6% to 28.1%. Whereas in the latter the payout group with higher Leverage Ratio is the dividend payers only with a ratio of 27.9%, which recorded a sharp increase from 28.8% in the 2001-03 period to 34.6% in 2015-18 period. However, it opposes to Europe, which has 25.9%, resulting of a decline to 24.4% from 28.1%. Two other downturns in Europe took place in the firms that repurchase, of non-payers, from 28.1% in the 2001-03 period to 24.4% in the last period, and of payers, from 27.3% to 24.3%. In the U.S., firms that only repurchase increased their Leverage Ratio to 27.8%, from 17.6% in the beginning, and payers that repurchase reached 31.8% in the 2015-18 period (having started with 25.7% in the first period). Interestingly, firms paying dividends in the U.S. have higher levels of debt in comparison with the ones in Europe, which show a negative relationship. Regarding repurchases the relationship is the same, meaning a firm with good levels of debt tend to repurchase.
4.3.5. Profitability
Profitability is measured by the Return on Assets (ROA). In consonance with Jensen’s free cash-flow hypothesis, the firms with higher likelihood to distribute cash to shareholders are the less profitable ones as they have less investment opportunities. However, Lee and Suh (2011) reports significant and positive effects of profitability on the amount of repurchases realized by dividend-paying firms. Withal, Von Eije and Megginson (2008) realizes that the likelihood of European firms to repurchase is explained by profitability, whereas DeAngelo et al. (2004) states that high profitable firms are more likely to pay dividends, while low profitable ones are not paying dividends.
In keeping with the hypothesis above described, of a positive relationship between profitability and paying dividends and buying back shares, the sample in analysis comes to confirm it. Firms in all categories with some kind of payout policy increased its profitability over the years in
26
both regions. However, for firms that only pay dividends in the U.S., profitability falls to 0.5% in the last period from 3.4% in the first (recording an average of 3.7%). In Europe, this value is 6.4%, although it starts with 5.1% and finished with 5.5% (in the between a high profitability is verified in the 2004-06 period of 8.1%, and 7.5% in the 2007-10 period). Then, companies redistributing cash in both ways show an increase of profitability in both regions relative to other firms. The profitability of European firms goes from 7.6% to 8.4%. The average of the full period is 8.8%, given the high profitability in the 2004-6 period, with 9.8%, and in the 2007-10 period, with 9.2%. In the U.S., it starts with 5.0% for repurchase only and 7.0% for both and finished with 8.2% and 7.7%, respectively (ending up with, on average, 8.2% and 8.0%). Regarding firms with no payout policy, over the years in both regions it increases, reaching a negative profitability of -1.1% in Europe and a positive one in the U.S. firms of 1.1%.
In consonance with it, the category showing higher profitability is firms that repurchase in Europe (on average 8.4%, an increase from 6.7% to 8.2%) and in the U.S. (on average 8.0%, reached 7.8% in the final period, from 6.5% in the first). At the same time, dividend payers go under a similar path at a similar pace, in which firms in Europe arrived at 7.6% and firms in the U.S. reach 7.1%, on average. Overall, the positive relationship between profitability and dividends and buybacks holds for both regions. However, while in Europe firms only paying dividends are, on average, 60% more profitable than those only repurchasing, in the U.S. they tend to be 50% less profitable.