Universidade de Aveiro 2016
Departamento de Química
Patrícia Jorge Marques
Quaresma
Preservação de leite com chocolate por
armazenamento
hiperbárico,
uma
nova
Universidade de Aveiro 2016
Departamento de Química
Patrícia Jorge Marques
Quaresma
Preservação de leite com chocolate por
armazenamento
hiperbárico,
uma
nova
tecnologia de preservação amiga do ambiente
Chocolate milk preservation by hyperbaric
storage, a new and environmentally friendlier
preservation technology
Tese apresentada à Universidade de Aveiro para cumprimento dos requisitos necessários à obtenção do grau de Mestre em Biotecnologia alimentar, realizada sob a orientação científica do Doutor Jorge Manuel Alexandre Saraiva, Investigador Auxiliar do Departamento de Química da Universidade de Aveiro
Dedico este trabalho aos meus pais e ao meu irmão por sempre acreditarem em mim e sempre tornarem possíveis os meus sonhos.
o júri
Presidente Prof. Doutora Ana Maria Rebelo Barreto Xavier
Professor Auxiliar do Departamento de Química da Universidade de Aveiro
Vogais Doutor Jorge Manuel Alexandre Saraiva
Investigador Auxiliar do Departamento de Química da Universidade de Aveiro
Doutora Elisabete Maria da Cruz Alexandre
Bolseira Pós-Doutoramento da Escola Superior de Biotecnologia da Universidade Católica Portuguesa
Agradecimentos Em primeiro lugar agradeço ao professor Jorge Saraiva por toda a ajuda, apoio, conhecimentos transmitidos e por estar sempre disponível a qualquer hora.
A todas as pessoas do laboratório pela ajuda, partilha de conhecimento e convívio durante longos dias. Em especial queria agradecer ao Mauro por toda a paciência e ajuda durante esta tese bem como à Maria João, Rita e Sofia por tornarem todos os dias mais divertidos e mais instrutivos. Ao Luís e ao Álvaro pelo companheirismo durante a tese e em particular à Catarina que se tornou uma amiga ao longo deste ano. Aos meus amigos de infância Ana, João Carlos, Andreia e Maria João por estarem sempre presentes, mesmo longe. À Ia em especial por ter sido o meu pilar neste ultimo ano e nos últimos 23 anos da minha vida. Às minhas colegas de casa (Joana e Rita) por todas as noitadas de estudo e por todo o bom tempo passado. Ao foge ao fígado (em especial ao Vasco, Duda, Kika, Gui e Luís), à Sónia, Dinha e aos meus pedacinhos de terra por estes anos de amizade, entreajuda e risadas. Ao Nuno por sempre me transmitir tranquilidade, ao David por sempre me mostrar o lado positivo e sempre fazer-me rir e ao Rainho que, apesar de tudo, sempre foi um amigo incondicional. Às minhas amigas do coração Cris e a Teresa por sempre estarem presentes e por nunca terem desistido de mim fazendo-me sempre mais forte.
Por fim à minha tia e ao meu irmão por sempre acreditarem em mim e sempre ajudarem a ver o outro lado da vida. Ao meu avô e avó por sempre estarem presentes enquanto puderam. E por fim aos meus pais que sempre me deram oportunidade de estudar, sonhar,e conhecer outro mundo para lá da academia e de Portugal.
Palavras-chave Armazenamento hiperbárico, Leite com chocolate, Avaliação microbiológica, Avaliação físico-química, Conservação de alimentos.
Resumo O principal objetivo deste trabalho centrou-se no estudodo efeito do armazenamento hiperbárico (AH) à temperatura ambiente, em leite achocolatado, de modo a evitar a sua deterioração a nível microbiológico e físico-químico, tentando assim aumentar o prazo de validade do produto comparativamente ao método de armazenamento mais tradicional, a refrigeração.
O AH foi estudado e comparado com o armazenamento refrigerado e armazenamento à temperatura ambiente (0.1 MPa). Assim, diferentes temperaturas (4 e15-25 °C) e níveis de pressão (0.1, 30, 50 e 100 MPa) foram utilizados durante um período de 30 dias. Algumas amostras foram inoculadas com Listeria innocua e Escherichia coli de forma a aferir o efeito do AH para nestes microrganismos.Um segundoestudo foi também realizado com amostras embaladas de duas diferentes formas, com ar e sem ar no seu interior, numa tentativa de concluirsobre possíveis diferenças a nível microbiológico e físico-químicopotenciadas pela presença de ar na embalagem quando armazenadas sob pressão.Em ambos estudos realizaram-se análises microbiológicas (mesófilos totais, Enterobacteriaceae, coliformes epsicrófilos) e físico-químicas (pH, Aw, cor e conteúdo em lactose e açúcares redutores), para além
de visualização do produto emmicroscopia eletrónica.
Foram obtidosmelhores resultados no AH comparativamente à refrigeração, ocorrendo inibição de crescimento microbiano a 50 MPa e inativação de microrganismos a 100 MPa, sendo os mesofilos totais e os psicrófilos os microrganismos menos suscetíveis à pressão. No que respeita a parâmetros físico-químicos, o AHrevelou resultados semelhantes ou até melhores que a refrigeração. Assim, o AHà temperatura ambiente demonstrou ser uma possível alternativa à refrigeração para leite achocolatado, sendo esta uma metodologia amiga do ambiente uma vez que só é necessária energia na fase de compressão e descompressão, não sendo requerida para controlo de temperatura.
Keywords Hyperbaric storage, chocolate milk, microbiological evaluation, physicochemical evaluation, food preservation.
Abstract The main goal of this work was to study the effect of hyperbaric storage (HS) at room temperature (RT)in a chocolate milk beverage, in order to avoid its deterioration at the microbiological and physicochemical level, trying at the same time to increase its shelf life without refrigeration.
HS was studied and compared with refrigeration (RF) and RT storage (0.1 MPa). The chocolate milk was stored at different temperatures (4 and 15-25 ºC) and pressure levels (0.1,30,50,100 MPa) over 30 days. Some samples were inoculated with Listeria innocua and Escherichia coli in order to study the HS effect on those microorganisms.
In addition, a second study was carried out with samples packed with and without air to observe possible microbiological and physicochemical differences empowered by the presence of air. For both studies,microbiological (total aerobic mesophiles, Enterobacteriaceae, coliforms, psychrophiles), physicochemical (pH, Aw, colour, lactose and reducing sugars content) and
SEM analyses were performed.
HSallowed to obtain better results than RF, with a microbial growth inhibition at 50 MPa and a microbial inactivation at 100 MPa. The total aerobic mesophiles and psychrophileswere the microorganisms less susceptible to pressure. Regarding the physicochemical parameters analysed, HS showed similar or even better results than RF.
Therefore, food storage under pressure (HS) at RT, demonstrated to be a possible alternative to RF for chocolate milk, being this preservation methodology environmentally friendly, since energy is only required during compression/decompression phases, not being needed for temperature control.
INDEX
I. Figures Index ... I II. Tables Index ... V III. List of abbreviations ... VI
1. INTRODUCTION ... 1
1.1 Overview ... 2
1.2 High pressure application on food ... 2
1.2.1 HPP history ... 3
1.2.2 HPP process description and equipment ... 3
1.2.3 HPP impact on microorganisms ... 4
1.3 Hyperbaric storage ... 6
1.3.1 Hyperbaric storage at sub-zero temperatures ... 7
1.3.2 Hyperbaric storage at refrigeration temperatures ... 8
1.3.3 Hyperbaric storage at room temperature ... 10
1.4 Milk ... 17
1.4.1 Milk proteins ... 18
1.4.2 Milk lipids ... 20
1.4.3 Milk vitamins and minerals ... 21
1.4.4 Lactose ... 23
1.5 Health benefits... 23
1.6 Chocolate milk ... 24
1.7 Milk deterioration and food safety ... 25
1.7.1 Food safety in milk ... 25
1.7.2 Milk deterioration ... 26
1.8 UHT milk production process and other processing technologies ... 26
1.8.1 Pasteurisation ... 29
1.8.2 Ultra-high temperature (UHT) ... 30
2. OBJECTIVES ... 31
3. MATERIALS AND METHODS ... 33
3.1 Chemicals ... 34
3.2 Preparation of sample ... 34
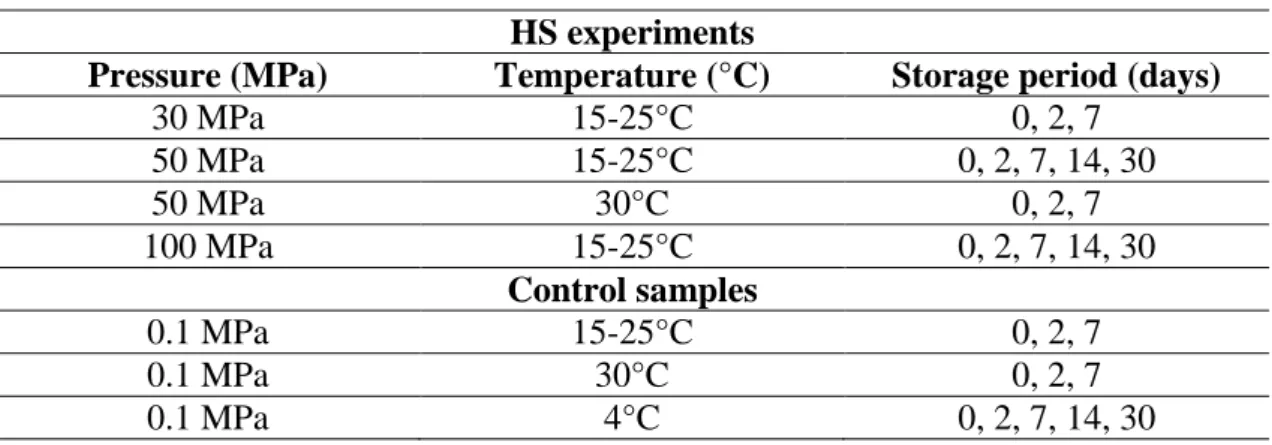
3.3 HS experiments ... 34
3.4 Microbial analyses... 35
3.4.1 Sample preparation and dilution ... 35
3.5 Physicochemical analyses ... 36
3.5.1 Water activity (Aw) determination ... 36
3.5.2 pH determination ... 36
3.5.3 Sample clarification ... 36
3.5.4 Reducing sugars ... 37
3.5.5 Lactose & D-Galactose concentration ... 37
3.5.6 Colour analysis ... 38
3.5.7 Scanning electron microscopy... 38
3.6 Statistical analyses... 39
4. RESULTS AND DISCUSSION ... 40
4.1 Microbial analyses... 41
4.1.1 Effect of hyperbaric storage on total aerobic mesophiles ... 41
4.1.2 Effect of hyperbaric storage on Enterobacteriaceae ... 43
4.1.3 Effect of hyperbaric storage on coliforms ... 45
4.1.4 Effect of hyperbaric storage in psychrophiles ... 47
4.1.5 Effect of hyperbaric storage in E.coli ... 49
4.1.6 Effect of hyperbaric storage in L. innocua ... 50
4.1.7 Microbial analyses – overview ... 51
4.2 Physicochemical analysis ... 52 4.2.1 Water activity ... 52 4.2.2 pH ... 53 4.2.3 Colour ... 55 4.2.4 Reducing sugars ... 60 4.2.5 Lactose ... 61 4.2.6 SEM ... 62
5. CONCLUSION AND FUTURE WORK ... 64
6. BIBLIOGRAPHY ... 66
APPENDIX ... 76
APPENDIX A: Standards preparation and calibration curve construction for the determination of reducing sugars content in chocolate milk ... 77
APPENDIX B: Calibration curve of galactose to determine concentration of lactose in chocolate milk ... 78
APPENDIX C: TAM and ENT counts in chocolate milk after increasing the microbial loads ... 79
I
I. Figures Index
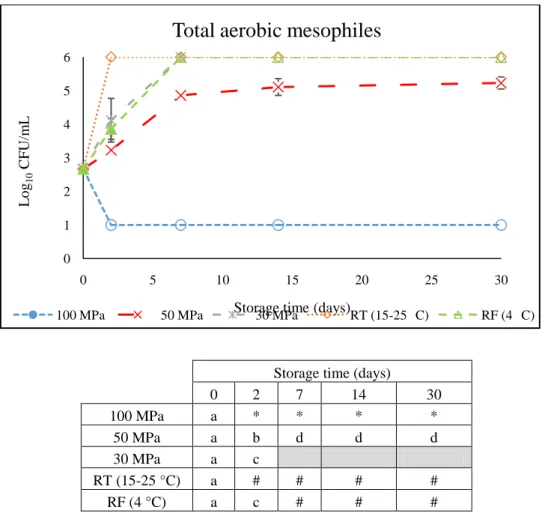
Figure 1. Representation of the pressures used in food processing. Adapted from (Considine et al., 2008). ... 3 Figure 2. Flow chart of the UHT milk production process (González-García et al., 2013). ... 29 Figure 3: Microbial counts (Log10 CFU/mL chocolate milk) of TAM in chocolate milk
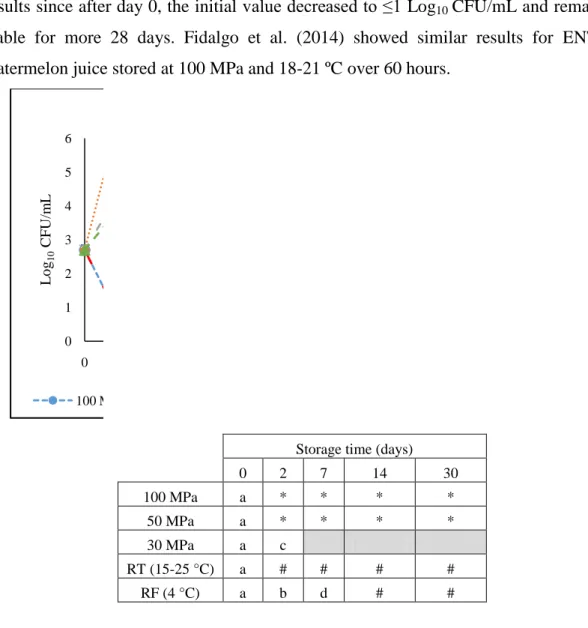
during 30 days of storage at 30 MPa, 50 MPa and 100 MPa at uncontrolled RT (15-25 °C). Two control conditions were also stored at 0.1 MPa/RT, and 0.1 MPa/RF. In the table different letters indicate significant differences (p<0.05) between conditions. Values shown as 6 (#) and 1 (*) log units, mean values higher than 6 and lower than 1 log units, respectively. ... 42 Figure 4: Microbial counts (Log10 CFU/mL chocolate milk) of TAM in chocolate milk
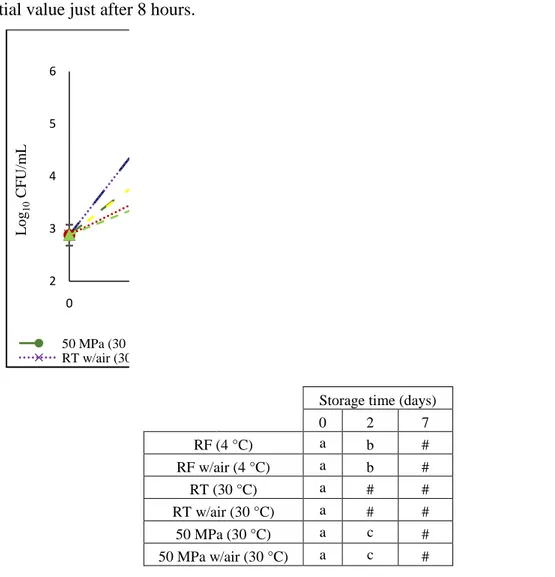
during 7 days of storage at 50 MPa without and 50 MPa with air at 30 °C. Four control conditions were also stored at 0.1 MPa/30 °C without air, 0.1 MPa/30 °C with air, 0.1 MPa/RF without air and 0.1 MPa/RF with air. In the table different letters indicate significant differences (p<0.05) between conditions. Values shown as 6 (#) and 1 (*) log units, mean values higher than 6 and lower than 1 log units, respectively. ... 43 Figure 5: Microbial counts (Log10 CFU/mL chocolate milk) of ENT in chocolate milk
during 30 days of storage at 30 MPa, 50 MPa and 100 MPa at uncontrolled RT (15-25 °C). Two control conditions were also stored at 0.1 MPa/RT, and at 0.1 MPa/RF. In the table different letters indicate significant differences (p<0.05) between conditions. Values shown as 6 (#) and 1 (*) log units, mean values higher than 6 and lower than 1 log units, respectively. ... 44 Figure 6: Microbial counts (Log10 CFU/mL chocolate milk) of ENT in chocolate milk
during 7 days of storage at 50 MPa and 50 MPa with air at 30 °C. Four control conditions were also stored at 0.1 MPa/30 °C, 0.1 MPa/30 °C with air, 0.1 MPa/RF and 0.1 MPa/RF with air. In the table different letters indicate significant differences (p<0.05) between conditions. Values shown as 6 (#) and 1 (*) log units, mean values higher than 6 and lower than 1 log units, respectively. ... 45
II
Figure 7: Microbial counts (Log10 CFU/mL chocolate milk) of COL in chocolate milk
during 30 days of storage at 30 MPa, 50 MPa and 100 MPa at uncontrolled RT (15-25 °C). Two control conditions were also stored at 0.1 MPa/RT and 0.1 MPa/RF. In the table different letters indicate significant differences (p<0.05) between conditions. Values shown as 6 (#) and 1 (*) log units, mean values higher than 6 and lower than 1 log units, respectively. ... 46 Figure 8: Microbial counts (Log10 CFU/mL chocolate milk) of COL in chocolate milk during 7 days of storage at 50 MPa without air and 50 MPa with air at 30 °C. Four control conditions were also stored at 0.1 MPa/ 30 °C without air, 0.1 MPa/ 30 °C with air, 0.1 MPa/RF without air and 0.1 MPa/RF with air. In the table different letters indicate significant differences (p<0.05) between conditions. Values shown as 6 (#) and 1 (*) log units, mean values higher than 6 and lower than 1 log units, respectively. ... 47 Figure 9: Microbial counts (Log10 CFU/mL chocolate milk) of PSY in chocolate milk
during 30 days of storage at 30 MPa, 50 MPa and 100 MPa at uncontrolled RT (15-25 °C). Two control conditions were also stored at 0.1 MPa/RT and 0.1 MPa/RF. In the table different letters indicate significant differences (p<0.05) between conditions. Values shown as 6 (#) and 1 (*) log units, mean values higher than 6 and lower than 1 log units, respectively. ... 48 Figure 10: Microbial counts (Log10 CFU/mL chocolate milk) of PSY in chocolate milk during 7 days of storage at 50 MPa without and 50 MPa with air at 30 °C. Four control conditions were also stored at 0.1 MPa/30 °C without air, 0.1 MPa/30 °C with air, 0.1 MPa/RF without air, and 0.1 MPa/RF with air. In the table different letters indicate significant differences (p<0.05) between conditions. Values shown as 6 (#) and 1 (*) log units, mean values higher than 6 and lower than 1 log units, respectively. ... 49 Figure 11: Microbial counts (Log10 CFU/mL chocolate milk) of E. coli in chocolate
milk during 30 days of storage at 30 MPa, 50 MPa and 100 MPa at uncontrolled RT (15-25 °C). Two control conditions were also stored at 0.1 MPa/RT and 0.1 MPa/RF. In the table different letters indicate significant differences (p<0.05) between conditions. Values shown as 6 (#) and 1 (*) log units, mean values higher than 6 and lower than 1 log units, respectively. ... 50 Figure 12: Microbial counts (Log10 CFU/mL chocolate milk) of L. innocua in chocolate
milk during 30 days of storage at 30 MPa, 50 MPa and 100 MPa at uncontrolled RT (15-25 °C). Two control conditions were also stored at 0.1 MPa/RT and 0.1 MPa/RF. In the table different letters indicate significant differences (p<0.05) between conditions.
III
Values shown as 6 (#) and 1 (*) log units, mean values higher than 6 and lower than 1 log units, respectively. ... 51 Figure 13: Chocolate milk pH during 30 days of storage at 30 MPa, 50 MPa and 100 MPa at uncontrolled RT (15-25 °C). Control samples conditions were also stored at 0.1 MPa/RT and 0.1 MPa/RF. In the table different letters indicate significant differences (p<0.05) between conditions. ... 54 Figure 14: Chocolate milk pH during 7 days of storage at 50 MPa at 30 °C (samples packed with and without air). Control samples were also stored at 0.1 MPa/30 °C, 0.1 MPa/4°C. In the table different letters indicate significant differences (p<0.05) between conditions. ... 55 Figure 15: Chocolate milk colour (L*) during 30 days of storage at 30 MPa, 50 MPa and 100 MPa at uncontrolled RT (15-25 °C). Control samples were also stored at 0.1 MPa/RT and 0.1 MPa/RF. In the table different letters indicate significant differences (p<0.05) between conditions. ... 57 Figure 16: Chocolate milk colour (a*) during 30 days of storage at 30 MPa, 50 MPa and 100 MPa at RT uncontrolled (15-25 °C). Control samples conditions were also stored at 0.1 MPa/RT and 0.1 MPa/RF. In the table different letters indicate significant differences (p<0.05) between conditions. ... 58 Figure 17: Chocolate milk colour (b*) during 30 days of storage at 30 MPa, 50 MPa and 100 MPa at uncontrolled RT (15-25 °C). Control samples were also stored at 0.1 MPa/RT and 0.1 MPa/RF. Different letters indicate significant differences (p<0.05) between conditions. ... 58 Figure 18: Chocolate milk colour (∆E) during 30 days of storage at 30 MPa, 50 MPa and 100 MPa at RT uncontrolled (15-25 °C). Control samples conditions were also stored at 0.1 MPa/RT and 0.1 MPa/RF. In the table different letters indicate significant differences (p<0.05) between conditions. ... 59 Figure 19: Samples of chocolate milk during the days of storage at 0.1 MPa/RT, 0.1 MPa/RF, 50 MPa (A) day 0, (B) day 2, (C) day 7 and (D) day 14. ... 60 Figure 20: Reducing sugars in chocolate milk during 30 days of storage at 30 MPa, 50 MPa and 100 MPa at uncontrolled RT (15-25 °C). Control samples were also stored at 0.1 MPa/RT and 0.1 MPa/RF. In the table different letters indicate significant differences (p<0.05) between conditions. ... 61 Figure 21: Lactose concentration in chocolate milk during 30 days of storage at 30 MPa, 50 MPa and 100 MPa at uncontrolled RT (15-25 °C). Two control conditions were also
IV
stored at 0.1 MPa/RT and 0.1 MPa/RF. In the table different letters indicate significant differences (p<0.05) between conditions. ... 62 Figure 22: Fat globules in chocolate milk in the initial day of storage (A) and after 2 days of storage for 0.1 MPa/RT(B), 0.1 MPa /RF(C) and 100 MPa(D). ... 63
V
II. Tables Index
Table 1: Studies regarding HS at sub-zero (adapted from Fernandes et al., 2014). ... 8
Table 2: Studies regarding HS at low temperature (adapted from Fernandes et al. 2014). ... 9
Table 3: Studies regarding HS at RT from 1981 to 2014 (adapted from Fernandes et al. 2014). ... 14
Table 4: Studies regarding HS at RT from 2015 to 2016 (adapted from Fernandes et al. 2014). ... 15
Table 5: Typical composition of milk in goat, sheep, cow and human milk (Pereira, 2014). ... 18
Table 6: Typical composition of proteins in cow milk found in a study of Pereira, 2014. ... 18
Table 7: Fatty acids composition in cow milk (adapted from (Månsson, 2008; Lindmark-Månsson et al., 2003)). ... 21
Table 8: Mineral composition in cow milk (Pereira, 2014). ... 21
Table 9: Vitamin composition in milk (Pereira, 2014). ... 23
Table 10: Pressure, temperature and storage period of HS experiments performed. ... 32
Table 11: Water activity for chocolate milk stored for 30 days at 30 ºC and 15-25 ºC and pressure (MPa) conditions. ... 53
Table 12: TAM counts in chocolate milk after increasing the microbial loads. ... 79
VI
III. List of abbreviations
AP Atmospheric pressure CCA Coliforms count agar
COL Coliforms
DRI Dietary recommended intake
ENT Enterobacteriaceae
HPP High pressure processing HS Hyperbaric storage IU International unit
MPa Megapascal
PALCAM Listeria identification agar base PCA Plate count agar
PSY Psychrophiles RF Refrigeration
RT Room temperature (15-25 ºC) SFA Saturated fatty acids
TAG Triacylglycerol
TAM Total aerobic mesophiles UHT Ultra-high temperature USFA Unsaturated fatty acids VRBDA Violet red bile dextrose agar YM Yeasts and moulds
1
2 1.1 Overview
The progress and use of new technologies in food processing targets specific consumer requirements for safer, healthier, and minimally processed food products. These ground-breaking processes also include environmentally friendly and sustainable food manufacturing techniques, with low energy consumption and reduced water use that overwhelmed some restrictions given by present food processing performs (Knorr et al., 2011).
Gradually, consumers have been growing their knowledge about health benefits and risks associated with the intake of each food product. To come across consumers’ perspectives, the food industry is committed to spending considerable capitals and know-how in the production of healthier and safer food products. This includes inspecting materials arriving from the food chain, suppressing microbial growth, and decreasing or eliminating the microbial load by processing and preventing post-processing contamination maintaining product quality (Lado & Yousef, 2002).
Diet and health have a relationship that is now well known to be one of the keys to avoiding disease and promoting wellbeing. Functional foods exert a positive influence on human health above their nutritive value, such as dairy products. Milk is a well-known food for being a rich source of bioactive components that have positively influence in health (Mills et al., 2011). Milk is a valuable source of important nutrients such as proteins, fats and carbohydrates and it is widely consumed. This food provides several physiologically functional compounds including bioactive peptides, antioxidants, essential vitamins/minerals, and nutritionally required fatty acids (Chung et al., 2016).
1.2 High pressure application on food
Fresh, healthy, minimal-processed food products with natural flavor and taste, as well as prolonged shelf life, are the characteristics that consumers showed preference for food products (Aymerich et al., 2008).
Temperature is an important thermodynamic parameter, but so is the pressure.High pressure processing (HPP) is a promising “non-thermal” techniquethat can affect molecular systems (Rastogi et al., 2007). This method isextensively used for food products preservation, allowing the inactivation of vegetative microorganisms most frequently related to food-borne diseases. HPP uses intense pressure, in the range
3
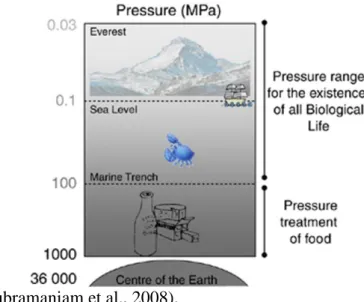
of 100-1000 MPa (Figure 1), at cold or even at elevated temperatures, in order to reach safety food products, with the most foods not being considerable affected on taste, texture or nutritional characteristics. The main advantage of HPP compared to thermal treatments is the maintenance of the sensorial and nutritional properties of food
products (Balasubramaniam et al., 2008).
Figure 1. Representation of the pressures used in food processing. Adapted from (Considine et al., 2008).
1.2.1 HPP history
HPP technology has been discovered for more than a century as a preservation technique. Hite, 1899 was the first to publish that milk and fruit can be preserved by HPP at 680 MPa. Hite, 1899 showed that the shelf life of raw milk could be extended for 4 more days after pressure treatment at 600 MPa for 1 hour at RT. Years later Hite & Giddings, 1914 found that fruits treated with pressure remained commercially sterile for at least 5 years after processing at pressures ranging from 400 to 820 MPa. The HPP study forfood preservation started in the early 1990s, and can be considered the launch of industrial HPP biotechnology (Rastogi et al., 2007).
1.2.2 HPP process description and equipment
Inthe HPP, the packaged food is placed in a transporter and automatically loaded into the HPP vessel, being at the endthe vessel plugs locked. The pressure media, typically water, is driven to the vessel from one or both sides. After reaching the desired pressure the pumping is stopped, and no further energy effort is necessary to hold pressure during time. On the other hand, contrarily to thermal processing in which
4
temperature gradients occur, all molecules in the HPP vessel are exposed to the same amount of pressure at exactly the same time due to the isostatic principle of pressure diffusion (Rastogi et al., 2007; Heinz et al., 2009). The adiabatic heat of compression during processing estimated that temperature increases 3-9 ºC for each 100 MPa,beingneeded a few minutes to achieve the desired pressure (Knorr et al., 2011; Butz & Tauscher, 2002).
Through the years, the HPP equipment’s development was considerable in gain of volume and increase of pressure. The volume of the vessel may vary from less than 100 mL under pressures above 1000 MPa in laboratory scales to an industrial scale equipment that can support more than 500 L with pressures beyond 600 MPa due to its size and material resistance (Hendrickx et al., 2001).
The basic principles that determine the behaviour of foods under pressure are Le Chatelier’s principle and Isostatic principle. Le Chatelier’s principle states that whenever an equilibrium system is disturbed, it tends to change to another equilibrium. Therefore, any reaction, conformational change, phase transition, attended by a decrease/increase in volume is improved/worse by pressure (Smelt, 1998). The isostatic principle states food products are compressed by uniform pressure from every direction and then reverted to their original shape when the pressure is released. The samples are compressed independently of the product size and geometry because transmission of pressure to the core is not mass/time dependant thus the process is minimized. If a food product contains sufficient moisture, pressure will not damage the product at the macroscopic levels as long as the pressure is applied uniformly in all directions (Smelt, 1998).
1.2.3 HPP impact on microorganisms
It can be predictable that the mode of action of pressure on whole organisms is not necessarily the same, but dependent on the pressure level applied. Hydrostatic pressures between 30 and 50 MPa can affect gene expression and protein synthesis. Usually, at pressures of ~100 MPa the nuclear membrane of yeasts isaffected and at >400-600 MPa more changesoccur in the mitochondria and cytoplasm (Smelt, 1998).
In literature it is proved that 50 MPa of pressure can obstruct protein synthesis in microorganisms and decreases the number of ribosomes. Pressure under 100 MPa can make partial protein desaturations, and 200 MPa causes damage to the cell membrane and internal cell structure (Huang et al., 2014).
5 1.2.3.1 Bacteria and bacterial spores
Bacteria are responsible for food poisoning and Gram-positive are considered more resistant to heat and pressure than Gram-negative bacteria (Smelt, 1998). This resistance is due to the rigidity of teichoic acids in thick peptidoglycan layer of the gram positive cell wall (Lado & Yousef, 2002).
The mode of action of pressure on bacterial spores is quite a matter of conjecture. Bacterial spores are killed directly by pressures higher than 1000 MPa. However, spores are sensitive to pressures between 50 and 300 MPa. It is commonly established that at such pressures, spores germinate, followed by death of the germinated spore. Activation of spores under atmospheric conditions is frequently needed prior to germination. Low pH or heat can be carried by activation of spores, but it seems to be a reversible event, but normally it is frequently tracked by germination (Griffiths & Walkling-Ribeiro, 2012).
1.2.3.2 Yeasts and moulds
Yeasts and moulds (YM) are a main problem because they can produce toxins. Under pressure, YM are sensitive and can be inactivated using relatively low pressures within 100 MPa which cause damage in cell wall of yeasts and at pressures of 200-300 MPa occur total inactivation of YM by damage of nuclear membrane, cytoplasm and mitochondria (Smelt, 1998).
1.2.3.3 Escherichia coliandListeria monocytogenes
It is common that heat-resistant microorganisms are also more resistant to pressure, but there are numerous exceptions. Gram-positive bacteria are more resistant to heat and pressure than Gram-negative bacteria (Cheftel, 1995). L. monocytogenes is a Gram-positive bacteria and for that it is more resistant to pressure and temperature (Smelt, 1998). This bacteria can grow under RF without presence of oxygen, but under pressure, for instancein milk, inactivation can occur at 300, 400, 600 MPa, with decimal reduction times (D) of 14.03, 9.00,and 3.04,respectively (Dogan & Erkmen, 2004).
E. coli is a Gram-negative bacteria that is facultative anaerobic and does not
produce spores. In milk between 0 fat (skimmed); 3.25 (whole) and 5% (high fat) it is shown that fat content has no significant influence on the HPP destruction of E.coli. Furthermore, it was found that the major contributors for baroprotection of E.coli in
6
milk during HPP treatment appear to be casein and lactose, rather than the fat content (Ramaswamy et al., 2009; Georget et al., 2015).Concerning pressure sensitive processes on microorganismsit is described that E.coliat low pressures, between 50 MPa and 60 MPa, shows some interference in DNA replication and growth, and at 77 MPa problems in the transcription process can occur (Mota et al., 2013).
1.3 Hyperbaric storage
Infood industry, RFis responsible for 50% of the total energy consumed, and thisenergy consumption contributes largely to the increase of carbon dioxide (CO2)
emission footprint(Bermejo-Prada, 2014).Recently and regarding this problem, more efforts have been made in the agro food industry to increase the efficiency of the food preservation technologies, finding new ways/technologies, better for the environment, with low energy costs(James & James, 2010; Tassou et al., 2010).
An accident that occurred 40 years ago revealed the possibility to preserve food products under pressure, since afterthe sinking of the research Submarine Alvin over 10 monthsat a depth of ~1540m (15MPa and 4ºC), well preserved food such as bouillon, apples and sandwiches were discovered. This new finding brought a new possibility to store food and other biomaterials under pressure, and it was named of Hyperbaric Storage(HS) methodology (Jannasch et al., 1971).
HS meaning food storage under pressure that preserves the quality of the product by microbial growth inhibition, brings a new way to preserve products without need of RF to keep their characteristics.At the beginning, studies concerningHSweretestedat very low temperatures with pressure, but over the years the tendency has been increasing it in order to useHS at RT. This approach brings the possibility to store food products at variable RT, reducing energy costs sinceenergy is only requiredin the compression/decompression phases to reach the desired pressure level, and no other energy is necessary to sustain food products under pressure during storage period(Fernandes et al., 2014).
In Japan, studies regardingHS at sub-zero temperatures showed promising resultson microbial growth inhibition, however, on the other hand the energy consumption is similar as the freezing method (Kalichevsky et al., 1995; Hendrickx & Knorr, 2001). Recent studies show the possibility to use low positive temperature and HPP to maintain food quality parameters for substantial periods of time(Kalichevsky, 1995; Charm et al., 1977). Nonetheless, otherHS studies carried out at RT and up to
7
37ºC provided higher energy savings(Queirós et al., 2014; Segovia-Bravo et al., 2012; Romanazzi et al., 2008). The state of the art will be addressed inmore detailin this work. This new technology is important for the food industry as an alternative to the traditional frozen and refrigerated storage of foods. More importance is given to HS under naturally variable RT, since the energy costs are much lower than the conventional methodology (Fernandes et al., 2014). With this new technology it is possible not only to preserve the original characteristics ofthe product over storage but also to increase itsshelflife(Jannasch et al., 1971).
There are already several studies related to the influence of pressure on microorganisms in food processing at high pressures and during short periods. However, there are few studies exploring the microorganism’s behaviour over long storage periodsatlow pressures.
1.3.1 Hyperbaric storage at sub-zero temperatures
The purpose of using HS at sub-zero temperatures allows to decrease the water freezing point, being possible to have liquid water at -22 ºC and 209 MPa by modification of low temperature and high pressure (Liplap et al., 2014). Thus, it is possible to have food products not subjugated to freezing and thawing processes, maintaining the nutritional properties and particularly texture characteristics (Charm et al., 1977).
Concerning HS at sub-zero until today, four studies were done in cod fish fillets, Pollock, chicken and beef ( 22,8 MPa for 36days at -3 ºC)(Charm et al., 1977), beef (200 MPa at -20 ºC)(Deuchi & Hayashi, 1990), strawberries and tomatoes (50 to 200 MPa at -5 to 20 ºC)(Deuchi & Hayashi, 1992) and chicken and carp (170 MPa for 50 days at -8 and -15 ºC) (Ooide et al., 1994)(see Table 1).
The first HS study at sub-zero temperatures, which was made by Charm et al., 1977 in codfish fillets showed that samples maintained its initial microbial load. In other experimental studies, done in raw pork, beef, strawberries and tomatoes stored under 50-200 MPa, at -5 to -20 ºC, the colour and fresh flavour were preserved, and the microbial counts of most microorganisms decreased (Deuchi & Hayashi, 1990; Deuchi & Hayashi, 1991). The enzymatic activity assessment in food is important since the enzymatic activity is related tochanges in the food product characteristics.Thus,Deuchi & Hayashi, 1992showed that some enzymes activity (catalase, β-amylase, cathepsin and lactate dehydrogenase) werereduced under sub-zero HS conditions (200 MPa and -20
8
ºC), but not inactivated as observed in the freezing process, preserving the characteristics of the product.
In the close combination of temperature and pressure at sub-zero temperature, food products shelf-lives can be extended as a result of dropping the enzyme and microbial activities. This method had demonstrated to be similar to better than freezing on the reduction of the microbial loads, avoiding damages caused by freezing/thawing (Charm et al., 1977).
Table 1:Studies regarding HS at sub-zero (adapted from Fernandes et al., 2014).
Product Conditions Results Reference
Sub-Zero Temperature Cod fish fillets,
pollock, chicken and beef
22.8 MPa for 36 days at -3 °C
Stable for at least 36 days. Classified with only 7 days of shelf
life at 0.1 MPa.
Charm et al., 1977
Beef 200 MPa at -20 °C
Microbial load reduction and inactivation of yeasts and some
bacteria. Deuchi & Hayashi, 1990 Strawberries and tomatos 50 to 200 MPa at -5 to -20 °C
Stable for a few days/weeks. Fresh flavour and colour were preserved.
Deuchi & Hayashi, 1992
Chicken and carp 170 MPa for 50 days at -8 and -15 °C
Stable for 50 days. Enzymatic activity was reduced.
Ooide et al., 1994
1.3.2 Hyperbaric storage at refrigeration temperatures
As mentioned before, HS at RF temperatures was discovered at the time of the research submarine Alvin sinking(Jannasch et al., 1971). Some years later a similar studied showed the effect of 24 MPa at 1 ºC in cod fish fillets and Pollock (Charm et al., 1977). The results obtained showed that under pressure the microbial load remains stable over storage. The samples subjected to HS were considered acceptable for consumption after 12 and 21 days of storage for Pollock and codfish, respectively.
Studies were done concerning enzymes and physicochemical properties under different conditions, including pressure and temperature (see Table 2). Trypsin and peroxidase were studied at temperatures of -3, 0, 4 and 23 ºC and pressures of 0, 27.6,
9
34.5 and 41.3 MPa. The authors concluded that the increase in temperature and pressure caused a decrease in the enzyme activity at constant pressure and temperature, respectively. Nonetheless, trypsin activity increased and decreased when the pressure was increased at temperatures near 23 ºC or below 4 ºC, respectively. An hypothesis was made and consisted that an enzyme has a critical temperature value under which the pressure reduces the reaction rate and beyond it the reaction rate increases (Charm et al., 1977).Several authors express that high pressure at low temperatures may have a higher inhibition in the biochemical activity of microbial cells, when compared to low temperature alone based on the studies made (Jannasch et al., 1971).
Table 2: Studies regarding HS at low temperature (adapted from Fernandes et al. 2014).
Products Conditions Results Reference
Low Temperature Bouillon,
sandwiches and apples
15 MPa for 10 months at 3-4 °C
All the products were stable for the 10 months and for a few weeks at RF and 0.1
MPa.
Jannasch et al., 1971
Rice, wheat and soy beans
3.5 MPa for 1 year at 1 °C
Stable for 1 year. Biochemical changes less pronounced.
Mitsuda, 1972
Cod fish fillets 24.12 MPa for 21 days at 1 °C
Stable for 21 days. Classified with only 8.2 days of shelf life at 0.1 MPa.
Charm et al., 1977
Pollock 24.12 MPa for 21 days at 1 °C
Stable for 12 days. Classified with only 6.7 days of shelf life at 0.1 MPa.
Charm et al., 1977
Mume fruit 0.5 MPa for 5 days at 5 °C
Stable for at least 5 days. Acceptable colour quality, decrease ethylene and CO2
production.
Baba & Ikeda, 2003
Mume fruit, sweet basil
0.5 MPa for 10 days at 4 °C
Stable for 10 days. Inhibition of discoloration and chilling injuries for
mume fruit. Sweet basil exhibited browning injuries.
Baba et al., 2008
Rocket salad 0.025 MPa for 2 months
at 4 °C Prevention against fungal growth.
Baba et al., 2008 Peach 0.414 MPa for 4 weeks
at 4.4 °C Decrease of total volatiles production.
Yang et al., 2009
Tomato
0.1, 0.3, 0.5, 0.7 and 0.9 MPa for 5, 10 and 15
days at 13 ºC
Respiration rate decrease, weight loss and delay in ripening process.
Goyette et al., 2012
10 1.3.3 Hyperbaric storage at room temperature
HS of food at RT is a good opportunity to reduce energy costs sinceHSonly requires energy during the compression and decompression phases, and do not need energy consumption to maintain the pressure level throughout time (Bermejo-Prada, Segovia-Bravo, et al., 2015). This technique can be very important since it could allow to have domestic storage at consumers’ homes or restaurants, using equipment’s named as hyperstorers or simply,storers (Fidalgo et al., 2013).
In the last few years, an increasingly number of researchers have published scientific papers about HS at RT, and have explored the possibilities of this technology to extend the shelf life of fresh fruits and vegetables or processed food products (see
Table 3 for HS at RT regarding studies from 1981 to 2014).
The first study on HS at RT was achieved by compressing air at 35 atm (~3.6 MPa) and 20 ºC with an atmosphere composed by O2, N2, and CO. These authors tested
the moisture loss, respiration rate and quality of mushrooms during 96 to 393 h at the same conditions described above (Robitaille & Badenhop, 1981). This study showed a lower moisture loss and browning extent when compared to those stored at 0.1 MPa. On the other hand, pressure demonstrated no effect on respiration rate. Only after 1 week occurred larval growth in samples under pressure after depressurization and storage at 0.1 MPa, however in control samples larval growth appeared during storage (Robitaille & Badenhop, 1981). Although, in this case air was used to create the pressure level desired,the most common is to use a liquid medium to create pressure, like water, for instance in Romanazzi et al., 2008; Liplap, Charlebois, et al., 2013 studies.
In processed food, normally pressure is transmitted by a liquid medium and it can be increased considerably (25-220 MPa), especially in homogenized products (Bermejo-Prada, Vega, et al., 2015).Tilapia fillets were studied under 101 MPa for 12h at 25 ºC with pressure transmitted by a liquid medium showing similar inhibitory effect on rotting agent growth as mentioned above. In this experiment was observed an inhibitory effect in the growth of total plate counts, a reduction of 2.0 log CFU/g was detected as well in fillets stored under 203 MPa for 12 h at 25 ºC. After this study, the authors also analyzed the post-HS (the preservationof the product over hours todays at atmospheric pressure (AP) after a storage period under pressure) and have seen some enzymes and microbes reactivation (Ko & Hsu, 2001).
11
Recent studies are more focused on fruit juices preservation, the first one was developed by Segovia-Bravo et al., 2012 where raw strawberry juice preserved by HS was studied at pressure levels of 25, 100 and 250 MPa, at 5 and 20 ºC, for 15 days, as well as pasteurized juice. The results showed that control sample (juice preserved at 20 ºC and 0.1 MPa) presented higher microbial counts (total aerobic mesophiles (TAM), and YM) than pasteurized and pressurized juice which were below detection limits. In the samples stored at 20 ºC pressure was effective onviscosity and color lossesattenuation. Similar results were obtained by Fidalgo et al., 2013 for watermelon juice stored under 100 MPa, at variable RT (18-21 ºC) and above 30 ºC, for 60 and 8h, respectively. The pressurized watermelon juice preserved under pressure showed a TAM, Enterobacteriaceae (ENT), and YM growth reduction while control juice at 0.1 MPa presented an unpleasant odour and strong off-flavors, which was relatedto the higher microbial load. Also, HS reduced the increase oftitrable acidity parameter verified at AP, but caused higher color changes, speciallya higher lightness. A similar study was made also on watermelon juice for 8h at pressure of 25-150 MPa with temperatures ranging 20-37 ºC showing that 75 MPa had an inhibitory effect on microbial growth, with a performance similar to RF, and at higher pressures, 100 and 150 MPa, the reduction of the initial microbial counts to ≤ 1.00 Log CFU/mL for ENTand YM was observed (Santos et al., 2015).
In 2016 a study was published also on watermelon juice preserved under pressure for a longer period of time (Pinto et al. 2016). In this short communication watermelon juice was preserved over 7 days at 100 MPa and at variable RTbeing then compared with RF. At the end, there was an increase of the microbial counts (TAM, YM and psychrophiles (PSY)) above 6 Log10 CFU/mL for samples stored at AP/RT. HS/RT
showed maximum values of about 2 Log10 CFU/mL for TAM and PSY and below the
detection limit for YM. Also watermelon juice stored at 100 MPa presented physicochemical parameters similar to the initial ones.
Another study carried outon melon juice stored under 25-150 MPa at variable RT (25, 30 and 37 ºC), for 8h, detected a microbial growth inhibition only above 25 MPa, while sample stored under pressures of 100-150 MPa resulted ina decrease of the initial microbial load. Physicochemical parameters of all samples stored under pressure (pH, titratable acidity, total soluble solids, browning degree and cloudiness) did not show a clear variation tendency with pressure, being the results generally similar to RF storage (Queirós et al., 2014).
12
From 2015 and 2016 were published several studies regarding the effect of HS onfoods(see Table 4) (Fernandes et al., 2015; Santos et al., 2015; Moreira et al., 2015; Bermejo-Prada & Otero, 2016; Bermejo-Prada, Vega, et al., 2015; Duarte et al., 2014; Moreira et al., 2015) concerning sliced cooked ham, watermelon juice, Bacalhau com
natas, caldo verde, strawberries juice, carrot soup,requeijão and raw bovine meat.
Sliced cooked ham was preserved at temperatures ranging from 25 to 37 ºC under25-150 MPa over4 and 8h. This study demonstrated that HS at naturally variable RT is a promising alternative to RF showing an inactivation of the microorganisms at 100 and 150 MPa, and a microbial growth inhibition similar to RFat 50 MPa/30 ºC, of about 3.8 Log10 CFU/g for TAM and lactic acid bacteria. In general HS of sliced cooked
ham showed physicochemical parameters (lipid oxidation, pH and colour) similar to the refrigerated samples(Fernandes et al., 2015).
A similar study in two ready-to-eat pre-cooked food: Bacalhau com natas and
caldo verde stored for 12h at 0.1, 50,100 and 150 MPa at naturally uncontrolled RT
(~21 ºC). The resultswere similar to the ones found in the latter study described, with a microbial growth inhibition at 100 MPa for all microorganisms, moreover an additional inactivation effect at 150 MPa was verified, resulting in values below the detection limit for ENT and YM. These results showedan equal to better behaviour when compared to RF. In all HS conditions studied, the physicochemical parameters were similar to the samples stored under RF.
Another two studies concerning carrot soup and requeijão were made atsimilar conditions. The carrot soup was tested with 100 and 150 MPa for 4 and 8h at 25 and 30 ºC and requeijão with 100 and 150 MPa for 4 and 8h at 25 ºC, 30 ºC and 37 ºC. The carrot soup presented amicrobial growth inactivation at 150 MPa during 8h and a microbial growth inhibition at 100 MPa during 4h, being the results better than the ones obtained under RF. TAM showed less susceptibility to HS compared to ENT and YM. The physicochemical parameters were maintained generally at values similar to RF(Moreira et al., 2015). In requeijão, the microbial analyses showed that storage for 4h at 100 MPa was capable to maintain the microbial counts similarto RF and the initial load, ≈3 Log10 CFU/g, at all tested temperatures. At higher pressure (150 MPa), during
8h, the microbial loads were reduced to undetectable counts, except for TAM that were reduced to about ≈1 Log unit. The pH, water activity and lipid oxidation in HS samples presented similar values to RF(Duarte et al., 2014).
13
Bermejo-Prada & Otero, 2016 and Bermejo-Prada, Veja et al, 2015 made two studies on the same food, strawberry juice evaluating the viscosity, pectin methylesterase (PME) activity and colour degradation. The effect of HS during 1, 2, 5, 7, 10, and 15 days at50 and 200 MPa and 20 ºC was tested showing that HS affects some mechanisms of colour degradation, displaying a significant peroxidase inactivation and lower percent polymeric colour during 5, 7 and 15 days of storage at 200 MPa compared with those maintained at AP(Bermejo-Prada & Otero, 2016). The study made in strawberry juice evaluated the viscosity and PME activity atthe same conditions of Bermejo-Prada & Otero 2016and showed that HS enhanced viscosity decay particularly at the beginning of storage although no increase in PME activity was observed (Bermejo-Prada, Segovia-Bravo, et al., 2015)
A more recent study concerning raw bovine meat preserved under pressure was studied and compared to AP storage. Samples were stored initially for 12h at 50, 100 and 150 MPa at RT (without temperature control) and in a second experiment for a longer period of days (10 days) at 50 MPa. For the 12h storage, RF and 50 MPa presented a similar microbial growth inhibition and 100 and 150 MPa storage conditionsrevealed a microbial inactivation effect. Over 10 days at 50 MPa,a longer shelf life was obtained when compared to samples stored under RF. For both storages (12h and 10 days) samples preserved under pressure showed no detrimental effect on physicochemical parameters comparatively to the initial and refrigerated samples.
14
Table 3: Studies regarding HS at RT from 1981 to 2014 (adapted from Fernandes et al. 2014).
Products Conditions Results References
Room Temperature Mushroom 3.5 MPa for 4
days at 20 °C Reduction of moisture loss and browning.
Robitaille & Badenhop,
1981 Tilapia fillets 203 MPa for 12h
at 25 ºC
K value under 40%. Inhibition of deterioration only under pressure.
Ko & Hsu, 2001 Sweet cherries 0.15 MPa for 4 hours at 20 °C
Decrease of mould contamination (brow and total rots, grey and blue moulds).
Romanazzi et al., 2008 Table grapes 0.15 MPa for 1
day at 20 °C
Reduction of infected berry and percentage of lesion diameter. Romanazzi et al., 2008 Strawberries juice 25,100 and 220 MPa for 15 days
at 20 ºC
Stable for 15 days under pressure + 15 days at 0.1 MPa at 5 °C. Microbial load below the detection limits. Attenuation of viscosity decay.
No significant colour degradation.
Segovia-Bravo et al., 2012
Tomato
0.1, 0.3, 0.5, 0.7 and 0.9 MPa for 4 days at 20 ºC
Lycopene synthesis inhibition during HS. No influence in total phenolics and ascorbic acid
content. Liplap, Charlebois, et al., 2013 Tomato 0.1, 0.3, 0.5, 0.7 and 0.9 MPa for 4 days at 20 ºC
Effective reduction of weight loss. Firmness conservation and delay in ripening colour
development. Liplap, Vigneault, Toivonen, et al., 2013 Lettuce 0.1, 0.2, 0.4, 0.6 and 0.85 MPa for 3, 5 and 7 days at 20 °C
Product marketable for 5 days. Sensory and visual quality similar to RF.
Liplap, Vigneault, Rennie, et al., 2013 Melon juice 25, 50, 75, 100 and 150 MPa at 20, 30 and 37 ºC for 8h
Stable at all temperatures. Microbial inhibition at 50/75 MPa and reduction at 100/150 MPa.
Fidalgo et al., 2013 Watermelon Juice 100 MPa for 60h at 18-21 ºC
Avoid microbial growth up to 60 h. Decrease the initial loads. Extended shelf life.
Queirós et al., 2014
Requeijão
100 and 150 MPa for 4 and 8h at 25 ºC, 30 ºC and 37 ºC
Storage for 4h at 100 MPa was able to maintain microbial counts similar to RF and initial load at all temperatures. At 150 MPa and the storage
time to 8h, microbial loads were reduced to undetectable counts, except TAM. HS maintained pH, Awand lipid oxidation values,
similar to RF.
(Duarte et al., 2014)
15
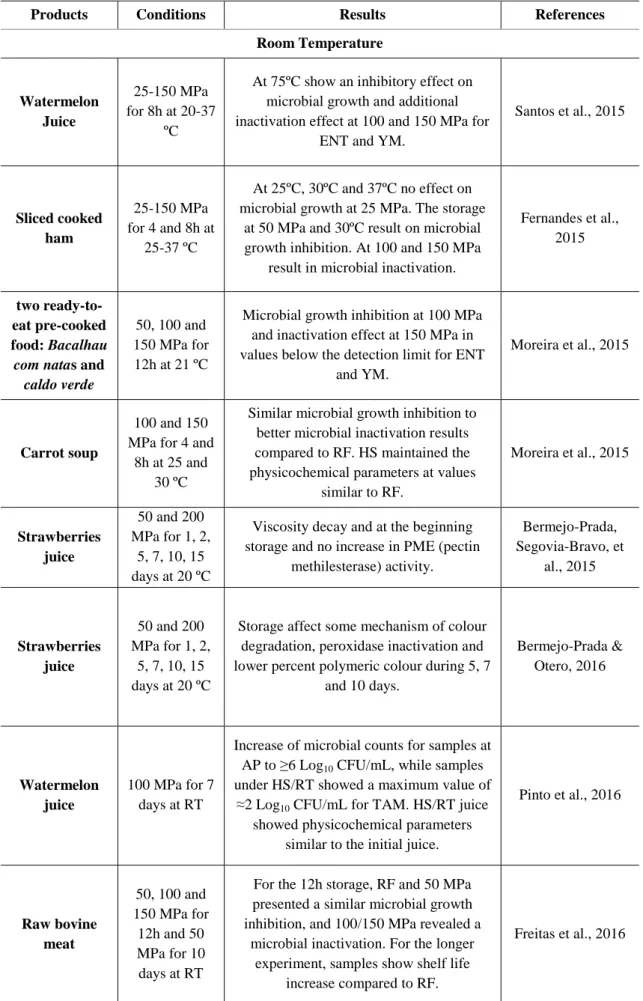
Table 4: Studies regarding HS at RT from 2015 to 2016(adapted from Fernandes et al. 2014).
Products Conditions Results References
Room Temperature Watermelon Juice 25-150 MPa for 8h at 20-37 ºC
At 75ºC show an inhibitory effect on microbial growth and additional inactivation effect at 100 and 150 MPa for
ENT and YM.
Santos et al., 2015 Sliced cooked ham 25-150 MPa for 4 and 8h at 25-37 ºC At 25ºC, 30ºC and 37ºC no effect on microbial growth at 25 MPa. The storage
at 50 MPa and 30ºC result on microbial growth inhibition. At 100 and 150 MPa
result in microbial inactivation.
Fernandes et al., 2015
two ready-to-eat pre-cooked food: Bacalhau
com natas and caldo verde
50, 100 and 150 MPa for 12h at 21 ºC
Microbial growth inhibition at 100 MPa and inactivation effect at 150 MPa in values below the detection limit for ENT
and YM.
Moreira et al., 2015
Carrot soup
100 and 150 MPa for 4 and
8h at 25 and 30 ºC
Similar microbial growth inhibition to better microbial inactivation results compared to RF. HS maintained the physicochemical parameters at values
similar to RF. Moreira et al., 2015 Strawberries juice 50 and 200 MPa for 1, 2, 5, 7, 10, 15 days at 20 ºC
Viscosity decay and at the beginning storage and no increase in PME (pectin
methilesterase) activity. Bermejo-Prada, Segovia-Bravo, et al., 2015 Strawberries juice 50 and 200 MPa for 1, 2, 5, 7, 10, 15 days at 20 ºC
Storage affect some mechanism of colour degradation, peroxidase inactivation and lower percent polymeric colour during 5, 7
and 10 days. Bermejo-Prada & Otero, 2016 Watermelon juice 100 MPa for 7 days at RT
Increase of microbial counts for samples at AP to ≥6 Log10 CFU/mL, while samples
under HS/RT showed a maximum value of ≈2 Log10 CFU/mL for TAM. HS/RT juice
showed physicochemical parameters similar to the initial juice.
Pinto et al., 2016 Raw bovine meat 50, 100 and 150 MPa for 12h and 50 MPa for 10 days at RT
For the 12h storage, RF and 50 MPa presented a similar microbial growth inhibition, and 100/150 MPa revealed a
microbial inactivation. For the longer experiment, samples show shelf life
increase compared to RF.
17 1.4 Milk
Milk is the secretion of the mammary gland of females of mammalian species, and contains the required nutrients to sustain the life of infants and helps the rapid growth and gain of weight that new-borns need, having compounds that offer critical nutritive elements, biologically active substances and immunological protection (Séverin & Wenshui, 2005). Milk is considered to be a dairy food and known for its balanced profile, being an important key on a healthy diet (Pereira, 2014).
In Europe, milk is the main dairy product of the dairy sector and the source for the production of other dairy products (cream, cheese, butter, yogurt, and whey) (González-García et al., 2013). The milk of sheep and goats is significant to the manufacture of dairy products although bovine milk is the most generally consumed in the world (Early, 2012).In the Portuguese industries, milk in its different forms (whole, semi-skimmed and semi-skimmed milk) is the leading product (~890.000 tonnes), tracked by yogurts and cheese reflected by the consumption trends(González-García et al., 2013).
Milk composition can be influenced by several aspects, depending normally on animal species and genetics, environmental conditions, lactation stage, and animal nutritional status (Caroli et al., 2009). When comparing cow’s milk, the most consumed, with sheep, goat and human some differences can be found. Comparing these types of milk, some studies revealed that sheep milk has higher protein and fat content while goat milk presents higher amounts of A, B1 and B12 vitamins, as also calcium and phosphorus concentration when compared to cow and sheep milk (Gartner et al., 2005; Jandal, 1996; Park et al., 2007).
Milk is composed by more than 100 components as fat, proteins, lactose, vitamins, minerals and water. The major component is water at 87 %, and the typical composition of cows’ milk is 3.6 % of fat, 3.2 % of protein, 4.7 % of lactose, 122 mg/100g of calcium, 119 mg/100g of phosphorus, 126 IU of vitamin A and 2.0 IU of vitamin D (Månsson, 2008). The energy value of cow’s milk is about 70 Kcal per 100 ml and the pH level ranges between 6.65 and 6.71 (Park et al., 2007). An example of the composition of milk from different mammals is exposed in Table 5(Pereira, 2014).
18
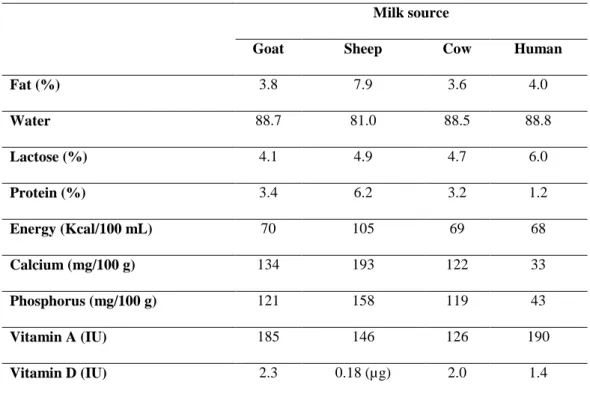
Table 5: Typical composition of milk in goat, sheep, cow and human milk (Pereira, 2014). Milk source
Goat Sheep Cow Human
Fat (%) 3.8 7.9 3.6 4.0 Water 88.7 81.0 88.5 88.8 Lactose (%) 4.1 4.9 4.7 6.0 Protein (%) 3.4 6.2 3.2 1.2 Energy (Kcal/100 mL) 70 105 69 68 Calcium (mg/100 g) 134 193 122 33 Phosphorus (mg/100 g) 121 158 119 43 Vitamin A (IU) 185 146 126 190 Vitamin D (IU) 2.3 0.18 (µg) 2.0 1.4 1.4.1 Milk proteins
Milk is an important protein source in human diet having a value of 32g protein/L. Proteins in this food can be divided into soluble and insoluble fractions, where the soluble (whey proteins) represent 20% and insoluble (caseins) proteins represent 80% of the total protein in milk, respectively as represented inTable 6. The two fractions are categorised as high quality proteins considering human amino acid necessities, digestibility and bioavailability (Séverin & Wenshui, 2005; Haug et al., 2007). These are considered to be the best protein source taking into account the essential amino acid score and protein-digestibility corrected amino acid score (Boye et al., 2012). The amino acids content are different between the two fractions, on the one hand casein has a higher proportion of histidine, methionine and phenylalanine while whey is rich in leucine, isoleucine, lysine and valine (Tang et al., 2009).
Table 6: Typical composition of proteins in cow milk found in a study of Pereira, 2014.
19
The soluble protein fraction includes β-lactoglobulin, α-lactoglobulin, immunoglobulins (Ig), serum albumin, lactoferrin, lactoperoxidase, lysozyme, proteose-peptone and transferrin (Séverin & Wenshui, 2005). Soluble proteins that are important antimicrobial agents are lactoferrin, lactoperoxidase and lysozyme (Jenssen & Hancock, 2009), on the other hand β-lactoglobulin is a retinol carrier and has antioxidant capacities, and lactoferrin is a crucial element in iron absorption and in exerting antioxidant and anticarcinogenic effects (Mills et al., 2011; González-Chávez et al., 2009).
Regarding β-lactoglobulin, it is a polypeptide chain comprising 162 amino acid residues. This protein has several functions in milk such as retinol carrier, binds Cu2+ and Fe2+ ions and inhibits auto oxidation of fats (Micinskia et al., 2013).
α-lactoglobulin constitutes 22% of total whey protein. It is an albumin well soluble in water, and has a chain with 123 amino acid residues with high concentrations of cysteine lysine and particularly tryptophan, which is a precursor of serotonin. This protein participates in the formation of lactose and also binds metals such as cobalt, magnesium and zinc (Micinskia et al., 2013). Serum albumin is similar to α-Casein,
β-TOTAL CASEINS 26.0
α-Casein 13.0
β-Casein 9.3
κ-Casein 3.3
TOTAL WHEY PROTEINS 6.3
β-Lactoglobulin 3.2
α-Lactoalbumin 1.2
Immunoglobulin (IgA, IgM, IgE, IgG) 0.7
Serum albumin 0.4 Lactoferrin 0.1 Lactoperoxidase 0.03 Lysozyme 0.0004 Others 0.8 Proteose-peptone 1.2 Glycomacropeptides 1.2
20
Casein, and α-lactoglobulin and it is inactivated at 70 ºC – 80 ºC (Micinskia et al., 2013).
Concerning lactoferrin, it is a protein synthesized by the secretory epithelial cells of the mammary gland and the main function of this protein is binding iron and transporting it to the intestinal vascular system (Micinskia et al., 2013).
Lactoperoxidase and lysozyme are biologically active enzymes. Lactoperoxidase is an oxidoreductase with antibacterial function, viral growth inhibitor and antineoplastic agent on the other hand lysozyme lyses bacteria in milk, in special Gram-positive bacteria, and has antiviral and anti-inflammatory properties (Micinskia et al., 2013).
Immunoglobulins are antibodies produced in response to viruses, bacteria and animal antigens. These antibodies take place in five types: A, G, M, E and D at the intestinal lumen and intestinal wall. Transferrin is a glycoprotein similar to lactoglobulin and presents an iron-binding capacity, transporting iron form. Iron in muscles is used to biosynthesis of cytochromes and myoglobin to tissues, and in bone narrow is used in the manufacture of hemoglobin. Proteose-peptones are present in minor amounts compared to the other proteins, being the products of enzymatic degradation of casein (Micinskia et al., 2013).
Total caseins can be separated in α-, β-, and κ-Caseins. These proteins transport calcium and phosphorus, forming a coagulum and refining their digestibility in the stomach. Casein fractions differ in concentration, contents of phosphorus, amino acid composition, molecular weight and isoelectric point. Caseins from bovine milk may induce inflammatory reaction in mucous membrane of patients with celiac disease (Holt et al., 2013).
1.4.2 Milk lipids
The lipid fraction in milk is mainly composed by triacylglycerols (TAGs) forming 98% of the fraction, where other lipids like diacylglycerol (2%), cholesterol (<0.5%), phospholipids (~1%) and free fatty acids (0.1%) can also be found. Additionally, there are trace amounts of hydrocarbons, fat-soluble vitamins, flavour compounds, and other ingredients introduced through the animal feed. Lipid matrix in milk is the most complex of all natural fats, having more than 400 fatty acids, forming different TAGs (Månsson, 2008).
21
Lipid fraction in milk is essentially present in globules that are unaffected to pancreatic lipolysis except if prior submitted to gastric digestion (Ye et al., 2010). The quantity and composition of milk fatty acids depend on the animal origin, stage of lactation, ruminal fermentation, or feed related factors (see Table 7).
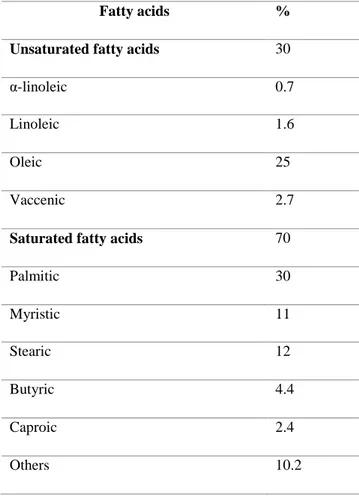
Table 7: Fatty acids composition in cow milk (adapted from (Månsson, 2008; Lindmark-Månsson et al., 2003)).
Fatty acids %
Unsaturated fatty acids 30
α-linoleic 0.7
Linoleic 1.6
Oleic 25
Vaccenic 2.7
Saturated fatty acids 70
Palmitic 30 Myristic 11 Stearic 12 Butyric 4.4 Caproic 2.4 Others 10.2
1.4.3 Milk vitamins and minerals
Raw milk, as a dairy product, has an especially particular micronutrient composition. Milk has an elevated concentration of calcium but other minerals can be found too, like phosphorus, magnesium, zinc and selenium (seeTable 8)(Gaucheron, 2011).
22
%DRI- Dietary recommended intake
Calcium is a macro element present in higher concentrations in milk, 120 mg/L on average, being this content distributed between the micellar and aqueous phases. In the aqueous phase it is linked to whey proteins or inorganic forms of phosphate-forming salts, while in the micellar phase it is associated with the phosphoseryl residues of caseins. These two phases are in thermodynamic equilibrium but at different physicochemical conditions, such as pH and temperature, calcium can pass from one phase to another (Pereira, 2014).
In milk, phosphorus is present in organic and inorganic forms. Inorganic phosphate is located in the aqueous phase and depending on the pH level, just like calcium, exhibits equilibrium between the two phases that can be changed by different pHvalues. The organic phosphate is linked to proteins, phospholipids, organic acids and nucleotides, being present in the micellar phase (Gaucheron, 2011).
Magnesium content is not so high in milk but has the same function of calcium and phosphorus to keep the dynamic equilibrium between the two phases. In even lower concentrations are zinc and selenium, which are present commonly in the micellar phase associated with casein (Pereira, 2014).
The vitamins fraction present in milk are liposoluble (vitamin A, D and E) and hidrosoluble (B complex, thiamine and riboflavin) (Table 9). The concentrations of fat-soluble vitamins in milk depend on milk fat content, therefore low-fat and skim milk varieties have lower amounts of A, D, and E vitamins (Pereira, 2014). Vitamin A is very important in growth, immunity and eye health and the concentration in milk ranges largely on fat amount, but also on aspects like animal feed and season (Gaucheron, 2011). In milk, vitamin D is not present on considerable amounts, except when milk is improved and fortified. Previous studies have reported values within 5 and 35 IU/L (Leerbeck & Søndergaard, 1980).
Mineral mg/100g Amount in 1cup (244g) % DRI
Calcium 119-124 297.50-310 37-40
Phosphorus 93-101 232.50-252.5 16-32
Magnesium 11-14 27.5-35 8-10
Potassium 151-166 377.5-415 8-9
23
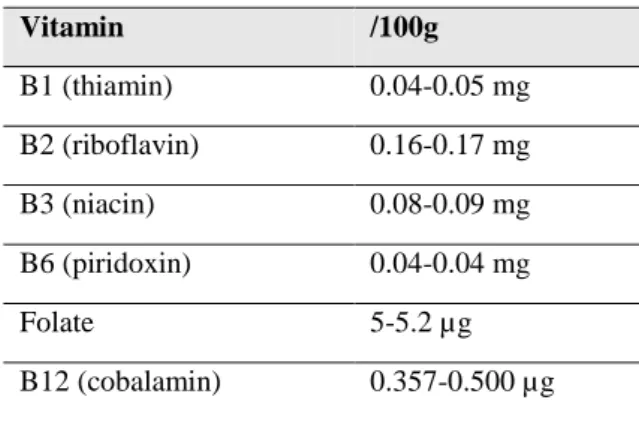
Table 9: Vitamin composition in milk (Pereira, 2014).
Vitamin /100g B1 (thiamin) 0.04-0.05 mg B2 (riboflavin) 0.16-0.17 mg B3 (niacin) 0.08-0.09 mg B6 (piridoxin) 0.04-0.04 mg Folate 5-5.2 µg B12 (cobalamin) 0.357-0.500 µg 1.4.4 Lactose
In milkthe main carbohydrate present is lactose, and it can be found at values around 4.8%. This level of sugar does not turn milk an excessively sweet food product because lactose is less sweet than sucrose as well as less sweet than an equimolar mixture of its components, galactose and glucose. Lactose has a major influence in the colligative properties of milk (osmotic pressure, freezing point depression, boiling point elevation). Associated with many other sugars, lactose ismoderately less soluble in water, being its solubility at 25 °C of 17.8 g/100 g solution. The low solubility of lactose can provoke some production problems because lactose crystals are gritty in texture. Lactose crystallization is also responsible for caking and lumping of dried milk during storage. Like other reducing sugars, lactose can react with free amino groups of proteins to give products that are brown in colour(Singh & Bennett, 2002).
1.5 Health benefits
Since 1980, the dairy industry has been adapting and improving milk products to fulfil consumers requests, and for that reason industries had committed themselves to change the fat content according to milk classification, finding new strategies for less-caloric products ensuring nutritional richness, proper flavour, texture, and odour, with lower fat and lower energy (Pereira, 2014).
Milk is the first food for mammals and gives the nutrients and energy required to ensure proper growth and development in mammals’ growth. This product is a complex food with many components presenting benefits for human health (such as cardiovascular well-being) and others with negative effect. The main problem with milk
24
is related with heart disease due to the saturated fat content, representing 70% of total milk fat. High consumption of saturated fat was earlier associated with improved risk of cardiovascular disease. Additionally, others milk elements, such as minerals like calcium, magnesium and potassium, can take a defensive part in cardiovascular disease due to the antihypertensive effect (Pereira, 2014).
Milk as several minerals, but calcium has a higher concentration compared to other minerals and it is very important in bone density. Elevated bone mass is very important to prevent osteoporosis, and it is very significant the consumption of food products with calcium in early life in order to prevent health problems latter. In Pereira 2014 it was demonstrated that several types of minerals and other constituents like peptides, can play a positive part in bone mass, such as osteoporosis prevention and inferior occurrence of fractures.This can be reinforced by information about nutrients that are supposed to influence production and maintenance of bone matrix such as protein, vitamin C, D and K, as well as minerals like copper manganese and zinc. For all these aims milk consumption is worldwide suggested as a supporter of good bone health(Pereira, 2014).
1.6 Chocolate milk
Chocolate milk formulation comprises milk, cocoa powder, sugar and hydrocolloids. The final composition of chocolate milk, as well as the physical and sensory properties, principally depend on the levels of the components including fat, the type of cocoa and the type of hydrocolloid present (Yanes et al., 2002).
Usually hydrocolloids are added to UHT flavoured milk to increase the creaminess of the final product and to give a more lasting taste.The largest dairy application for kappa-carrageenan (κ-car) is in hot-processed chocolate milk as a favourable mouth-feel to the milk and to permit long-term suspension of the cocoa particles (Bixler et al., 2001). The enhanced apparent viscosity of the carrageenan– casein network results in a favourable mouth-feel (Bixler et al., 2001). The heat treatment increases the shelf life and also the hydration of the hydrocolloid, on the other hand heat treatment promotes the increase of the carrageenan gels strength, and helps in the stability of the product at long-term. The displacement of carrageenan complexed to κ-casein by the denatured β-lactoglobulin increases the stability of the product, therefore increasing the carrageenan availability for carrageenan–carrageenan