Technology Information and Science Management of Journal International The (IJMSIT) Publishers NAISIT Chief in Editor [email protected] Email: Portugal, Interior, Beira of University Ferreira, J. J. Editors Associate Portugal interior, Beira of University Ferreira, M. J. João Editor-in-Chief: Editors: Main USA Memphis, of University and Portugal Lisbon, of Institute University Ferreira, F. A. Fernando Spain Barcelona, of University Lindahl, Merigó M. José Editors: Assistant Portugal Branco, Castelo of Institute Polythecnic Fernandes, Cristina Australia Queensland, Southern of University Co, Jess Portugal Lisbon, of Institute University Jalali, S. Marjan Board: Advisory Editorial UK Management, of School Cardiff Lincoln, Adebimpe Israel College, Academic Netanya Tziner, Aharon USA Pennsylvania, University, Morris Robert Smith, D. Alan Spain Barcelona, of University Lafuente, G. Maria Ana Norway Management, of School Oslo Mariussen, Anastasia Spain Barcelona, de Autònoma Universitat Tarrés, i Serarols Christian UK university, City -Birmingham School Business Millman, Cindy Romania Bucharest, of University Gh, Popescu R. Cristina UK School, Business University Newcastle Irawati, Dessy Spain Valencia, of University Ribeiro, Domingo USA Business, of Schools Carayannis, G. Elias USA University, Technological Michigan Oliveira, Emanuel Spain Seville, of University Liñán, Francisco UK University, City Birmingham Matlay, Harry UK London, of University Birkbeck, Smith, Lawton Helen France Business, of School Rennes ESC Faculty, Adjunct Purcarea, Irina HK University, Polytechnic Kong Hong The Choi, Jason USA Paso, El at Texas of University Faria, Ricardo João Spain Valencia, of University Vila, Jose Bulgaria Economy, World and National of University Todorov, Kiril Canada Montréal, HEC Filion, Jacques Louis Italy II, Federico Naples of University Landoli, Luca Brazil Paulo, Säo de Universidade at Researcher Sakuda, Ojima Luiz Portugal Interior, Beira of University Raposo, L. Mário Spain València, de Politècnica Universitat Peris-Ortiz, Marta Zealand New Waikato, of University The Akoorie, Michele Canada Trois-Rivières, à Québec du Université Julien, Pierre-André Jordan University, Hashemite The Karabsheh, Radwan Spain I, Jaume Universitat Chiva, Ricardo Zimbabwe Technology, and Science of University National Mhlanga, Richard Brazil – Vargas Getulio Fundação Bandeira-de-Mello, Rodrigo
Netherlands The -University Tilberg Rutten, Roel Verde Cabo Empresariais, e Económicas Ciências de Superior Instituto Cruz, Rosa Netherlands The Rotterdam, University Erasmus Thurik, Roy India Delhi, Technology of Institute Indian Jain, K. Sudhir Portugal Interior, Beira of University Azevedo, G. Susana Denmark University, Business Copenhagen Hollensen, Svend Australia Melbourne, University, Trobe La Ratten, Vanessa Austria Vienna, of University Frisch, Walter USA University, State Colorado Byrne, S. Zinta Board Review Editorial Turkey Turkey, University Selçuk Ögüt, Adem Greece Athens, of University Agricultural Sideridis, B. Alexander Netherlands The Amsterdam, University VU Sharpanskykh, Alexei USA York, -York, University State Pennsylvania Kara, Ali Brazil Rio, Grande of University Freitas, Angilberto Portugal Interior, Beira of University Paço, do Arminda Finland Jyväskylä, of University Ojala, Arto Portugal Douro, Alto e Tras-os-Montes of University Marques, Carla Portugal Interior, Beira of University Pereira, Carla Turkey University, Çukurova Tanova, Cem Brazil Catarina, Santa de Federal Universidade Tolfo, Cristiano Portugal Branco, Castelo of Institute Polytechnic Estevão, S. Cristina Croatia Split, of University Miocevic, Dario Zealand New School, Business Auckland of University The Askarany, Davood USA Washington, of University Revere, Debra USA Ohio, Cincinnati, of University Gormley, Kolesar Denise Kong Hong Technology, and Science of University Kong Hong Chiu, K.W. Dickson Spain Navarra, of University Melé, Domènec Portugal Interior, Beira of University Miragaia, Dina Brazil School, Business FUCAPE Mainardes, Emerson USA University, Arizona Northern Otenyo, E. Eric USA University, Illinois Southern Watson, W. George Brazil Maria, Santa de Federal Universidade Moura, de Luiz Gilnei China University, Psychology,Zhejiang of Department Zhong, An Jian Portugal Lisbon, University, Catholic Portuguese Sciences, Human of Faculty Pinto, Carneiro Joana Spain Valencia, of University Alegre, Joaquín USA Jersey, New Business, of School Anisfield Rakotobe, Thierry Joel USA , FL Sanford, Florida, Central of University Matusitz, Jonathan India Kharagpur, Technology of Institute Indian Srivastava, L. B. Kailash Netherlands Twente,The of University Sanders, Karin Germany Koblenz-Landau, of University Troitzsch, G. Klaus China Nanjing, Technology, of University Nanjing Shi, Kuiran Portugal ISLA, Faria, Costa da Liliana Canada Ontario, Western of University Capretz, Fernando Luiz USA Business, of College Godkin, Lynn
Canada Winnipeg, of University Liu, Chunhui Maggie Belgium Liège, of University Ausloos, Marcel USA Texas, University,Denton, Woman's Texas Benham-Hutchins, Marge Spain Granada, of University Pérez-Aróstegui, Nieves María Italy Udine, of University Cagnina, Rosita Maria University,Taiwan Hwa Dong National Tabata, Mayumi Portugal University, Lusíada and University Portucalense Pinho, Micaela Italy Basilicata, of University Renna, Paolo Portugal Bragança, of Institute Polytechnic Fernandes, Odete Paula Portugal Coimbra, of University Cunha, Rupino Paulo Germany University, Saarland Loos, Peter Spain Vigo, de Empresas de Administración e Economia de F. García, Piñero Pilar Romania Bucharest, Studies, Economic of University Bucharest Gheorghe, N. Popescu Economic of University Bucharest The and Satu-Mare of Academy Commercial The Adriana, Veronica Popescu Romania Bucharest, Studies, India Technology, and Management of Institute Singh, Ramanjeet Portugal of University Catholic Morais, Ricardo Spain Rioja, of University Ortiz, Fernández Ruben Canada Manitoba, of University Thulasiram, K. Ruppa USA NJ, University,Montclair, State Montclair Kim, Soo Taiwan University, Yat-Sem Sun National Chiou, Wen-Bin USA GA, ,Augusta, College Paine Lawless, Willaim Singapore University, Management Singapore Koh, T.H. Winston
The International Journal of Management Science and Information Technology (IJMSIT)
NAISIT Publishers
Special Issue: 2014 Spanish-Portuguese Scientific Management Conference
Table of Contents
1 EDITORIAL
MARTA PERIS-ORTIZ , Universitat Politècnica de València, Spain
CARLOS RUEDA-ARMENGOT, Universitat Politècnica de València, Spain
5 EVALUATION OF QUALITY IN DIFFERENT ELECTRONIC SERVICES:
RAMóN BARRERA-BARRERA , University of Seville, Spain ANTONIO NAVARRO-GARCíA , University of Seville, Spain MARTA PERIS-ORTIZ, Universitat Politécnica de València, Spain
28 NOVICE AND EXPERT INTERNET USERS: INFLUENCE OF PRICE
DISCOUNTS ON ATTITUDE TOWARD THE BANNER AND WEBSITE
ESMERALDA CRESPO-ALMENDROS , Universidad de Granada, Spain SALVADOR DEL BARRIO-GARCíA , Universidad de Granada, Spain
45 GENDER DIFFERENCES AMONG ELDERLY IN THE USE OF INTERNET
BANKING SERVICES
ANGEL FCO. VILLAREJO-RAMOS , University of Seville, Spain BEGOñA PERAL-PERAL , University of Seville, Spain
JORGE ARENAS-GAITáN , University of Seville, Spain
MARIA ANGELES RAMóN-JERóNIMO , Pablo de Olavide University , Spain
53 INTEGRATED SYSTEMS IN A BRAZILIAN UNIVERSITY: COOPERATIVE
INFORMATION AS STRATEGIC RESOURCE
MáRCIA JOSIENNE MONTEIRO CHACON, Federal University of Rio Grande of the Norte, Brasil
DANIEL CARRASCO DIAZ, University of Malaga, Spain
DANIEL DAVID SANCHEZ TOLEDANO, University of Malaga, Spain
66 THE ROLE OF COMPETITIVE ADVANTAGE IN STRATEGIC DETERMINANTS
OF EXPORT PERFORMANCE: THEORETICAL FRAMEWORK
ORLANDO LIMA RUA, Polytechnic of Porto , Portugal
94 CREATIVE ECONOMY: MENTAL MODELS OF CULTURAL ENTREPRENEURS IN BELO HORIZONTE, BRAZIL
ANNA GABRIELA MIRANDA DE OLIVEIRA, Faculdade Novos Horizontes , Brasil MARLENE CATARINA DE OLIVEIRA LOPES MELO, Faculdade Novos Horizontes , Brasil
114 DETERMINANTS OF CAPITAL STRUCTURE OF THE INFORMATION
TECHNOLOGY INDUSTRY
NUNO MIGUEL DELICADO TEIXEIRA, Polytechnic Institute of Setubal, Portugal JOãO FILIPE MELO PARREIRA, Polytechnic Institute of Setubal, Portugal
133 ANALYSIS OF STUDIES ON TIME-DRIVEN ACTIVITY BASED COSTING
(TDABC)
ALEX SANTANA, University of Minho, Portugal PAULO AFONSO, Scholarship from CAPES , Portugal
This is one paper of
The International Journal of Management Science and
Information Technology (IJMSIT)
Special Issue: 2014 Spanish-Portuguese Scientific
Management Conference
The International Journal of Management Science and Information Technology (IJMSIT) Special Issue: 2014 Spanish-Portuguese Scientific Management Conference (114 - 132)
114
ISSN 1923-0265 (Print) - ISSN 1923-0273 (Online) - ISSN 1923-0281 (CD-ROM), Copyright NAISIT Publishers 2015
Determinants of capital structure of the information technology industry
Nuno Miguel Delicado Teixeira, [email protected],
Escola Superior de Ciências Empresariais do Instituto Politécnico de Setúbal João Filipe Melo Parreira,
Escola Superior de Ciências Empresariais do Instituto Politécnico de Setúbal
ABSTRACT
The access to capital, on adequate maturity and amounts, is one of the major constraints to sustainable development of enterprises. So, this paper aims to study the determinants of capital structure of companies in the portuguese information technology sector, which is one of the most important industries in the exports of high value-added products of the country. To this end, we studied the mainstream research developed over the years where we note that there are numerous theoretical developments, but the diversity of work also led us to verify that the issue is not yet fully savvy among finance researchers. The sample consisted on the major 500 companies of the industry, with reference to the value of turnover, as a criterion. Through multiple linear regression, it was found that the most important variables to explain the capital structure were business risk, size and collateral guarantees, which had a positive relation to the level of debt; and the cost of financing, reputation and profitability, which had a negative relationship with debt. Finally, it was observed that the debt level was higher in companies with a higher commercial activity when compared to firms that have a greater focus on service providing.
KEY WORDS:
1.1.1 Determinants of capital structure, information technology sector, trade-off, hierarchical selection, strategic positioning.
Introduction
The decision process on the financial structure of firms, i.e., the ideal measure of use of equity or liability to finance the activity, has always been and continues to be something much debated in theory and practice of entrepreneurial finance. Over the past 50 years, financial theory has much discussed about what should be the best choice of capital structure to be adopted by firms.
There have been considerable theoretical developments in recent years, but the diversity of studies shows that it is not yet fully understood among various finance researchers. Thus, the choice of the topic relates to the fact that a consensus does not yet exist regarding previous research results on this topic, and we consider that in Portugal, there is still much to study on corporate financial structure, from the access to financial resources in appropriate amounts, deadlines and associated financial costs, since these are undoubtedly some of the main determinants of business success.
Simultaneously, we have chosen to focus our study on the information technology sector, for being an activity that continues to grow in Portugal and that reveals a huge need for support to take on quick and efficient business decisions, given the constant change of their market. Thus, this research aims to study the determinants of the financial structure of companies in the information technology sector, i.e., to assess on what variables influence the use of debt or equity in the financing of activity.
The first part of the paper concerns the theoretical framework about what different researchers have developed over time on this topic. Then we present, in a more detailed manner, the objectives, hypotheses and research methodology, as well as the results obtained from the study.
1. Theoretical background on capital structure
The financing decision in business began to be studied with the publication of the work of Modigliani and Miller in 1958 - The Cost of Capital, Corporate Finance and the Theory of Investment. Over time, there have been several
The International Journal of Management Science and Information Technology (IJMSIT) Special Issue: 2014 Spanish-Portuguese Scientific Management Conference (114 - 132)
115
ISSN 1923-0265 (Print) - ISSN 1923-0273 (Online) - ISSN 1923-0281 (CD-ROM), Copyright NAISIT Publishers 2015 studies in order to determine the variables that truly influence the financing decision. Nowadays, researchers generally share theories about the financing decision in three main streams of research:
Capital structure based on the costs and benefits of financing sources, traditionally called the trade-off theory; Hierarchical selection of financing sources;
Capital structure as a function of strategic positioning.
The capital structure based on the costs and benefits of financing sources, has been developed over the years, always based on the idea that there is an optimal financial structure. Generally, the cost of debt capital is less than the cost of equity because investors have different levels of risk. In bankruptcy, creditors have preference over owners. Thus, the borrowed funds have a positive impact on the overall cost of financing the company. However, after a given level of debt, the financial risk will increase, reflected in a higher cost of debt capital, no longer being advantageous to use external financing sources.
Modigliani and Miller’s (1958) work, was the basis to the study of the financing decision. The authors developed the capital structure irrelevance principle. In this work, the structure was considered irrelevant to the capital value of a company, because in perfect financial markets, investments that would provide the same results would have the same cost. For example, the profitability generated by bonds and shares of a company should be identical. Thus, the value would be solely dependent on the assets’ ability to generate results. As such, they created two propositions: Proposition I: The market value of any firm is independent of its capital structure;
Proposition II: The expected return rate of the shares of an indebted company increases proportionally with the leverage ratio (debt / equity).
Thus, the authors theorize that although financial structure does not create value, the use of debt capital increases owners’ profitability per dollar invested, given that the activity of the company was able to generate surpluses with a higher return rate than that of the financial costs. In a following work in 1963, Modigliani and Miller identified the importance of the tax effect, recognizing the value created by the tax savings from interest, because these can be considered as financial costs, unlike the dividends. So, the different tax treatment led companies to opt for debt capital in their financial structures. Thus, they began to argue that the optimal financial structure should be composed entirely of borrowed capital.
During the 70’s, many researchers developed important bankruptcy costs theories (Kraus & Litzenberger (1973), Scott (1976), Warner (1977), Kim (1978) and Haugen & Senbet (1978)). They found that the theory presented by Modigliani and Miller did not consider bankruptcy costs, that could be very high. These costs were divided into direct, such as the sale of assets below their current values, and indirect because of the threat of bankruptcy, which may lead customers to seek alternatives in the market and the refusal of credit or delivery, by suppliers. The greater the debt, the greater the possibility of activity inefficiencies to exist related to the company’s eventual bankruptcy. In 1977, Miller drew attention to another important factor in the financing decision: the taxation of individuals. Thus, the financing decision should be oriented in accordance with the type of income, profits or interest, which generates higher return to investors.
Over the following years, several research works were developed that highlighted the role of the agency theory (Jensen & Mecking (1976), Myers (1977), Jensen (1986), Harris & Raviv (1990) and Stulz (1990)). These studies showed the difficulty to align the interests of managers, owners and creditors and the impact of this reality in the definition of financial structure. This is because managers give priority to financial stability rather than to the return for capital owners. Besides that, divergences with the financial creditors, result from disclosing less accurate accounting and financial information. Thus, according to these studies it was found that debt could act as a quality control management tool, since it increased risk and forced managers to make better decisions.
In conclusion, we can say that the capital structure in terms of costs and benefits has the following key ideas (Ross, Westerfield & Jordan., 2002):
The weighted average cost of capital decreases by resorting to debt, that generally has a lower cost than equity; As of a given level of debt, the financial risk rises and bankruptcy costs increase the cost of borrowed capital; At the same time, due to the higher risk, owners will demand a higher return;
The International Journal of Management Science and Information Technology (IJMSIT) Special Issue: 2014 Spanish-Portuguese Scientific Management Conference (114 - 132)
116
ISSN 1923-0265 (Print) - ISSN 1923-0273 (Online) - ISSN 1923-0281 (CD-ROM), Copyright NAISIT Publishers 2015 With regard to the capital structure according to the hierarchical selection, researchers presented a new view on the subject, believing that companies did not seek an optimal capital structure, although they do consider that financing decisions are relevant to the creation of value. This stream is based on the idea that there is information asymmetry between managers and potential external investors, which limits the use of debt capital.
Ross (1977), Leland and Pyle (1977) developed the signalling theory, based on the assumption that the value of securities issued by companies depends on the interpretation that the market makes of the signals coming from financial decisions. The signals considered as more relevant are the level of debt and the dividend distribution policy because they represent an indication to the future cash flows.
In 1996, Bringham drew attention to the importance of the profitability of future projects in the financing decision. He developed the idea that if the projects were expected to get high returns, owners resorted to debt capital more easily so as not to share the profits with new owners; if they had doubts about the profitability of the new projects, they preferred to use their own capital, to decrease the financial risk associated with financing.
Later, Myers (1984) and Myers and Majluf (1984) established the pecking order theory. In these studies, they observed a possible hierarchy of sources of business financing for the preference levels of managers. Firstly, they prefer financing the business with internal funds; if this were not enough, then resorted to debt capital. Thus, issuing equity will only be used to cover the remaining financial needs. So, giving primacy to self-financing, managers tried to prevent the outward transmission of signals about the company’s situation.
In conclusion, we verify that the current capital structure according to the hierarchical selection is based on the key idea that the financing sources used, depend on the information that managers intend to disclose about the company's activity, either in terms of profitability, risk, liquidity, etc.
Finally, the (firm’s) capital structure due to strategic positioning, argues that the financial structure depends on the business strategy of companies. Harris and Raviv (1991), divide the theory into two types of models:
Models that study the relationship between market strategy and capital structure;
Models that study the relationship between the characteristics of the inputs and outputs of the firm’s activity with its capital structure set.
Titman and Wessels (1988), identified several attributes of companies that shaped the financial structure: Uniqueness: companies with specialized products had a lower propensity to indebtedness;
Size: Smaller companies were more prone to short-term debt for lack of negotiating power with credit institutions;
Profitability of companies: the most profitable had less debt.
On the other hand, they didn’t find any relationship between the financial structure of companies and the following attributes: expected growth, tax benefits not generated by debt, earnings volatility and asset structure.
In 1991, Maksimovic and Titman found that there was also a relationship between reputation and financial structure. Companies considered as major references in the market, had a lower level of debt in order to reduce the risk of bankruptcy and maintain a high level of notoriety.
Balakrishnan and Fox (1993), proved the linkage between business strategy and financial structure at two levels: The financial structure determined the strategy to be implemented by means of the volume of financial
resources available, types of financing sources that the company could access and the cost of capital that could be procured;
The business strategy determined the financial structure by type of investment required and forms of organization and management of enterprises.
Subsequently, Arias et al. (2000) identified that there was a correlation between the types of strategies adopted by companies and financing sources used:
Companies with diversification and differentiation strategies had less financial risk, which gave them more capacity to obtain debt capital;
The International Journal of Management Science and Information Technology (IJMSIT) Special Issue: 2014 Spanish-Portuguese Scientific Management Conference (114 - 132)
117
ISSN 1923-0265 (Print) - ISSN 1923-0273 (Online) - ISSN 1923-0281 (CD-ROM), Copyright NAISIT Publishers 2015 Companies with higher levels of innovation and major investment in research and development, had longer
pay-backs, increasing the business risk and reducing debt;
Companies with production factors which are difficult to replace, also had greater financial risk and consequently lower indebtedness;
Companies with better competitive position (market share and profitability), had higher debt, via the lower risk associated with the business.
In summary, researchers who developed the current capital structure on the basis of strategic positioning, sustain that the business strategy (diversification, type of competitive advantage created, dimension, level of vertical integration and market coverage) and the individual characteristics of each business (necessary amount of investments, specific assets, extent of investment recovery periods, etc.) clearly constrain the types of financing sources used.
2. The Industry of information technology
The present world is nowadays highly globalized and because of that, there is a strong international trade that causes an intense competition between companies of different countries and geographical points. Thus, it is now extremely difficult for contemporary societies to live without information technologies (IT). Therefore, the IT sector continues to register quite attractive growth rates when compared to most other activities. At the European level, a growth rate of 5% was recorded in 2011 (EITO, 2012), while, for example, manufacturing got -2% on the same indicator (European Central Bank, 2012) and the region's GDP stood at 1,5% (Eurostat, 2012).
In Portugal we found, in the data available by INE (national institute of statistics) for 2010, that the national IT expenditures have been increasing in recent years and have been even higher than the European average. For example, IT spending in Portugal represents 4.3% of GDP, while in Europe it weighs only 2.8%. This fact derives from the delay in the technological park of the Portuguese business context, the investments made by the public sector to ensure better services to citizens and from the increase of the competitiveness of our companies that have managed to enhance their exports, which has allowed the industry to continue to register positive growth rates compared to other national activities.
Thus, we can say that in Portugal, the industry has evolved very significantly, comprising cases of worldwide success. For example, Altitude Software and Critical Software are leaders in call centres and in safety critical systems, respectively. Therefore, we consider of the utmost importance to analyse a sector in Portugal that goes against the national trend, continuing with good prospects for growth, both in the domestic and foreign markets. The definition of information technology industry is not uniform in the diverse literature on this topic. Therefore, in this study we chose to follow the concepts proposed by two entities of international reference in this field of business: European Observatory of Information Technologies, commonly referred by its British acronym "EITO - European Information Technology Observatory"; and “IDC - Analyze the Future”, which is the world leader in market research in information technology.
Generically, both organizations consider within the IT industry, companies that engage in business hardware, software and various associated services, encompassing both the production and marketing of various types of products included in each type of business. Therefore, the study population includes the companies that produce and commercialize the various hardware, such as servers, personal computers, peripheral devices (printers, scanners, barcodes, etc.), software (either packaged or custom made and provide the various services required for the implementation and integration of the various components (maintenance, installation, training, integration and strategic consulting in the area of information systems).
Under revision 2.1. of the Classification of Economic Activities (NACE), in which firms in the sample were also identified in the database used (SABI - the Iberian Balance Sheet Analysis System) when collecting data, the scope of the sector is defined in the following classifications:
Subclass 51840 - Wholesale of computers, peripherals and software, which includes, for example, the large national distributors;
The International Journal of Management Science and Information Technology (IJMSIT) Special Issue: 2014 Spanish-Portuguese Scientific Management Conference (114 - 132)
118
ISSN 1923-0265 (Print) - ISSN 1923-0273 (Online) - ISSN 1923-0281 (CD-ROM), Copyright NAISIT Publishers 2015 Division 72 - Informatics and related activities, which includes most companies because, currently, competitors
present an integrated offering of hardware, software and services, opting for an activity code in the services provision.
3. Research objectives
This research aims to study the determinants of the financial structure of companies in the information technology industry, i.e., to assess on what variables influence the use of debt or equity in financing the activity. To this end, we considered the various theories developed over time on this issue and accordingly, were defined some specific research objectives, that propose to determine the application of the discussed theories to explain the capital structure in this type of companies. Thus, we want to observe:
Based on the work of Modigliani and Miller, if companies have in reference the effect of financial leverage in the decision on the financial structure;
If the potential tax effect gained with debt or with non payable costs (depreciation and amortization, impairments and provisions) has an impact on the decision of financing;
If the risk associated with the business and the costs related with a greater chance of failure affect the financial structure;
If the agency costs and more specifically, the visibility and asset specificity, influence the financial structure; If information asymmetry causes a hierarchy of sources for financing the activity;
If the strategy implemented by companies and the resources used in the activity have an impact on financial structure.
Now, we will present in detail the research hypotheses to study.
4. Research hypotheses and variables used
Considering the various theories studied, and their order of presentation throughout the literature review, we will formulate the hypotheses under discussion, which aim to identify some of the determinants of companies capital structure in the industry of information technologies.
The Effect of Financial Leverage of Modigliani and Miller (EFL)
EFL = ROI – Financial Cost
Modigliani and Miller (1958) demonstrated that through the effect of financial leverage, the company may, in the financing decision, condition the return generated for the owners. So, whenever the profitability created by the firm’s activity is greater than the financing cost of debt capital, the manager should choose external funding sources thus releasing more surpluses and simultaneously decreasing the volume of investment of the owners, generating greater profitability per monetary unit invested.
To determine the ROI (Return on Investment), we consider, over the net asset value, the net income without financial leverage (operating profit + financial + extraordinary results, duly adjusted from the tax effect) that represent the flows generated by the company's global activities (Neves, 2012). Regarding the cost of financing, it was determined by the relationship between financial costs and liabilities.
As such, the first research hypothesis relates the profitability generated by the activity (ROI) with the cost of financing of companies in the information technology industry.
Hypothesis 1: The greater the difference between the returns generated and the cost of financing, the greater the weight of liability in financing sources.
The International Journal of Management Science and Information Technology (IJMSIT) Special Issue: 2014 Spanish-Portuguese Scientific Management Conference (114 - 132)
119
ISSN 1923-0265 (Print) - ISSN 1923-0273 (Online) - ISSN 1923-0281 (CD-ROM), Copyright NAISIT Publishers 2015
- Effective Tax Rate (ETR)
ETR = Income Tax (IRC) / (Net Income + IRC)
Haugen and Sebent (1988) related this variable to the trade-off theory. According to the authors, a positive relationship between the tax rate on income variable and the debt ratio was found. The consideration of interest for tax purposes, provides an incentive to use more debt. However, high tax rates lead to a decrease in the internal funds and an increase in the cost of capital, and may lead to a negative relationship between the debt ratio and the average tax rate variable. This variable can be calculated as the income tax divided by net income plus IRC. Years later Booth, Aivazian, Dermiguc-Kunt and Maksimovic (2001) and Antoniou, Yilmaz and Krisha (2002) also confirmed the positive relationship between the effective tax rate and the level of indebtedness. Thus, the hypothesis test is as follows:
Hypothesis 2: The effective tax rate has a positive relationship with the level of debt.
- Other Tax Benefits (OTB) besides Indebtedness
OTB = Log (annual amortization, impairments and provisions)
DeAngelo and Masulis (1980) also correlated this variable with the trade-off theory. According to the authors, a negative relationship between the variable OTB and the debt ratio was found. The value of a company depends, in addition to economic factors, on the capital structure adopted by firms (DeAngelo & Masulis, 1980).
This variable can be calculated in various ways, however, we have chosen to calculate the logarithm of the non payable costs (Gama, 2000) so as to not constrain the research results, since most of the remaining study variables are presented as percentage values, which imply that they are much lower than the absolute values of the cost items considered.
The works of Kim and Sorensen (1986), Gama (2000), Bontempi (2002), validated the hypothesis of DeAngelo and Masulis (1980). Furtehrmore, Bradlye, Jarrel and Kim (1984), Friend and Lang (1988), and Michaelas, Chittenden and Poutziouris (1999) conclude that there is a positive effect between the variable OTB and the debt ratio. The authors explain this result by increasing these items with the investment made, which translates into increased profits. This increase causes a higher tax liability, which determines the need for additional debt to get more tax savings.
Thus, assuming that the financing decision is conditioned by the intended fiscal effect, we believe that the higher the deductible non payable costs accepted by the tax authorities are, the smaller the propensity to indebtedness should be, since it is not essential to obtain tax savings. As such, the hypothesis test is as follows:
Hypothesis 3: The level of indebtedness of the company is negatively associated with other tax benefits, other than debt.
Costs of Bankruptcy
Under the bankruptcy costs, we consider four independent variables: financial cost, risk, size and weight of tangible assets.
- Cost of Financing (CF)
CF = Financial Costs / Liabilities
In the development of the trade-off theory, researchers argue that from a certain level of indebtedness on, profitability for owners decreases as the level of financial risk of the company increases, being this reflected in the costs of debt capital. This derives from the so-called bankruptcy costs; as they rise, it becomes more costly to pay to credit institutions and this decreases the percentage of profitability created for the shareholders. Thus, the following research hypothesis purports to relate the weight of the liability with the costs of financing (Myers, 1984).
The International Journal of Management Science and Information Technology (IJMSIT) Special Issue: 2014 Spanish-Portuguese Scientific Management Conference (114 - 132)
120
ISSN 1923-0265 (Print) - ISSN 1923-0273 (Online) - ISSN 1923-0281 (CD-ROM), Copyright NAISIT Publishers 2015
- Business Risk (BR)
BR = Pearson Coefficient of Variation = Standard Deviation of Sales / Average Sales
With regard to the business risk variable, empirical studies show divergent results for the relationship between risk and debt. One of the justifications for why some authors find a positive relationship and others find a negative relationship between the variables, relates to the difficulty of measuring risk and the formula explicitness. Thus, we use the Pearson coefficient of variation of sales (Kim & Sorensen, 1986 and Gama, 2000), given by the ratio between the standard deviation of sales over average sales. The trade-off theory suggests that firms with higher volatility (risk) of operating income or turnover have an increased probability of insolvency and therefore have less ability to use debt in their capital structures.
Empirical studies of Kim and Sorensen (1986), Michaelas et al. (1999), Mutenheri and Green (2008) show a positive relationship between risk and debt. However, most studies find a negative relation, Bradley et al. (1984), Friend and Lang (1988), Chung (1993), Cassar and Holmes (2003) and Nivorozhkin (2004), among others. However, studies of Kester (1986), Titman and Wessels (1988), Gardner and Trzcinka (1992), Boyle and Eckhold (1997), Drobets and Fix (2003) Sogorb-Mira and Garcia (2003), Deesomsak, Paudyal and Pescetto (2004), did not find statistical support between risk and debt. Thus, it is expected that firms with higher risk levels present lower levels of debt. The hypothesis test is as follows:
Hypothesis 5: The level of indebtedness of the company is negatively associated with the risk / uncertainty of their results.
- Dimension (DIM)
DIM = logarithm of turnover
Firm size has been referenced by the trade-off theory as a determinant of capital structure, because larger firms have more capacity to provide collateral guarantees and are less likely to incur costs of insolvency as stated in several studies. This reality means that larger companies have more ability to raise funds through debt capital.
Therefore, the firm’s dimension is considered as a determining factor in capital structure and is very important to study the bankruptcy costs and also the agency theory approaches (Soborg-Mira, 2005). The size variable is often measured by the logarithms of total net assets or of turnover, and studies usually determine a positive relationship between debt and size, as in the case of Barclay and Smith (1995), Rajan and Zingales (1995), Matias and Baptista (1998), Jong and Veld (2001), Goyal et al. (2002), Cassar and Holmes (2003), Frank and Goyal (2003), Soborg-Mira (2005) and Deesomsak et al. (2004).
In this work, we opted for the use of the logarithm of turnover, due to the exploratory statistical tests we observed that the logarithm of assets had a correlation of above 80% with the logarithm of non-payable costs, used in hypotheses 3 and the weight of tangible assets within the total assets, which we will consider in the hypotheses 7. Thus, although empirical studies of Titman and Wessels (1988), Munro (1996), and Frank and Goyal (2003) find a negative relationship between size and leverage, we intend to demonstrate that in the companies of the information technology industry, the dimension favours positive debt levels, since larger firms have more capacity to provide collateral guarantees and are less likely to incur insolvency costs. So, they enjoy easier access to capital markets and pay lower interest rates (Silva, 2006). The hypothesis test is as follows:
Hypothesis 6: Firm size is positively related to the level of indebtedness.
- Capacity to Provide Collateral Guarantees (CG)
CG = Net Tangible Assets / Total Net Assets
The enterprises’ assets structure is an important factor, because it represents the effect of the collateral value of the assets in order to obtain debt. In this perspective, the higher the value of assets that can be presented as collateral to creditors, the higher the debt capacity of the company. It is expected that there will be a positive relationship between debt and the value of collateral assets of the company.
The International Journal of Management Science and Information Technology (IJMSIT) Special Issue: 2014 Spanish-Portuguese Scientific Management Conference (114 - 132)
121
ISSN 1923-0265 (Print) - ISSN 1923-0273 (Online) - ISSN 1923-0281 (CD-ROM), Copyright NAISIT Publishers 2015 To calculate this variable, studies typically use the ratio of net tangible assets over total net assets (Rajan & Zingales, 1995, Matias & Baptista, 1998, Gama, 2000 and Augusto, 2006). Note that, the researchers have also used this variable to test the pecking order theory, assuming that due to information asymmetry, it is easier for lenders to assign a value to the tangible assets. Because of this, companies with a higher value of tangible assets have easier access to debt. Other researchers, as in the case of Jensen and Mecking (1976), associate the weight of the collateral assets to the agency theory and argue that conflicts of interests between shareholders and creditors can lead to investment decisions that penalize the company.
Therefore, the authors argue that the existence of assets that can be used as collateral, increases the likelihood of issuing debt, clearly reducing the costs related to the supervision and control of that debt. Hence, many researchers advocate a positive relationship between the composition of the asset and debt levels; the larger the guarantees offered, the lower the probability bankruptcy. Most of the studies analysed, namely, Chung (1993), Rajan and Zingales (1995), Michaelas et al. (1999), Bontempi (2002), Pittman (2002), Cassar and Holmes (2003), Frank and Goyal (2003), Sogorb-Mira (2005), Fan, Titman and Twite (2012) found a positive relationship between the weight of tangible assets and debt. Conversely, only Nivorozhkin’s (2004) study found a negative relationship between the composition of assets and the debt ratio. Thus, the hypothesis test is as follows:
Hypothesis 7: The level of tangible assets is positively related to the level of indebtedness.
Agency Costs - Reputation (REP)
REP = Number of Years of Activity
Inserted in the agency costs theory, the reputation variable is understood as the image that a company conveys to the market as part of its obligations regarding its activity. Several authors argue that reputation is a valuable asset in the resolution of conflicts that must be preserved (Diamond, 1989 and Ang, 1991). For example, according to Diamond (1989), within organizations with a higher good reputation, managers express concerns about the company's image and tend to act in a more reflected manner during their financing decision process, taking into account safer projects rather than riskier projects in order to preserve the institutional image achieved.
To measure the firm’s reputation, we use the number of years of a company’s existence, as in the majority of empirical studies (Diamond, 1989, Ang, 1991, Vilabella & Silvosa, 1997, Gama, 2000), since the longevity of organizations may be an indicator of reputation built over time. A company that can survive various crises during its lifetime will be a company with greater ability to cope with its commitments, thereby facilitating access to debt. So, it is expected that there will be a positive relationship between this variable and total debt (Booth et al. 2001). Thus, the hypothesis test is as follows:
Hypothesis 8: The level of debt of a company is positively associated with its reputation before the market.
- Specificity of Assets - Intangible Assets (IA)
IA = Intangible Assets / Total Net Assets
Balakrihnan and Fox (1993) correlated this variable with the agency theory and found a negative relationship between intangible assets and the debt ratio. According to the authors, asset specificity creates problems in terms of financing through debt capital, because due to their unique characteristics, they can become difficult to apply to other businesses and serve as collateral for lenders.
This variable can be analysed through two formulas: the first uses the intangible assets over total net assets and the second uses investment in research and development over total assets. Regarding the second formula, authors Simões (2002) and Jordan, Lowe and Taylor (1998) argue that it can be associated with the innovation factor of companies. Accordingly, they found that companies that follow innovation and development strategies tend to present a lower level of debt in their capital structure.
However, many companies choose to consider the cost of research and development in the costs of the current year in order so as to be capitalized in fixed assets, which makes it difficult to identify them in the accounts. Thus, to
The International Journal of Management Science and Information Technology (IJMSIT) Special Issue: 2014 Spanish-Portuguese Scientific Management Conference (114 - 132)
122
ISSN 1923-0265 (Print) - ISSN 1923-0273 (Online) - ISSN 1923-0281 (CD-ROM), Copyright NAISIT Publishers 2015 assess the specificity of the resources used in the activity, we worked with the weight of intangible assets over total assets, a procedure also followed by many researchers (e.g., Rita & Silva, 2003).
Most of the studies analysed, in particular, Williamson (1988), Titman and Wessels (1988), Alonso (2000) and Manos, Green and Murinde (2001) pointed out that ownership of specific assets relates negatively to the level of debt. Conversely, only the study by Myers (1977) found a positive relationship between these variables. As such, we have the following research hypothesis:
Hypothesis 9: The specificity of intangible assets has a negative relationship with the level of debt.
Information Asymmetry (Pecking Order Theory) - Profitability (PROF)
PROF1 = Operating Income / Total Net Assets and
PROF2 = (Operating Income + Non Payable Costs) / Total Net Assets
It appears that there are two distinct currents that establish relationships between profitability and debt: a signalling perspective; Ross (1977) argues for a positive relationship between the variables, since an increase in the leverage ratio of a profitable company can signal a financial management quality and thus positively signal the market and provide numerous benefits, such as more favourable conditions for debt funding. In the Pecking Order Theory, Myers (1984) establishes a negative relationship, noting that the most profitable companies are those that rely less on debt, preferring self-financing. Firms prefer to finance their investments, primarily through funds retained internally and only then turn to external financing. Therefore, the higher the profitability of the company, the greater its ability to self-finance and therefore, the lesser the need for recourse to borrowing.
Profitability will be assessed taking into account two ratios commonly used in this type of research (e.g., Arias, Martínes & Gracia, 2000, Bevan & Danbolt, 2002, Teixeira, 2008 and Bougatef & Chichti, 2010): Operating results over total net assets, which is not more than the traditional way of calculating the ROI, and operating income plus non payable costs on the total net assets, which incorporates all the surplus created with the main activity in the results/earnings.
Noteworthy that the exploratory tests also revealed the impact of the use of net income without financial leverage considered in hypothesis 1, as the numerator of the ratio representing profitability. However, in addition to the high correlation with the other profitability indicators, it didn’t reveal much explanatory significance on the dependent variable, which may be justified by the fact that financial institutions take into account the other two ratios, which are easily available in the financial statements, to decide on whether or not to finance.
Most studies found a negative relationship between the ratio of profitability and the debt ratio. These are the cases of the works of Kim and Sorensen (1986), Baskin (1989), Chung (1993), Rajan and Zingales (1995), Michaelas et al. (1999), Booth et al. (2001), Hovakimian, Opler and Titman (2001), Goyal, Lehn and Racic (2002), Bevan and Danbolt (2002), Brailsford, Oliver and Pua (2002), Cassar and Holmes (2003), Frank and Goyal (2003) Nivorozhkin (2004) and Sogorg-Mira (2005). In the opposite direction, i.e., a positive relationship between the ratio of profitability and the debt ratio was only found in the study of Pittman (2002). Thus, the hypothesis test is as follows:
Hypothesis 10: The level of indebtedness of the company is negatively associated with the level of profitability.
- The Level of Activity Growth (GROWTH)
GROWTH = Annual Growth Rate of Total Net Assets
Baskin (1989) relates this variable with the pecking order theory and finds a positive relationship with debt, which will verify the hierarchy of sources of financing. The company's growth is related to the increased investment that needs to be financed. Thus, if internal funds are not sufficient to cover these needs companies are forced to seek other sources of funding. To assess the growth variable, the growth rate of the assets is normally used (Gama, 2000 and Simões, 2002). It was shown in the studies of Baskin (1989), Michaelas et al. (1999), Gama (2000), Goyal et al. (2002), Cassar and Holmes (2003), Sogorb-Mira (2005) and Fan et al. (2012), that there is a positive relationship
The International Journal of Management Science and Information Technology (IJMSIT) Special Issue: 2014 Spanish-Portuguese Scientific Management Conference (114 - 132)
123
ISSN 1923-0265 (Print) - ISSN 1923-0273 (Online) - ISSN 1923-0281 (CD-ROM), Copyright NAISIT Publishers 2015 between debt and the growth rate. However, in other investigated studies, as is the case of Gardner and Trzcinka (1992), Mehram (1992), Chung (1993), results that show a negative relationship between debt and growth rate were found. Thus, the hypothesis test is as follows:
Hypothesis 11: The level of debt of the company is positively associated with its growth level.
Strategic positioning - Activity Sector (AS)
AS = nominal variable (0 or 1) identifying the NACE codes 51840 and 72
Brailsford et al. (2002) relate this variable to the theory of strategic positioning. The authors argue that the business sector is an important feature of the capital structure of companies as these face similar market conditions and have comparable risk characteristics.
Normally, the trend of companies, although not deliberate is to follow the strategic behaviours of their competitors, and they may be subject to the same type of risk. Thus, the relationship found in studies is that exist similar levels of debts between firms in the same industry / activity sector because they face the same kind of business venture, produce similar products, have identical production costs, similar technologies and face the same regulatory framework.
Titman and Wessels (1988) analysed various types of manufacturing industries and found a negative relationship with debt in industries with very specific factors of production, because they have higher liquidation costs and a lower capability to present collateral guarantees. Therefore, they tend to have a lower level of debt. This conclusion is consistent with the theory of transaction costs (Williamson, 1988). The author argues that the most generic assets are financed by debt whereas more specific ones, tend to be financed by equity allowing owners to have more control over them.
Other studies, such as Bowen, Daley, Daley and Huber (1982), Bradley et al. (1984), Shenoy and Koch (1996) and Michaelas et al. (1999) identified a significant statistical inequality between the average levels of indebtedness among the various industry sectors. Furthermore, we find that there are empirical studies that analyse the importance of the enterprises’ activity (primary, secondary and tertiary) in defining the capital structure, and others by the business type code assigned by the classification of economic activities.
Since the industry of information technologies contains two subgroups of companies, which are classified depending on the focus of the activity as in the commercial area or services’ development, we will use a nominal variable consisting of the values 0 and 1 to identify actors with activity codes of 51840 and 72, respectively. Thus, we intend in our last research hypothesis, to test whether the specific characteristics (risk, investments, etc.) of the companies in the information technology industry, influence the level of debt in their capital structure.
Hypothesis 12: The specific characteristics of the activities affect the financial structure adopted by companies.
Dependent Variable Representative of the Level of Indebtedness
Total Debt (TD) = Liabilities / Total Net Assets
The dependent variable used will allow to observe the relationship between the level of indebtedness of our sample and the various determinants that we intend to study in the formulated hypotheses. Several empirical studies on capital structure have used total debt as the dependent variable (e.g., Rajan & Zingales,1995, Titman & Wessels, 1988, Gomes & Leal, 2000, Manos et al., 2001, Booth et al., 2001, Brito & Lima, 2004, Rita & Silva, 2003, Sogorb-Mira & Garcia, 2003, Fama & French, 2005, Ramadan, 2009 and Couto & Ferreira, 2010). We still want to emphasize, that several studies also use the weight of short-term liabilities and the medium and long term financing sources as dependent variables. In this work, we have chosen only to study the weight of the total liabilities, because we found that the short-term liabilities had a quite similar weight. This is because, through the pre-analysis of 500 companies in the study, we concluded that medium and long term indebtedness is not statistically representative (about 4%), which makes short-term liabilities relatively identical to total debt.
The International Journal of Management Science and Information Technology (IJMSIT) Special Issue: 2014 Spanish-Portuguese Scientific Management Conference (114 - 132)
124
ISSN 1923-0265 (Print) - ISSN 1923-0273 (Online) - ISSN 1923-0281 (CD-ROM), Copyright NAISIT Publishers 2015
5. Research methodology 5.1. The sample studied
The target sample of this study is represented by the 500 largest Portuguese companies in the information technology industry with reference to the criterion dimension turnover. Of the 500 companies, 341 are classified in division 72 - Computer and related activities and 159 in subclass 51840 - Wholesale of computers, peripherals and software. The data required for the research were obtained from a secondary source, the database of Iberian Balance Sheet Analysis System (SABI), which contains the economic and financial records of Iberian companies. Note that we have worked with the data concerning the financial years 2008, 2007 and 2006, since these were the years that preceded the severe financial crisis that plunged our country since 2009 and has constrained access to finance for businesses. Therefore, most recent years would certainly skew the results of the investigation. For compiling statistics, the average values for the three years of the aforementioned variables were considered. We used this procedure to make the various tests more robust, since it avoids the bias of data by abnormal results at any point of the study period.
5.2. Statistical techniques
Once we identified the dependent and independent variables and characterized the sample of our study, we now pass on to the presentation of the linear regression model that we will use. According to the objectives and taking into account researchers such as Chung (1993), Matias (2000) and Gama (2000), among others, models of multiple linear regression (MRLM) will be used to determine the significance of variables of a financial nature, as characteristics of the financial structure of information technology companies. We will use 3 models in order to study the financial structure of the industry, but also of the commercial enterprises (subclass 51840) and of service providers (division 72). In a generic way, the financial model of multiple linear regression that we will use is as follows:
12
Yi, t = β0 + Σ βk X ki, t + ε1i, t K= 1
where: Υi,t = measure of company debt in year t; β0 = constant; βk = parameter estimated by the model; Χ = vector of explicative variables; εi,t = random error.
The vector of explicative variables include the following K factors (K = 1, ... , 12): (i) Effect of financial leverage; (ii) Effective tax rate; (iii) Other tax benefits; (iv) Cost of financing; (v) Business risk; (vi) Dimension; (vii) Collateral guarantees; (viii) Reputation; (ix) Intangible assets; (x and xi) Profitability; (xii) Growth; (xiii) Activity sector.
In addition, we wish to emphasize that the regression models used were subject to the following tests proposed by Pinto and Curto (1999) to validate their use: linear regression between the variables in the model held by the graphical analysis of residuals and value estimates of the dependent variable; variance homogeneity, in order to verify the absence of heteroscedasticity; normality of errors was checked by graphic representation and by the Jarque-Bera test; multicollinearity was verified through the observation of Pearson correlation coefficients.
6. Analysis and discussion of results
At this point, we analyse if the statistical outputs confirm the previously formulated hypotheses and discuss if the results obtained meet up with the theories of capital structure.
Firstly, according to the previous end point of the study, the three regression models performed were subject to various tests to validate their intended use. We obtained the following results:
Linearity of the relationship between the variables of the model: no linear relationship between the residuals and the estimated values of the dependent variable has been detected;
Variance homogeneity: with the exception of the model used under subclass 51840 where homogeneity was found, in the other two models heteroscedasticity was detected. We carried out the White Test to verify the
The International Journal of Management Science and Information Technology (IJMSIT) Special Issue: 2014 Spanish-Portuguese Scientific Management Conference (114 - 132)
125
ISSN 1923-0265 (Print) - ISSN 1923-0273 (Online) - ISSN 1923-0281 (CD-ROM), Copyright NAISIT Publishers 2015 significance of the variables with robust standard deviations. Only in the model of division 72, was it observed that the business risk was no longer significant (p-value = 0.12);
Normality of errors: none of the models had a normal distribution, which was due to the existence of 3 outliers. In this sense, models without outliers were developed but the results remained the same. However, given the size of the sample (in all cases, greater than 100 firms), we consider the results as robust (Moutinho & Hutcheson, 2008);
Multicollinearity: the observation of the Pearson correlation coefficients, has shown that in the final model there was no relationship between variables that could question the validity of the models. According to Moutinho & Hutcheson (2008) this only happens when there is a correlation between the variables exceeding 80%. However, in the initial models containing all the independent variables studied, it was found that the effect of financial leverage (hypothesis 1), represented by the difference between ROI and CF had a high negative correlation with the cost of financing (hypothesis 4) in the models of industry and of the division 72, and a high positive correlation with profitability (hypothesis 10) in the model of subclass 51840. Accordingly, and with reference to its lowest correlation with the dependent variable, we removed the effect of financial leverage of the final models studied.
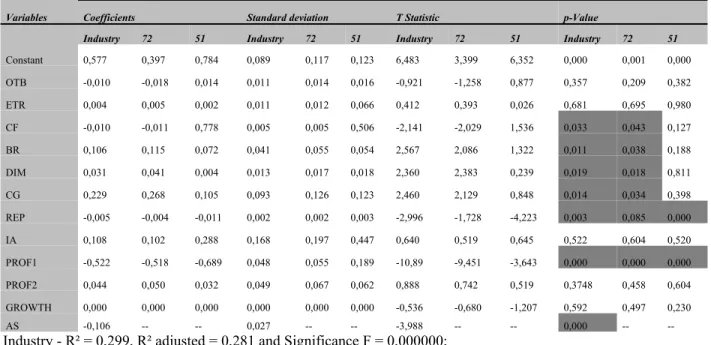
In the following table, we present the results, related to the industry and to the different sub-sectors studied (division 72 and subclass 51840).
Table 1: Results of regression models
Variables Coefficients Standard deviation T Statistic p-Value
Industry 72 51 Industry 72 51 Industry 72 51 Industry 72 51
Constant 0,577 0,397 0,784 0,089 0,117 0,123 6,483 3,399 6,352 0,000 0,001 0,000 OTB -0,010 -0,018 0,014 0,011 0,014 0,016 -0,921 -1,258 0,877 0,357 0,209 0,382 ETR 0,004 0,005 0,002 0,011 0,012 0,066 0,412 0,393 0,026 0,681 0,695 0,980 CF -0,010 -0,011 0,778 0,005 0,005 0,506 -2,141 -2,029 1,536 0,033 0,043 0,127 BR 0,106 0,115 0,072 0,041 0,055 0,054 2,567 2,086 1,322 0,011 0,038 0,188 DIM 0,031 0,041 0,004 0,013 0,017 0,018 2,360 2,383 0,239 0,019 0,018 0,811 CG 0,229 0,268 0,105 0,093 0,126 0,123 2,460 2,129 0,848 0,014 0,034 0,398 REP -0,005 -0,004 -0,011 0,002 0,002 0,003 -2,996 -1,728 -4,223 0,003 0,085 0,000 IA 0,108 0,102 0,288 0,168 0,197 0,447 0,640 0,519 0,645 0,522 0,604 0,520 PROF1 -0,522 -0,518 -0,689 0,048 0,055 0,189 -10,89 -9,451 -3,643 0,000 0,000 0,000 PROF2 0,044 0,050 0,032 0,049 0,067 0,062 0,888 0,742 0,519 0,3748 0,458 0,604 GROWTH 0,000 0,000 0,000 0,000 0,000 0,000 -0,536 -0,680 -1,207 0,592 0,497 0,230 AS -0,106 -- -- 0,027 -- -- -3,988 -- -- 0,000 --
--Industry - R² = 0,299, R² adjusted = 0,281 and Significance F = 0,000000; Division 72 - R² = 0,278, R² adjusted= 0,254 and Significance F = 0,000000; Subclass 51 - R² = 0,219, R² adjusted = 0,16 and Significance F = 0,000101.
With regard to the effect of financial leverage (EFL), representative of research hypothesis 1, and as mentioned above, it showed a very strong relationship with the financing cost and ROI (indicator used in the context of hypothesis 10) and was therefore removed from the final regression models. However, in order to determine its impact on capital structure, we leave a comment regarding to the statistical models that were originally worked.
The International Journal of Management Science and Information Technology (IJMSIT) Special Issue: 2014 Spanish-Portuguese Scientific Management Conference (114 - 132)
126
ISSN 1923-0265 (Print) - ISSN 1923-0273 (Online) - ISSN 1923-0281 (CD-ROM), Copyright NAISIT Publishers 2015 Thus, the effect of financial leverage was a significant variable and presented a negative coefficient. Modigliani and Miller (1958) showed that when the profitability of the activity outweighs the financial cost, companies should opt for financing through debt, in order to optimize the return for the owners. However, it was found that in practice the reverse is true, i.e., the higher the yield, the lower the debt.
For the remaining independent variables that appear in the final multivariate linear regression, we present the main results and implications for explaining the capital structure of the information technology industry.
Taking into account the level of significance as reference for data analysis, only statistically significant variables should be considered: Cost of financing (CF), Business risk (BR), Dimension (DIM), Collateral guarantees (CG), Reputation (REP), Profitability (PROF) and Activity sector (AS). It’s also important to refer, that values in the order of 30% for the adjusted R2 coefficient in the models of industry and of division 72 were found, which means that
about 30% of the variation in the dependent variable (Total Debt) can be explained by the independent variables. The exception for the lowest value of the adjusted R2 (16%), was found in the model of commercial companies
(subclass 51840), with only two variables considered as statistically significant: Reputation (REP) and Profitability (PROF). Now we present a more detailed analysis of the relationships between the independent variables tested and the level of indebtedness.
The results regarding the two variables effective tax rate (ETR) and other tax benefits than debt (OTB), were never statistically significant in the estimated models to explain the financial structure of companies in the IT industry. Although, if they cannot verify hypotheses 2 and 3 of our research study, we should highlight the fact that the coefficient of OTB was negative, except in the case of subclass 51840, and that that of ETR was positive, meeting the assumptions that guided each one of the hypotheses. That is, firms with other tax benefits may tend not to borrow as much as those that are subject to higher corporate tax rates which may resort more to financing in order to obtain tax savings.
With regard to the variable cost of financing (CF), it appears that companies that have less financing costs have an increased possibility of obtaining debt capital, i.e., contradicting the insolvency costs theory. Therefore, considering the statistical values observed, hypothesis 4 which states that the greater the financial cost, the greater the weight of the liabilities in the financing activity, is not confirmed. This fact may be associated with long cycles of the firms’ exploration activity, since it is common to have high average receipts periods and of stock rotation, which have implications in increasing the need for funding at business actors, leading to a diversification of financing sources and a stabilization of the financial cost compared to the total liabilities negotiated.
The results regarding the business risk variable (BR), are statistically significant but opposite in sign to that of what was expected, because there is a positive relationship between risk and total indebtedness. Thus, it also does not confirm hypothesis 5, which states that the level of debt of the company is negatively associated with the risk / uncertainty of their results. This opposite sign can happen, because companies that have higher volatility (risk) of turnover, access more indebtedness, to suppress any negative changes in the activity. This fact is in agreement with the arguments of Myers (1977), which stated that debt may be positively associated with risk.
In respect to the variable dimension (DIM), there is hypothesis 6, which states that firm size is positively related to the level of debt, which meets the theory of bankruptcy costs (trade-off), as stated by Fan et al. (2012), for example. As such, firm size is an important factor for business, because it allows a greater ability to provide collateral and less likely to incur in insolvency costs. This fact means that larger companies have greater bargaining power to negotiate loans.
The results for the collateral guarantees of assets variable (CG) are statistically significant and positively related with the level of debt, as in the studies of Gama (2000) and Augusto (2006). This confirms hypothesis 7, meeting the principles of the bankruptcy costs and agency theories (Sogorb-Mira, 2005 and Fan et al., 2012), who see tangible assets as an assurance to facilitate financing through debt capital.
The results of the reputation variable (REP) are also statistically significant and have a negative coefficient, contrary to the expected signal. Thus, it appears that younger firms have a higher level of total debt that older firms in the industry. So, this does not confirm hypothesis 8, which states that the level of debt is positively associated with the reputation in the market. Gama (2000) also found a negative relationship between total debt and younger firms, justifying this relationship because younger companies have fewer resources to cope with their investments and older firms finance through equity, since they are already known in the market and have a greater accumulation of earnings.
The International Journal of Management Science and Information Technology (IJMSIT) Special Issue: 2014 Spanish-Portuguese Scientific Management Conference (114 - 132)
127
ISSN 1923-0265 (Print) - ISSN 1923-0273 (Online) - ISSN 1923-0281 (CD-ROM), Copyright NAISIT Publishers 2015 Regarding the intangible assets variable (IA), the results are not statistically significant and don’t contribute to explain the financial structure of companies in the IT industry. Therefore, they don’t verify hypothesis 9.
The results of the variable profitability (PROF1) are statistically significant and have a negative coefficient, as in the studies of Cassar and Holmes (2003), Frank and Goyal (2003), Nivorozhkin (2004) and Sogorg-Mira (2005) who found an identical sign. So this clearly confirms hypothesis 10 which states that the level of debt of the company is negatively associated with its level of profitability, confirming the theory of asymmetric information (more specifically, the Pecking Order Theory). The companies under study, prefer to finance investment, primarily through resources retained internally and only then, with external finance. Therefore, the higher the profitability of the company, the greater its ability to self-finance and therefore, the lesser the need to recourse to borrowing. Note that the second indicator used to measure profitability (PROF2 = (Operating profit + costs not payable) / Total net assets)) in addition to not being significant, presents a positive coefficient relating to the dependent variable. However, these results were due to the correlation with the variable PROF1, for if we were performing models with only one of the representative variables for profitability, both prove significant and have negative coefficients. As for the growth variable (GROWTH), the results are not statistically significant and therefore we consider it is not related to the financial structure of companies in the information technology industry. So, we can’t verify hypotheses 11.
Finally, the analysis of the variable designated as activity sector (AS) was still considered. We used a nominal variable (0 and 1) that identified the subclass 51840 and division 72, which generally constitute the industry under study. The results observed are statistically significant and present a negative coefficient. This confirms hypothesis 12 which states that the specific characteristics of the activity (subclass 51840 or division 72) determine the financial structure adopted by companies. In this sense, the results indicate that commercial enterprises (subclass 51840) rely more on debt.
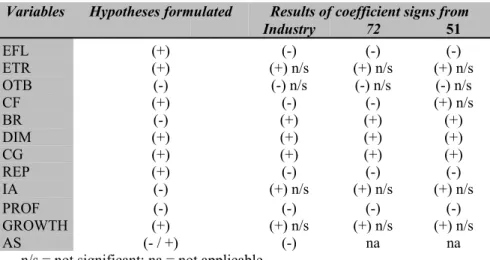
In conclusion, we found that the independent variables can explain the industry and business of division 72 better, given the specificities of subclass 51840. Thus, we have found that in the latter type of companies only reputation and profitability were relevant to explain their financial structure, while at the industry and division 72 levels, it was observed that the level of indebtedness was influenced by several factors: financial costs incurred, business risk, size, tangible assets, reputation, profitability and type of activity sector. Below, we present a table with a summary of the signals recorded in the study compared with those expected according to the different financial theories. Through the models used, the study confirmed the importance of most variables (only variables associated with fiscal management, intangible assets and growth were not significant), but on the other hand, not all the signs coincided with those expected, contradicting some of the financial theories studied, including hypotheses 4 and 8.
Table 2. Summary of the hypotheses tests
Variables Hypotheses formulated Results of coefficient signs from
Industry 72 51 EFL (+) (-) (-) (-) ETR (+) (+) n/s (+) n/s (+) n/s OTB (-) (-) n/s (-) n/s (-) n/s CF (+) (-) (-) (+) n/s BR (-) (+) (+) (+) DIM (+) (+) (+) (+) CG (+) (+) (+) (+) REP (+) (-) (-) (-) IA (-) (+) n/s (+) n/s (+) n/s PROF (-) (-) (-) (-) GROWTH (+) (+) n/s (+) n/s (+) n/s AS (- / +) (-) na na
n/s = not significant; na = not applicable