Abstract – Through the use of input-output analysis and the system of national account, this paper presents new methodological insights in ways to estimate and to measure the Agribusiness GDP of a nation. The GDP of the Agribusiness is also estimated for two major com-plexes: a) Vegetal Products and b) Animal Products. Each of the Agribusiness complexes is divided into four components: a) input to agriculture; b) agriculture; c) agriculture based industry; and d) final distribution. Using data for the Brazilian economy it was possible to measure the GDP of Brazilian Agribusiness, which were estimated to be around 27% of the Brazilian GDP in 2000.
Key Words: Agribusiness, GDP, Input-Output
1. Introduction
The discussion on the economic development on the impacts on sectorial activities of the economy in capitalistic countries has
ESTIMATING AND MEASURING THE
AGRIBUSINESS GDP AN APPLICATION TO
THE BRAZILIAN ECONOMY, 1994 TO 2000
*Maria Cristina Ortiz Furtuoso1
Joaquim José Martins Guilhoto2
*The results presented here are part of a project being conducted at the Center for Ad-vanced Studies in Applied Economics at the University of São Paulo (CEPEA-USP) under the financial support of the Brazilian National Confederation of Agriculture (CNA) and which is direct to define new methodologies to measure and to study the role of the Agribusiness in the Brazilian economy as a whole as well as in its regions. We would also like to acknowledge the partial financial support provided by CAPES, that made possible to present a previous version of this paper at the 13th International Conference on Input-Output Techniques, in Macerata – Italy, and we would also like to thank the comments received at this meeting.
1 Doctor, University of São Paulo, Brazil. 2 Doctor, University of São Paulo, Brazil.
Applications Laboratory (REAL), Universidade de Illinois, USA. Senior authorship is equally shared.
historically focussed on long-enduring trends of the transforming process of the society based on urban-industrial activities in which the role of the primary sector is to transfer capital, labour, and to generate foreign exchange for importing of capital goods, as ob-served by Bacha & Rocha (1998). According to this traditional concept, the vegetal/animal sector gradually becomes relatively less important in the composition of the Gross Domestic Product (GDP) of the economies, taking over a secondary role in the eco-nomic process of the countries.
This traditional and stationary formula of the area, however, has been more and more set aside by economic analysts in favor of a systemic view of the vegetal/animal sector, inserting the new dy-namics of the rural sectorial transformation including the integrat-ing approach of production chain – the agribusiness -, a reflex of profound structural changes in world economy (Streeter et al, 1991; Furtuoso, 1998).
Along the past decades, the vegetal/animal sector, follow-ing up these transformations, has evolved and become more mod-ern, inserted into the market economy, forming complex storing, processing, industrialization and distribution networks, with an in-creasing consolidation of the agriculture/industry relationship and deepening of technological, productive and financial relations. Ba-sically this process resulted in the structuring of a modern industrial park providing capital goods and input for that area, a sector called the rising tides of the farm. On the other hand, the ebb tide sector was formed, including the segments accounting for industrializa-tion and distribuindustrializa-tion.
favoring new markets allowing larger exports, generating income and taxes for the country, as observed by Lauschner, 1993; Santana, 1994, and others.
In that scenario, this paper intends to measure the Brazilian agribusiness GDP in the period comprising 1994-2000, decomposing these estimates into two major subcomplexes – agriculture and ani-mal products – which form this economic segment, as well as to de-tect the participation of the processing sectors (agriculture-based in-dustry) composing the Brazilian agribusiness, in order to identify some courses of its development, especially in the process of intensifica-tion of the commercial opening and structural changes characterizing the period under analysis.
Next section describes the methodology adopted in the process of measuring the agribusiness GDP, incorporating a methodological approach that eliminates the issue of double counting usually found in these estimates. The following sections present the results of the Bra-zilian agribusiness calculation with conclusions and final implications.
2. Conceptual and methodological Aspects
Agribusiness is formally defined as a set formed by suc-cessive activities attached to the production and transformation of vegetal/animal and forest products (Muller, 1989). This set of ag-ricultural and industrial activities is interdependent although het-erogeneous as to the importance degree in the evolution of the complex. This definition was named “agribusiness” by Davis & Goldberg (1957), who described it as the “total sum of the agricul-tural operations and distribution of agriculagricul-tural supplies; the op-erations of production in a farm; and storing, processing and dis-tribution of agricultural products and items produced thereof”. In Brazil, the systemic approach was first adopted by Araújo et al (1990).
One must emphasize, however, that although the systemic approach in agriculture is increasingly more widespread in the litera-ture of economics, the adopted methodological formulations are
flicting, resulting in unlike values on the contribution of the segment to the formation of the Gross Domestic Product (Farina, 1988; Montoya & Finamore, 2001).
Using the macroeconomic concepts as adopted in the National Accounting System, Nunes & Contini (2000) measured the GDP of the Brazilian agroindustrial complex of 1996. CAI’s activities and products ranked as agroindustry and services were separated as ac-tivities Exclusive to CAI and Partially Belonging to CAI. For the activities with non-CAI predominance, one considered only the pro-portion of input originated from CAI for the production value and intermediary consumption. For prevailingly non-CAI activities only the proportion of CAI-deriving input to the production value and of the intermediary consumption was considered. For prevailingly CAI product activities, the ones not belonging to it were subtracted, adopt-ing the same proportionality procedure.
The concern with the need for an improved methodology to measure this important business branch as well as the real magnitude of its GDP in the post-Real period is the reason of this research. Know-ing this economic indicator is fundamental, as a subsidy, to economic policy makers and decision takers in governmental and private scopes. For the analysis of the Brazilian agribusiness covering the 1994-2000 period one used the input-output matrix, developed by Leontif (1951), which is integrated into the national accounts system. Besides measuring the Agribusiness as whole for the economy, in this paper the Agribusiness was also measured for two major com-plexes: Vegetal Products and Animal Products. Further methodologi-cal discussions on the estimation of the Agribusiness Complex can be found on the works of Furtuoso (1998), Furtuoso, Barros and Guilhoto (1998), and Guilhoto, Furtuoso, and Barros (2000).
The total GDP value of the Agribusiness in each complex will also be divided into 4 aggregates: I) inputs; II) the sector itself; III) industrial processing; and IV) distribution and services.
methodol-ogy presented by the System of National Accounts defined by the United Nations (SNA, 1993), where the input-output matrices are in-tegrated in this system.
The value added at market prices is given by the sum of the value added at basic prices with indirect net taxes less the financial dummy, resulting in:
VAPM = VAPB + INL – FDu (1)
where:
VAMP = Value added at market prices
VABP = Value added at basic prices INT = Indirect net taxes
FDu = Financial dummy
To estimate the GDP of Aggregate I (input for vegetal and
animal production) one uses the information available in the input-output tables regarding the input values acquired by the Vegetal and Animal sectors. The columns with input values are multiplied by the respective coefficient of value added (CVAi).
The Coefficients of the Value Added for each sector (CVAi)
are obtained by dividing the Value Added at Market Prices (VAMP)of
a given sector by its respective output (Xi), i.e.,
(2)
Thus, the double-counting issue presented by previous Agribusiness GDP estimates in the Brazilian Economy when input values were considered, instead of the value added effectively gener-ated by it, is elimingener-ated. In that sense the GDP of the Aggregate I is
given by:
ESTIMATINGANDMEASURINGTHEAGRIBUSINESS GDP
CVA VA
X
i
PM
i
i
(3)
k = 1, 2 vegetal and animal sectors i = 1, 2, ..., 43 all the economic sectors
where:
GDP1
K= GDP of aggregate I (input) for vegetal (k=1) and
animal (k=2)
Z1k= total input value of sector i for either vegetal or animal
CVAi = value added coefficient of sector i
For the total Aggregate I we have:
GDP1 = GDP
11 + GDP12 (4)
where:
GPD1= GDP of aggregate I
and the other variables are as previously defined.
The estimates for the Aggregate II (the sector itself, vegetal
and animal) considers the value added generated by the respective sectors, subtracting the values used as input from the value added of these sectors, thus the double-counting issue found in the previous Agribusiness GDP estimates for the Brazilian economy is again elimi-nated. Then one has:
where:
= GDP of aggregate II for vegetal (k = 1) and animal (k = 2)
and the other variables are as previously defined. For the total Aggregate II we have:
GDPII = GDPII1 + CDPII2 (6)
where:
GDP11k = GDP of aggregate II
and the other variables are as previously defined.
To define the composition of the Aggregate III (agriculture
based industries) several indicators were adopted as for instance: a) the main demanding sectors of agricultural products obtained by in-put-output matrix estimation; b) the share of agricultural input in the intermediate consumption the agroindustrial sectors; and c) the eco-nomic activities carrying out the first, second and third transforma-tion of agricultural raw materials. In this way, the agriculture based industries are the following activities: i) Wood and Wood Products; ii) Pulp, Paper and Printing; iii) Processing of Chemical Elements (Alcohol); iv) Textile; v) Clothing; vi) Footwear, Leather and Skins; vii) Coffee Industry; viii) Vegetal Products Processing; ix) Animal Slaughtering; x) Dairy Industry; xi) Sugar Industry; xii) Vegetal Oil Processing; and xiii) Other Food Products.
The input-output matrix data for 1995 shows that out of the total output of vegetal and animal production for intermediary purposes, 21.8% is absorbed by the rural sector, 71.8% is sold to the agriculture based industries and only 6.4% is designated to the remaining sectors. In the estimation of Aggregate III (Agriculture Based
Indus-tries) one adopted the summation of the value added generated by the agroindustrial sectors subtracted from the value added of these
tors that have been used as input in the Aggregate II. As previously mentioned, this subtraction is done to eliminate the double-counting found in previous Agribusiness GDP estimates, as so, one has that:
(7)
k = 1, 2
where:
CDPIIIk= GDP of aggregate III for vegetal products (k = 1)
and animal products (k = 2)
and the other variables are as previously defined.
For the total Aggregate III we have:
GDPIII = GDP
III1 + GDPIII2 (8)
where:
CDPIII = GDP of aggregate III
and the other variables are as previously defined.
In the case of Aggregate IV, regarding the Final
GFD – INTFD – IPED = DFD (9)
VATMP + VACMP + VASMP = TM (10)
(11)
where:
GFD = global final demand
INTFD= indirect net taxes paid by the final demand
IPFD= imported products by the final demand
DFD = domestic final demand
VATMP = value added of the transportation sector at market prices
VACMP = value added of the commerce sector at market prices
VASMP = value added of the service sector at market prices
TM = trading margin
FDk = final demand of vegetal (k =1) and animal (k =2)
FDq = final demand of the agroindustrial sectors
= GDP of aggregate IV for vegetal (k =1) and animal (k =2)
For the total Aggregate IV we have:
GDPIV = GDP
IV1 + GDPIV2 (12)
where:
GDPIV= GDP of aggregate IV
and the other variables are as previously defined.
The Agribusiness GDP for each sub-complex is given by the sum of its aggregates as:
GDPAgribusiness
k = GDPIk + GDPIIk + GDPIIIk (13)
where:
GDPAgribusiness = GDP of the agribusiness for vegetal products (k =1)
and animal products (k =2)
and the other variables are as previously defined.
The total Agribusiness GDP is given by:
GDPAgribusiness= GDPAgribusiness
1+ GDPAgribusiness2 (14)
where:
GDPAgribusiness = Agribusiness GDP
and the other variables are as previously defined.
The methodology described above is showed in Figure 1. In this way, the Agribusiness GDP can be obtainable either by the weighed sum of the aggregates GDP or by the weighed sum of the GDP of the Vegetal and Animal Products.
Figure 1. Obtaining the Agribusiness GDP.
3. The Brazilian Agribusiness, 1994 to 2000
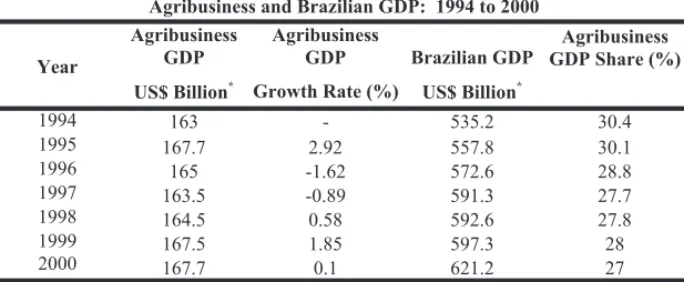
The results for the Brazilian Agribusiness point out the im-portance that such complex has played in the national economy, ac-counting for approximately 27% of its GDP in 2000.
Table 1 presents the shares of the Agribusiness GDP in the Bra-zilian economy for the 1994-2000 period. The BraBra-zilian Agribusiness GDP accounted for 30.4% of Brazil’s GDP in 1994, having a declining trend until 1997 (27.7%). These numbers of agribusiness GDP partici-pation in the National GDP differ from the 20.6% estimated by Nunes & Contini (2000). Although the work by ABAg derives from the same calculation bases as this paper, the input-output matrix of 1996–IBGE, these differences are explained by distinguished methodological issues. In order to calculate the Brazilian agribusiness in this paper, one adopted the methodology by Guilhoto et al (2000), representing a consolidation of several methodological procedures used for this type of calculation,
AgriculturaDist. e Serv.IndústriaInsumosIndústriaInsumosPecuáriaPIBAgronegócio PIB Agricultur
ESTIMATINGANDMEASURINGTHEAGRIBUSINESS GDP
1 - Input
2 - Vegetal Products 3 - Industry 4 - Dist. & Serv.
besides introducing procedures that eliminate the issue of double count-ing found in these estimates.
The GDP of the Brazilian Agribusiness for 2000 was estimated to be US$ 167.7 billions. Which represent a small growth over the value observed in 1994 (US$ 163.0 billion) and being the same value as the one observed for 1995.
The Brazilian economic development process has followed a trend of economic development of capitalistic countries presenting distinguished sectorial growth rates among agriculture, industry, ser-vices, in which the industrial and service sectors tend to have growth rates higher than agriculture, in long term.
In a dynamic agricultural sector inter-connected to the rest of the economy, linked to strong rising and ebb tides, its growth pattern becomes more complex and depending on the combination of its vari-ous components (primary, secondary and tertiary).
Although the value of the Brazilian agribusiness in the 1994-2000 period did not change in practical absolute terms, its participa-tion in the naparticipa-tional GDP tends to descend. This reducparticipa-tion occurs especially because of the dynamics of other industrial complexes and
of the service sectors. Itis important to consider the structural changes
by which the country has undergone as well as the economic opening process which marks the entire decade of the 90s and reflect on this result, since they lead the total GDP to grow more rapidly than the agribusiness GDP.
farming prices had a reduction of 41.1%, thus drastically affecting the agricultural profitability. In an economy that is open to the interna-tional trade, the valorizing of the exchange rate is a key factor to the profitability of producing activities, especially agriculture, tradition-ally turned to the foreign market.
One also observes that in this period the governmental sup-port was reduced through a lesser use of the fomenting instruments to the expansion of the Brazilian vegetal/animal production, which surely implied a retraction in the agribusiness GDP. The public sector ex-penses underwent a drastic reduction starting in 1986, as stress Bacha & Rocha (1998) and Barros (1995).
Agribusiness GDP
Agribusiness
GDP Brazilian GDP US$ Billion*
Growth Rate (%) US$ Billion*
1994 163 - 535.2 30.4
1995 167.7 2.92 557.8 30.1
1996 165 -1.62 572.6 28.8
1997 163.5 -0.89 591.3 27.7
1998 164.5 0.58 592.6 27.8
1999 167.5 1.85 597.3 28
2000 167.7 0.1 621.2 27
Source: CNA/CEPEA Research Data.
* The values for 2000 were converted from Brazilian Reais to U.S. dollars using the average exchange rate for this year. The results for the remaining time period were obtained by applying over the 2000 values the real growth rates, in Brazilian Reais, observed from 1994 to 1999.
Year
Agribusiness and Brazilian GDP: 1994 to 2000 Table 1
Agribusiness GDP Share (%)
ESTIMATINGANDMEASURINGTHEAGRIBUSINESS GDP
Table 2 shows the evolution of the Brazilian Agribusiness GDP, both in global terms (total) and for the two sub-complexes, with cor-responding segments for the 1994-2000 time period.
the prices of these products in that period. Regarding the evolution of the prices of agricultural input, Homem de Mello (1998) shows that an expressive price reduction occurred in the 1990s caused by a strong exchange valorization, by relevant tariff reductions and by expressive efficiency gains in the companies.
The total agriculture have shown declining results from 1994 through 1997, an inverse trend was recorded from 1998 to 2000. The data referring to the agricultural prices show that con-siderable reductions occurred in the 1990s. Between 1989 and 1997 the indexes of the agricultural prices dropped from 100.0 to 72.4 (Homem de Mello, 1998). In its turn, except for the year 1994, one verifies a falling trend in the relationship of received prices/paid prices in the decade, which can partially explain the behavior of the farming added value in this period. It is interest-ing to note that in 1997 favorable foreign prices of some com-modities were recorded, especially soybean. In addition,
produc-tivity gains3 occurred and the the ICMS was inserted into
agricul-tural exports (Kandir Law), which may have acted as compensat-ing variables on the agriculture in the late 1990s.
The evolution of the Brazilian Agribusiness composition also shows the high shares of the Agriculture Based Industries and the Distribution segment, showing values always above 30%. In 2000 the Agriculture Based Industries and Distribution segments had a share of respectively 33.1% and 33.2% for the total Complex.
Tables 2 to 4 show the structure of the two major complexes of the Brazilian Agribusiness – Vegetal and Animal, in 2000 the Vegetal Agribusiness GDP of US$ 115.5 billions represented 18.6% of Brazil’s GDP, while the Animal Agribusiness GDP, US$ 52.2 billions, corre-sponded to 8.4% of Brazil’s GDP. In the case of the vegetal, the higher GDP share is justified by the diversity of the agricultural sector that has a higher number of processing industries than the animal sector.
The aggregate value derived from vegetal and animal prod-ucts are made up by its output destiny, i.e.: a) inputs used in the
culture; b) inputs used by the industries; c) exported; and d) final con-sumption by the families and the government. Given the above, one has that the value of the Total Agriculture GDP in 2000 was of US$ 47.0 billions. Splitting the Total Agriculture GDP by the sub-com-plexes one has that in 2000 the total GDP for the Vegetal and Animal production was, respectively, of US$ 24.9 billions and US$ 22.1 bil-lions (Table 2).
Complex 1994 1995 1996 1997 1998 1999 2000
Agriculture 163 167.7 165 163.5 164.5 167.5 167.7
Non Ag. Input 7.6 7.2 7.4 7.3 7.7 9 9.5
Total Agriculture 46 46.8 45.3 44.7 47.5 47.4 47
Used as Input 7 6.8 6.9 6.8 7.2 7.2 7.1
Sold 39 40 38.5 37.9 40.3 40.2 39.9
Industry 54.7 58.7 56.1 56.4 53.5 54.9 55.5
Distribution 54.7 54.9 56.2 55.1 55.8 56.2 55.6
Vegetal 117.5 119.7 118.6 118.8 117.8 117.9 115.5
Non Veg. Input 5.1 4.8 5 5 5.2 6 6.2
Vegetal 27 26.8 26.9 26.8 28.2 26.8 24.9
Used as Input 4.2 4 4.2 4.2 4.4 4.2 3.9
Sold 22.8 22.8 22.7 22.6 23.8 22.6 21
Industry 46.3 49.3 46.7 47.5 44.9 46.2 46.7
Distribution 39.2 38.6 40 39.5 39.4 39 37.9
Animal 45.4 48.1 46.4 44.7 46.7 49.6 52.2
Non Anim. Input 2.5 2.4 2.3 2.3 2.4 3 3.4
Animal 19 20 18.5 17.9 19.3 20.7 22.1
Used as Input 2.8 2.8 2.7 2.6 2.8 3 3.2
Sold 16.2 17.2 15.8 15.3 16.4 17.6 18.9
Industry 8.4 9.4 9.4 9 8.6 8.7 8.8
Distribution 15.5 16.3 16.1 15.6 16.4 17.2 17.8
Table 2 - Brazilian Agribusiness GDP, 1994 to 2000 (US$ Billion of 2000*)
Source: CNA/CEPEA Research Data.
* The values for 2000 were converted from Brazilian Reais to U.S. dollars using the average exchange rate for this year. The results for the remaining time period were obtained by applying over the 2000 values the real growth rates, in Brazilian Reais, observed from 1994 to 1999.
Regarding the annual growth of the sub-complexes one veri-fies that the Animal complex was the one presenting best results in 1999 and 2000, with real growth rates of 6.19% and 5.17%,
respec-Complex 1994 1995 1996 1997 1998 1999 2000
Vegetal 72.1 71.3 71.9 72.7 71.6 70.4 68.9
Non Veg. Input 3.1 2.9 3 3.1 3.2 3.6 3.7
Vegetal 16.6 16 16.3 16.4 17.2 16 14.8
Used as Input 2.6 2.4 2.5 2.5 2.7 2.5 2.3
Sold 14 13.6 13.8 13.8 14.5 13.5 12.5
Industry 28.4 29.4 28.3 29 27.3 27.6 27.8
Distribution 24 23 24.3 24.2 24 23.3 22.6
Animal 27.9 28.7 28.1 27.3 28.4 29.6 31.1
Non Anim. Input 1.5 1.4 1.4 1.4 1.5 1.8 2
Animal 11.6 11.9 11.2 10.9 11.7 12.3 13.2
Used as Input 1.7 1.7 1.6 1.6 1.7 1.8 1.9
Sold 9.9 10.2 9.6 9.3 10 10.5 11.3
Industry 5.2 5.6 5.7 5.5 5.2 5.2 5.3
Distribution 9.5 9.7 9.8 9.5 10 10.3 10.6
Table 4 - Share in the Brazilian Agribusiness GDP, 1994 to 2000 (%)
Source: Table 2.
Complex 1994 1995 1996 1997 1998 1999 2000
Agriculture 100 100 100 100 100 100 100
Non Ag. Input 4.6 4.3 4.5 4.4 4.7 5.4 5.7
Total Agriculture 28.2 27.9 27.5 27.3 28.9 28.3 28
Used as Input 4.3 4.1 4.2 4.1 4.4 4.3 4.2
Sold 23.9 23.8 23.3 23.2 24.5 24 23.8
Industry 33.6 35 34 34.5 32.5 32.8 33.1
Distribution 33.6 32.8 34 33.7 34 33.5 33.2
Vegetal 100 100 100 100 100 100 100
Non Veg. Input 4.3 4 4.2 4.2 4.5 5.1 5.3
Vegetal 23 22.4 22.7 22.6 24 22.7 21.5
Used as Input 3.6 3.4 3.5 3.5 3.7 3.5 3.4
Sold 19.4 19.1 19.1 19.1 20.2 19.2 18.2
Industry 39.4 41.2 39.4 40 38.1 39.2 40.4
Distribution 33.3 32.3 33.7 33.3 33.5 33.1 32.8
Animal 100 100 100 100 100 100 100
Non Anim. Input 5.4 5 5.1 5.1 5.2 6.1 6.5
Animal 41.8 41.6 39.8 40 41.2 41.6 42.4
Used as Input 6.1 5.8 5.8 5.8 6 6.1 6.2
Sold 35.7 35.7 34 34.2 35.2 35.6 36.2
Industry 18.6 19.5 20.3 20.1 18.4 17.6 16.9
Distribution 34.2 33.9 34.8 34.9 35.1 34.7 34.1
Table 3 - Brazilian Agribusiness Share Inside Each Complex, 1994 to 2000 (%)
tively, in comparison with those of 0.13% and –2.03% for the Veg-etal complex (Table 5).
These results confirm the favorable performance of the Bra-zilian animal sector which has increasingly intensified meat (beef, pork, and poultry) production in this decade. Between 1993 and 2000 the production of meat, expressed as carcass weight, grew approximately 72.19%, reaching 10.3 million tons (Silva, 2001). The percent of pro-duction growth gain for poultry, pork, and beef, is respectively, 155.36%; 52.35% and 24.84%. According to Bacha & Rocha (1998), this growth is due both to the increase of the number of animals slaughtered and to the elevation of the mean yield of meat per slaughtered animal. There-fore, one verifies that these results reflect yield increments but also in-dicate a specialization in the production and commercialization. The animal sector outstand both for its total net assets and for the value added to the final product commercialized.
As to the international trade, the meat sector has shown gains and is one of the options of the exporting roll of the vegetal/animal sector. The volume of the total growth of the exported beef, pork and
poultry in natura between 1993 and 2000 was 85.77%, going from
675 to 1.254 million tons (Silva, 2001). Despite the optimistic num-ber achieved by the animal agribusiness, the growth rate recorded for the total subcomplex and for the animal production is lower than the growth accumulated in the input segment year in the 1999/2000 bien-nial, thus confirming the historical trend of income transference from producers to the industrial segment.
Considering that the Agribusiness is a segment with agents from the primary (agriculture), secondary (industry), and tertiary (ser-vices) sectors, the changes in the GDP will be a function of the rela-tive variation of its components.
The results show that out of the components considered for the estimation of the Total Agribusiness GDP in 1999, only the Total Agriculture had a negative variation of –0.11%, significantly contrast-ing with the positive performance of 6.23% reached in 1998. One can also observe that the Inputs, the Agriculture Based Industries, and Distribution had positive variations in 1999, with respectively, real growth rates of 16.87%, 2.71% and 0.61%. In 2000, however, nega-tive results were observed for the Agriculture and Distribution seg-ment, with respectively, variations of –0,90 and –0,96 (Table 5).
Considering the annual growth rates of the components of the Vegetal Agribusiness GDP one notices that only the Input and Indus-try segments had a positive performance in 1999, with growth rates, respectively, of 13.63% and 2.93%, compensating the negative re-sults of Agriculture (–5.13%) and Distribution (–1.10%). For 2000, only the industry kept a positive growth rate of 1.00% (Table 5).
Complex 1995 1996 1997 1998 1999 2000
Agriculture 2.92 –1.62 –0.89 0.58 1.85 0.1
Non Ag. Input –4.08 1.67 –1.32 5.68 16.87 6.35
Total Agriculture 1.8 –3.19 –1.42 6.23 –0.11 –0.90
Used as Input –2.02 0.46 –1.42 6.23 –0.11 –1.12
Sold 2.48 –3.81 –1.42 6.23 –0.11 –0.86
Industry 7.29 –4.39 0.57 –5.27 2.71 1.02
Distribution 0.45 2.24 –1.84 1.31 0.61 –0.96
Vegetal 1.79 –0.88 0.19 –0.88 0.13 –2.03
Non Veg. Input –5.18 3.75 –0.35 4.95 13.63 3.24
Vegetal –0.63 0.07 –0.21 5.24 –5.13 –7.14
Used as Input –4.18 3.61 –0.25 5.28 –4.96 –7.14
Sold 0.03 –0.55 –0.20 5.24 –5.16 –7.14
Industry 6.64 –5.38 1.68 –5.48 2.93 1
Distribution –1.36 3.61 –1.22 –0.24 –1.10 –2.93
Animal 5.84 –3.46 –3.62 4.44 6.19 5.17
Non Anim. Input –1.78 –2.49 –3.39 7.28 23.84 12.5
Animal 5.26 –7.56 –3.19 7.71 7.25 7.19
Used as Input 1.25 –4.07 –3.24 7.75 7.46 7.19
Sold 5.94 –8.14 –3.18 7.71 7.21 7.19
Industry 10.83 0.81 –4.94 –4.16 1.57 1.17
Distribution 5.02 –1.02 –3.38 5.23 4.74 3.49
Table 5 - Brazilian Agribusiness Growth Rates, 1995 to 2000 (%)
The drop of real prices of main agricultural products and el-evation of input prices accounted for that. Although in the 1990s an increase of agriculture productivity occurred, it was not enough to thrust the agriculture, which reached a production of only 80 million tons of grains (CAN, 2001).
Despite the negative context presented by the farming seg-ment, the Animal Agribusiness Complex showed a positive perfor-mance from 1998 to 2000. Thus, in that complex the growth rates in 1999 were respectively 23.84%, 7.25%, 1.57% and 4.74% for the in-put, animal, processing and services segments. This complex has showed a similar performance for 2000 (Table 5).
When measured by a broader concept, the sectoral GDP data from 1994-2000 allows a more accurate technical evaluation regard-ing the sectoral performance of the Brazilian Agribusiness. These results are shown in Tables 6 and 7. The activity regarding the veg-etal and animal products also includes the value of the inputs used plus the value aggregated with the distribution of the vegetal and animal products; the value for the agriculture based industries also includes the value aggregated with the distribution of the industries production. Using this broader concept, the value of the agricultural sector was responsible, in 2000, for 42.2% of Brazil’s Total Agribusiness GDP.
Concerning the agriculture sector, the decrease of the GDP value in 1996 and 1997 can be interpreted as an economic backward movement (US$65,8 billions in 1996 and US$ 64,3 billions in 1997). After this period there was a recovery in 1998, 1999 and 2000, with growth rates of 8.02%, 1.77% and 0.10%, respectively. One should point the highly positive performance of the Animal sector in the more recent period, 1998 to 2000, with growth rates of 9.55%, 8.48% and 7.71%, respectively, which certainly reflected on the positive result of the rural sector in that triennial (8.02%, 1.77% and 0.10%, respectively).
More recently, despite the not so significant growth of the Total Agribusiness GDP (1.85%) in 1999 and 2000 (0.10%), some industrial sectors managed to overcome the drawbacks and present
Sector 1994 1995 1996 1997 1998 1999 2000
Agriculture (1) 66.7 67.8 65.8 64.3 69.5 70.7 70.8
Vegetal (1) 39.4 39.1 39.2 38.8 41.6 40.4 38.1
Animal (1) 27.3 28.7 26.6 25.5 28 30.3 32.7
Wood & Wood Products(2) 8.3 8.7 8.5 8.2 7.6 7.6 7.9
Pulp, Paper & Printing(2) 7.2 9 8.4 8 7.5 9 10.6
Chemical Elem. (Alcohol) (2) 7.9 6.2 6 7.4 6.3 7.1 7.2
Textile Industry(2) 7.4 7.6 6.9 6.3 5.4 5.7 5.6
Clothing Industry(2) 8 8.4 8.3 7.4 7.1 6 5.8
Footwear Industry(2) 4.6 4.3 4.3 4.1 3.3 3.1 3
Coffee Industry(2) 3.7 3.1 3.2 3.1 4.1 4.4 4.3
Vegetal Products
Processing(2)
12.9 12.7 13.5 14.3 13.1 12.4 11.2
Animal Slaughtering(2) 9.8 10.4 10.6 10.3 10.5 11.7 11.8
Dairy Industry(2) 3.8 4.6 4.9 4.9 5 4.5 4.7
Sugar Industry(2) 2.8 2.5 2.5 2.6 2.6 2.5 2.9
Vegetal Oil Processing(2) 4.8 4.5 4.5 5.1 4.8 4.6 3.7
Other Food Products(2) 15.3 17.8 17.6 17.6 17.8 18 18.2
Total 163 167.7 165 163.5 164.5 167.5 167.7
* The values for 2000 were converted from Brazilian Reais to U.S. dollars using the average exchange rate for this year. The results for the remaining time period were obtained by applying over the 2000 values the real growth rates, in Brazilian Reais, observed from 1994 to 1999.
Table 6 - Sectoral Distribution of the Brazilian Agribusiness GDP, 1995 to 2000 (US$ Billion of 2000*)
Source: CNA/CEPEA-USP Research Data.
(1) These values refer to the sum of the aggregated value generated by: a) the sector; b) the inputs used; and c) the distribution. (2) These values refer to the sum of the aggregated value generated by: a) the industrial sector; and b) the distribution.
Sector 1995 1996 1997 1998 1999
Agriculture 1.67 –2.99 –2.20 8.02 1.77
Vegetal –0.75 0.27 –1.00 7.01 –2.75
Animal 5.1 –7.36 –3.97 9.55 8.48
Wood & Wood Products 4.99 –2.29 –2.73 –8.03 0.41
Pulp, Paper and Printing 24.85 –6.49 –5.22 –6.14 20.81
Chemical Elem. (Alcohol) –20.98 –4.02 24.67 –15.28 12.97
Textile Industry 2.3 –8.49 –9.70 –13.13 5.77
Clothing Industry 5.5 –1.43 –9.87 –5.21 –14.76
Footwear Industry –5.11 –1.19 –4.58 –19.01 –6.61
Coffee Industry –15.38 4.1 –3.58 32.11 7.09
Vegetal Products Processing –1.61 6.12 5.94 –7.90 –5.73
Animal Slaughtering 6.55 2.25 –3.43 1.96 11.67
Dairy Industry 22.38 5.8 –1.31 2.57 –9.72
Sugar Industry –7.98 –3.57 4.21 –0.13 –1.34
Vegetal Oil Processing –5.71 0.89 12.42 –6.50 –3.17
Other Food Products 16.25 –1.15 –0.27 1.06 1.51
Total 2.92 –1.62 –0.89 0.58 1.85 0.1
Source: Table 6
2000 3.76 12.91 –18.94 1.07 –1.38 –3.54 –9.88 0.84 17.94 1.18 –1.78 –4.42 0.1 –5.61 7.71 3.55
highly satisfactory results. The Pulp, Paper and Printing industry had a GDP growth of 20.81% and 17.94% in 1999 and 2000, respectively, going from US$ 7.5 billions in 1998 to US$ 9.0 billions in 1999 and US$ 10.6 in 2000 (Table 6 and 7).
In the case of the Chemical Elements (Alcohol) industry the GDP growth in 1999 was 12.97%, reaching the mark of US$ 7.1 bil-lions. In 2000, this segment had a growth of 1.18%. The Animal Slaughtering industry recorded a significant variation of 11.67% in 1999, increasing its aggregated value from US$ 10.5 billions in 1998 to US$ 11.7 billions in 1999. In 2000 the growth was only of 0.84%. The Coffee and Textile industries had growth rates of 7.09% and 5.77%, respectively, in 1999. In 2000, diverging from these results, the segments had results of –3.54% and 1.78%, respectively. Among the sectors, the poorest performance was that of the Clothing indus-try, which has been showing negative growth rates since 1996, with a reduction of 14.76%, with its GDP in 1999, going from US$ 8.4 bil-lions in 1995 to US$ 5.8 bilbil-lions in 2000. The Vegetal Oil Processing Industry is also other sector that is loosing share in the agribusiness, going from a value of US$ 4.8 billion in 1994 to a value of US$3.7 billion in 2000 (Tables 6 and 7).
The results obtained for the Brazilian Agribusiness confirm the behavior trend observed in highly industrialized economies, in which the share of the agriculture based industries and final distribu-tion tends to be more and more representative in the value of the out-put sold by farmers. In that process, the vegetal and animal sector becomes less important in the composition of the Agribusiness out-put, with a relative sector’s income decrease as can be observed in the works of Davis and Goldberg (1957), Lipton et al. (1998), Lauschner (1993), and Malassis (1968).
Through the data presented here, it is possible to see that the Brazilian agriculture is inserted into the current trend of the world’s economy by adapting itself to the situation of the consumers, concen-trated on the urban regions, with sophisticated consuming structures in which a larger participation of industrialized and diversified prod-ucts is a constant demand.
In short, the Brazilian Agribusiness adds value on the agricul-tural raw materials in which the warehousing, processing and final distribution sector tends to be more representative of the total value of the output sold to the consumer, thus dominating the agriculture/ industry relationships.
In that sense, it is fundamental to take into account the neces-sary organization of farming producers into associations, cooperatives or other alternative means to support rural producers, as it allows ru-ral workers to face the challenges of this new agrarian pattern, lead-ing to a relative reduction of the rural sector in relationship with the other Agribusiness components.
4. Final Comments
By analyzing the results presented in this paper, one can infer the complexity of the Brazilian economy, which presents an advanced stage of a productive structure with a high interlinking degree among the national productive sectors.
As to the Agribusiness results, the empirical data show the fundamental role that this segment has performed in the Brazilian economy, responsible for approximately 27% of its GDP in 2000. In re-gards to the participation structure of the two major complexes of the Brazilian Agribusiness – Vegetal and Animal – one observes that the GDP of the Vegetal Agribusiness represents, around 20% of the Brazilian GDP, while the GDP of the Animal Agribusiness corresponds to approximately 8% of the Brazilian GDP. In the case of the Vegetal, the higher GDP share is explained in great part by the diversity of the agricultural sector, which has a larger number of processing industries than the animal sec-tor. These results point out the importance and dependence of the other sectors of the economy in the agriculture, the share of 7.6%, in 2000, of the Brazilian agriculture in the national GDP is multiplied approximately 3.6 times when the Agribusiness concept is used.
As to the share of the components of the Agribusiness GDP, one observes that the input contribution tended to grow for the total complex during the analyzed period, especially in the last three years (1998 to 2000). Although the Agriculture segment has presented a de-creasing trend from 1994 to 1997 this has reversed in more recent years. The evolution of the Brazilian Agribusiness composition also shows a high share of the Industry and the Distribution segments, as each segment has a share of around 33% of the total Agribusiness chain. This confirms that the processing and final distribution sec-tors are higher impulse vecsec-tors on the total value of the output sold to consumers, consolidated on the strong net connecting agriculture and industry.
One should stress that the basic methodology adopted here is integrated into the UN System of National Accounts and at the same time prevents the double count problem presented in usual works of Agribusiness GDP estimation. Due to the use of this new methodol-ogy one believes that the results achieved provide an accurate picture of what has been happening to the Brazilian Agribusiness, so as to provide the economic agents with subsidies for decision-making, be-sides decisively contributing to the methodological improvement of this sort of research.
Despite the study made here, there are still some questions left out and that need to be uncovered, like, how to measure the con-tribution of the a given culture to the agribusiness, how the regions interact among themselves in generating the value of the agribusiness, how the agriculture can take advantage of this more advanced and integrated process of production, and what should be the future of the agriculture in this new integrated setting.
References
ARAÚJO, N. B.; Wedekin, I.; Pinazza, L. A. Complexo agroindustrial: o agribusiness brasileiro. São Paulo: Agroceres, 1990. 238 p.
brasileira, no período de 1987 a 1996. Revista de Economia e Sociologia Rural, 36(1): jan./mar. 1998.
BARROS, G. S.. C. A nova política agrícola brasileira. Preços Agrícolas, Piracicaba (99): 4-7, 1995.
DAVIS, J.; Goldberg, R. 1957, A concept of agribusiness, Harvard
University, Boston.
FARINA, E. M. M. Q. O Sistema agroindustrial de alimentos. In: ENCONTRO NACIONAL DE ECONOMIA, 16., Belo Horizonte,
1988. Anais. Rio de Janeiro: ÄNPEC, 1988. v. 3, p. 292-315.
FURTUOSO, M.C.O. 1998, O produto interno bruto do complexo
agroindustrial brasileiro, Ph.D. Thesis, Universidade de São Paulo.
GASQUES, J. G. & Conceição, J. C. P. R. Crescimento e produtividade da agricultura brasileira. IPEA, texto para discussão no 502, Julho de
1997.
GUILHOTO, J.J.M.; Furtuoso, M.C.O.; Barros, G.S.C. 2000, O
agronegócio na economia brasileira, 1994-1999, Research Report,
CEPEA / CNA, Brasília.
LAUCHENER, R. 1993, Agribusiness, cooperativa e produtor rural,
Editora da Universidade do Vale do Rio dos Sinos, São Leopoldo. Leontief, W. 1951, The structure of the american economy, 2nd
edi-tion, Oxford University Press, New York.
MELLO, F. H. Agricultura Brasileira nos anos 90: o real e o futuro.
Economia Aplicada, 2(1): jan./mar. 1998.
MONTOYA, M. A. & Finamore, E. B. Padrões de crescimento do agronegócio brasileiro no período de 1985 a 1995. In: XXXIX Congresso Brasileiro de Economia e Sociologia Rural, Anais, Recife,
2001.
MÜLLER, G. Complexo agroindustrial e modernização agrária. São
Paulo: Hucitec, 1989. 148 p.
NUNES, E.P. & Contini, E. Dimensão do complexo agroindustrial
brasileiro. Associação Brasileira de Agribusiness, outubro/2000.
ESTIMATINGANDMEASURINGTHEAGRIBUSINESS GDP
Silva, J. Z. Comportamento da atividade agropecuária após sete anos de Plano Real. Paper apresentado Sober, 2001.
STREETER, D. H.; Sonka, S. T.; Hudson, M. A. Information tech-nology, coordination, and competitiveness in the food and agribusiness sector. American Journal of Agricultural Economics, v. 73, n. 5, p.