Advancing
the People’s
Health
Advancing
the People’s
Health
A n n u a l R e p o r t o f t h e D i r e c t o r – 2 0 0 0
Advancing
the People’s
Health
Advancing
the People’s
Health
A n n u a l R e p o r t o f t h e D i r e c t o r – 2 0 0 0
Off icial Docum ent No. 298
P an A m er ican Healt h Or ganiz at ion
P an A m er ican Sanit ar y Bureau, Regional Office of the
World Health Organization
525 23rd Street, N.W.
Pan Am erican Healt h Organizat ion
ADVANCING THE PEOPLE’S HEALTH
Also published in Spanish w ith the title:
El progreso en la salud de la población. Inf orme Anual del Direct or – 2000
ISBN 92 75 37298 5
PAHO Library Cataloguing in Publication Data
Pan American Health Organization
Advancing the People’s Health. Annual Report of the Director–2000.— Washington, D.C.: PAHO, © 2000
xxii, 138 p.–(Official Document; 298) ISBN 92 75 17298 6
I. Title. II. (Series) 1. HEALTH STATUS
2. OUTCOM ES AND PROCESS ASSESSM ENT (HEALTH CARE) 3. PAN AM ERICAN HEALTH ORGANIZATION
4. HEALTH PLANS AND PROGRAM S 5. TECHNICAL COOPERATION 6. AM ERICAS
NLM WM 540
The Pan American Health Organization w elcomes requests for permission to reproduce or trans-late its publications, in part or in full. Applications and inquiries should be addressed to the Publications Program, Pan American Health Organization, Washington, D.C., U.S.A., w hich w ill be glad to provide the latest information on any changes made to the text, reprints and translations already available.
© Pan American Health Organization, 2000
Publications of the Pan American Health Organization enjoy copyright protection in accordance w ith the provisions of Protocol 2 of the Universal Copyright Convention. All rights are re-served.
The designations employed and the presentation of the material in this publication do not imply the expression of any opinion w hatsoever on the part of the Secretariat of the Pan American Health Organization concerning the status of any country, territory, city or area or of its authorities, or concerning the delimitation of its frontiers or boundaries.
The mention of specific companies or of certain manufacturers’ products does not imply that they are endorsed or recommended by the Pan American Health Organization in preference to others of a similar nature that are not mentioned. Errors and omissions excepted, the names of proprietary products are distinguished by initial capital letters.
This publication is available on-line at w w w.paho.org.
ii
Annual Report of t he Direct or–2000
iii
1Sample footnote, this sytem compiles data and indicators on demographis,socioeco-nomics statusSample footnote, this sytem compiles data and indicators on demographis, socioeconomics statusSample footnote, this sytem compiles data and indicators on de-mographis, socioeconomics statusSample footnote, this sytem compiles data and indica-tors on demographis, socioeconomics statusSample footnote, this sytem compiles data and indicators on demographis, socioeconomics status.
Annual Report of t he Direct or–2000
iii
Mission
of the
Pan American
Health Organization
The Pan American Sanitary Bureau is the Secretariat of the Pan
American Health Organization (PAHO), an international agency
specializing in health. Its mission is to cooperate technically with
the Member Countries and to stimulate cooperation among them
in order that, while maintaining a healthy environment and
chart-ing a course to sustainable human development, the peoples of the
Americas may achieve Health for All and by All.
M
is
s
io
n
To the
Member
Countries
In accordance with the Constitution of the Pan American Health
Organization, I have the honor to submit the 1999–2000 annual
report on technical cooperation activities of the Pan American
Sanitary Bureau, Regional Office of the World Health
Organiza-tion. Within the context of the strategic and programmatic
orien-tations for the 1999–2002 quadrennium, defined by the
Govern-ing Bodies of the Pan American Health Organization, the report
analyzes the salient activities of the Organization’s technical
coop-eration program during this period.
The report is complemented by the Interim Financial Report of the
Director for the Year 1999.
George A. O. Alleyne Director
Annual Report of t he Direct or–2000
Annual Report of t he Direct or–2000
vii
Contents
The Director’s Message
. . . ix
Chapter
1
:
. . . 1
Health Situation Analysis
Chapter
2
:
. . . 19
Health in Human Development
Chapter
3
:
. . . 35
Health Promotion and Protection
Chapter
4
:
. . . 57
Environmental Protection and Development
Chapter
5
:
. . . 77
Health Systems and Services Development
Chapter
6
:
. . . 97
Disease Prevention and Control
Chapter
7
:
. . . 125
Supporting the Delivery of
Technical Cooperation: The Secretariat
C
o
n
t
e
n
t
M
e
s
s
a
g
e
Annual Report of t he Direct or–2000
ix
The
Director’s
Message
Justice is the first virtue of social
institutions as truth is of systems
of thought.
Pan Am erican Healt h Organizat ion Annual Report of t he Direct or–2000
ADVANCING THE PEOPLE’S HEALTH
x
Advancing
the people’s
health
I
have fond memories of a lovely inn in Dublin where my wifeand I stayed as the guests of the Royal College of Physicians of Ireland. We came down to breakfast one morning and werere-galed by a fellow guest with stories of great Irish academics. We
were told of a professor of Classics who, when accosted by some
lesser mortal and being asked if he taught Greek, replied
haughtily, “ I do not teach Greek. I profess Greek. I advance
Greek and the knowledge of all that it stands for.” It is in that vein that I
will address the issue of advancing the people’s health. There will be the dual
approach of “ professing” health in the sense of examining what must be
done to carry forward or advance the cause of health and the knowledge of
all that it stands for. In addition, I will refer to the more traditional aspect
of examining the advances or improvements in the people’s health, what
they signify, and what must be done to see that such improvements are
maintained or accelerated.
Any consideration I make about the need for advancing the cause of
health must begin with an appreciation or conceptualization of health and
what it means to society. I admit that this sort of discussion or debate is
that all health workers, particularly those of us who work in or guide
in-ternational or national institutions, must have some sense of the
philo-sophical underpinnings of our work. I also believe that our ability to
ad-vance the cause of health must be grounded in developing sound advocacy
skills, so we can ensure that health issues are included when major policy
issues are debated.
Without a doubt, “ we the people” care about health. The largest public
opinion survey in the world, the one undertaken by Gallup International
in 1999 for the Millennium Report of the Secretary General of the United
Nations, showed that good health and family life ranked first among the
things that people valued—far outranking material possessions. It is good
for us and our fellow human beings to be healthy, but we are still a long
way away from universal acceptance of the notion that health is an
essen-tial public good that needs appropriate policy focus. Much of the attention
to health still turns around a concern for the nature of the transactions
that take place between individuals and the services that provide care.
Kaul and his colleagues1have clearly set forth the thesis that the
pop-ulation’s health may be cast as a public good. In reviewing the notion of
public goods, they characterize them as having two main features—they
are “ nonrivalrous in consumption and nonexcludable.” To explain this,
they use the analogy of traffic light systems, which can be relied on by all
to the benefit of all and to the detriment of no one; they need to be used
by everyone, and their use cannot be restricted to a few.
Population health is similar, in that the health of the population
bene-fits all and, under most conditions, no one can really be excluded. In
con-The Direct or’s M essage
xi
1Kaul I, Greenberg I, Stern MA. Global public goods.Pan Am erican Healt h Organizat ion
sidering health as a public good, attention has quite rightly been placed on
communicable diseases and the need for their surveillance, which has itself
been framed as a public good. I would agree with Kaul and his colleagues
that the state of health, in itself, should fall into this category, and indeed
much more consideration is being given now to the relationship of the health
of populations in distant countries to the security and prosperity of others
far away. Health was a public good long before we “ discovered”
globaliza-tion, but now it has been raised to the state of a global public good, and the
communication that is so much a part of globalization has strengthened that
perception.
The notion of a public good, or of any other good, always raises the
ques-tion of how to quantify the nature of the benefit. The measurement of health
status has bedeviled us constantly, which is attested to by the number and
variety of approaches that have been tried, from simply counting final
com-mon events-deaths to relying on extremely complicated indicators. In
dis-cussions about measuring phenomena or states that are as multidimensional
as is health, I am always reminded of Bentham’s “ felicific calculus,” which
he would use in measuring the net happiness that resulted from various
ac-tions by the State.
But, regardless of any difficulties with measurement (and I will refer to
this again later), the need to advocate for or advance the concern for the
public’s health is based on two concepts that are important for our work.
First, we hold that assuring the necessary means for persons to enjoy the
op-timum state of health is a matter of social justice, such as was enshrined in
the concept and practice of Health for All. Health institutions such as ours, Annual Report of t he Direct or–2000
ADVANCING THE PEOPLE’S HEALTH
which must be qualified as social, have to be concerned with matters of
justice. It is for this reason that I have insisted on making equity one of
our essential value principles. We have discussed this extensively here at
PAHO, and I believe that everyone in the Organization now understands
the concept as referring to the distribution or allocation of the means
nec-essary to ensure health in a fair manner. The differences or disparities that
may be described as representing inequity must be nonvolitional and
avoidable, in addition to there being some identifiable responsible agent.
Equity in health is not restricted to care services.
Daniels and his colleagues2have written cogently on the thesis that
jus-tice is, indeed, good for health, and base much of their reasoning on
Rawls’s philosophy.3 My introduction to this field came almost 20 years
ago, from reading Campbell’s4excellent analysis of Rawls’s theory of
jus-tice as it applied to health. He added two other principles besides equity
that should be considered in the context of justice. First there was liberty,
in the sense that the provision of health care should enhance liberty “ by
ensuring equal access to available health services within a given society,
irrespective of income, social status or political allegiance.” The second
was fraternity, in that all society members “ should be regarded as
providers of health care and should be given responsibility for assessing
the effectiveness of existing provisions and for formulating policies for the
improvement of local and national services.” I would consider these last
two as not being in the same scale as or as important as equity, and I
would extend the reasoning beyond health care to include the other
fac-The Direct or’s M essage
xiii
2Daniels N, Kennedy BP, Kawachi I. Why justice is good for ourhealth: The social determinants of health inequalities. Daedalus. Journal of the American Academy of Arts and Sciences; Fall 1999.
3Rawls J. A theory of justice.Cambridge, Massachusetts: Harvard
University Press; 1971.
4Campbell AV. Medicine, health and justice. The problem of
Pan Am erican Healt h Organizat ion Annual Report of t he Direct or–2000
ADVANCING THE PEOPLE’S HEALTH
tors that contribute to health and that are even referred to as determinants
of the healthy state.
The concept of liberty is very much related to the need for personal
au-tonomy in health, a need that has been expressed by many and perhaps
most vocally by Illich5 almost 25 years ago. Illich’s claims that the
med-ical or health industry was to be reined in, if not abolished, because it
re-duced personal autonomy or a person’s capacity to care for health were
exaggerated, but the notion of personal autonomy in health is still very
relevant. An important aspect of autonomy deals with the allocation of
re-sources to specific groups that are disadvantaged and for whom
improv-ing their health will contribute toward enhancimprov-ing their autonomy. These
groups certainly include the poor, children, the mentally handicapped,
and the elderly who live without family support. Much of the call for
at-tention to the improvement of health as a mechanism for relieving poverty
turns around the recognition that poverty is not only determined by
in-come, but also is related to a complex web of factors that essentially
re-duce the capability and autonomy of persons.
The concept of fraternity is becoming ever more relevant as the clamor
increases for there to be some societal mechanism that determines the
allo-cation of resources to health, not only in terms of quantity but also in terms
of technology and geographical distribution. It was this ideal of fraternity
that lay behind the call for community participation that was so much a
part of Primary Health Care. We cannot have fraternity of the type
envi-sioned by Rousseau, with every citizen participating in decision-making.
But there is a real fear that the current mechanisms through which the
peo-xiv
The Direct or’s M essage
ple make their wishes known is essentially flawed, and that in fact, the ones
actually making the decisions on resource allocation are the powerful and
vocal interests. The secret may well lie in an equation that is being accepted
more and more in the processes of health sector reform: some powers must
remain centralized to facilitate the steering role of the State and ensure
equity, while others should be decentralized to ensure fraternity.
There is an obvious tension between the need for justice in providing
necessary resources equitably to assure health and an acceptance of
dis-tances or gaps between persons or groups in terms of social attributes.
This is another reason why we have insisted so firmly that the process of
health sector reform in our part of the world should encompass, as a
fun-damental principle, the notion of a guiding or steering role for the State,
as exercised through the ministry of health. Because the State is the only
instance that can ensure that the measures necessary for health are
equi-tably provided, our technical cooperation continues to emphasize the need
for countries to develop the tools to carry out this steering function.
Although I might wish that the attention to considerations of justice
would suffice to guarantee advances in the attention to the public’s health,
I know that this is not so. It is essential that we show some instrumental
value of health in that it contributes to other needs or values that humans
hold dear. The area in which there is most current interest is the relation
between health and wealth. It has been known for centuries that the poor
are less healthy than the rich, although the economic historian Fogel6has
drawn our attention to an interesting phenomenon that he calls the “
peer-age paradox.” Until the beginning of the eighteenth century, English
peas-xv
6Fogel RW. The conquest of high mortality and hunger inPan Am erican Healt h Organizat ion Annual Report of t he Direct or–2000
ADVANCING THE PEOPLE’S HEALTH
xvi
ants and peers had similar life expectancies. This was perhaps due to the
remarkable alcohol consumption and poor diet of noble ladies, and the
fact that the nobles were not quite able to distance themselves from the
unfavorable environmental conditions that were the main determining
factors for the health of rich and poor alike.
Recent data are clear, however, in demonstrating that at the individual
as well as at the national level, wealthier is healthier. What has not been
so clear is that health plays a significant role in the accumulation of
na-tional wealth. It must be intuitively obvious that, provided there is
oppor-tunity to work, the healthier individual will produce more. Strauss and
Thomas7have reviewed good evidence that individuals who are healthier,
as shown by anthropometric measures, earn more. In addition, there are
several studies showing the positive effect of disease elimination or
reduc-tion on a nareduc-tion’s wealth.
More recently, PASB has been supporting macroeconomic studies that
show a clear causal relationship between health measures such as life
ex-pectancy and the future economic growth of countries. The mechanisms
by which health should enhance wealth at the macro level are not clear
and therefore need further research. One possibility is that investing in
health permits greater returns from such investments as education.
In-vestments in health and longer life expectancy may also increase the
ten-dency to save and, therefore, contribute to increased economic growth. In
terms of advocacy for the people’s health, there is no doubt that the
ex-perts on economic growth who formerly thought of matters relating to
health as being exogenous to their models are having to entertain the
pos-xvi
7Strauss J, Thomas D. Health, nutrition and economic
The Direct or’s M essage
xvii
sibility that health is endogenous. This is one area of inquiry that will
re-quire the active collaboration by health professionals with persons from
other disciplines.
The possibility that the population’s state of health may be
instrumen-tal in contributing to social stability and solidarity is attractive, but as yet
lacks the necessary empirical data to confirm it. In a similar vein, it is
plausible to hypothesize that inequality in health status in addition to
ab-solute status may contribute to the impairment of the social capital
nec-essary for optimal societal functioning.
The data and the descriptions of programs found in the body of this
re-port follow the more traditional approaches of describing the advances
made in the people’s health. They show changes in traditional health
in-dicators used to measure health status and refer to the way in which
var-ious factors, including such ones as natural disasters, influence health.
Most measures that are used relate to the health of groups of persons, and
considerable attention is given to our technical cooperation in assisting
countries to collect their data in such a manner that this information can
be disaggregated to show the disparities that exist. More and more
em-phasis is being placed on measures of distribution in addition to averages.
These are the first steps towards identifying the disparities that may be
characterized as inequities.
Little attention has been paid to individual health status. This is a
re-flection of the traditional tenet of public health, which holds that
atten-tion should be paid to the health of populaatten-tions rather than to that of
in-dividuals. The health of individuals is held to be the concern of the
Pan Am erican Healt h Organizat ion Annual Report of t he Direct or–2000 ADVANCING THE PEOPLE’S HEALTH
xviii
personal health care system. I have long held, however, that this is not in
keeping with the view that the public, to whose health we are committed,
is comprised of individuals, and that those social institutions that concern
themselves with improving the public’s health must at least also take note
of the measures employed to care for the health of individuals. First, there
is the obvious ethical reason for being concerned with the health of
indi-viduals, for it is individuals who become ill—as C.P. Snow8 wrote, “ each
of us dies alone.” And there are other reasons, too. For example, in spite
of claims that medical interventions have played only a small part in the
overall improvement of the health of populations, evidence shows that this
is not entirely true. Medical interventions at the individual level, as in the
case of antibiotic therapy for various illnesses, have had a role in
improv-ing the population’s health. Moreover, the steady increase in expenditure
on health that has repercussions on the availability of resources in the
health sector as a whole is related to the individuals’ clamor for new
tech-nology. It is the aspirational demands of individuals for technology
cloaked as needs that usually drive expenditure. These issues have to
in-volve all those interested in advancing the people’s health.
While we concern ourselves with the benefits to society from improving
the aggregate of health in the country, we pay little attention to devising
tools to measure the benefits of curing illness, restoring health, or
rehabili-tating the ill. As distinguished American physician Walsh McDermott9
ex-plained some time ago, we have no measures for assessing the value of
in-dividual care medicine such as we have for assessing the value of population
health. This is a challenge that must be taken up by those of us who are
in-xviii
8Snow CP. Human care. Journal of the American Medical
Asso-ciation1973;225:617–621.
9McDermott W. Medicine: The public’s good and one’s own.
The Direct or’s M essage
xix
terested in advancing the people’s health both from the individual and
group level.
Several approaches have been suggested for measuring individual
health, perhaps the most common being the individual’s self-assessment of
illness, or some proxy measure such as days of absence from work. The
lat-ter is clearly of limited value in societies in which a high percentage of
work takes place in the informal sector. This is the case in Latin America
and the Caribbean, where up to 50% of workers in a country may be in
the informal sector or may have irregular work because of the high level
of unemployment. Self-assessment has its problems, too, as there may be
wide cultural variations in the appreciation of what constitutes ill health.
The poor in less developed countries have a much higher threshold for
self-reporting of ill health, given the serious economic consequences of lost
work as a result of sickness. The frequency of symptomatology will also
af-fect the reporting—if almost every child has a nasal discharge, this
symp-tom may be regarded as the norm, rather than as an indication of illness.
In the final analysis it will be the countries themselves that will be the
principal actors in advancing the people’s health. The efforts in the
coun-tries will be the result of action by all the social partners, but this is not
the place to elaborate on the relative roles of these partners. Our only
premise is that whatever the mix of partners, it will be the State, as the
ex-pression of popular will, that will have the ultimate responsibility for the
determinants that fall outside the range of those related to individual
be-havior or biological determination. Even in the case of individual
behav-ior the State has a role, the classical example being tobacco use, where the
Pan Am erican Healt h Organizat ion Annual Report of t he Direct or–2000 ADVANCING THE PEOPLE’S HEALTH
xx
State’s role in preventing exposure is clear. Many determinants that were
thought previously to be immutable because of biology are now known to
be the result of nutritional or other social influence in early life, and as
such may well fall under the purview of the State.
But having said that some responsibility lies with the State, I must
em-phasize that I am uncomfortable with the common assertion that many
failures in the application of the technologies that are of proven usefulness
are due to lack of political will. I am increasingly convinced that this is a
new vein of rhetoric that national and international technical advisors
have found and that allows them to evade or renege on their
responsibili-ties. It is true that the political process involved in making decisions in
re-lation to health sometimes seems strange, but I have never found that
these decisions are based on some deliberate or devious assault on the
peo-ple’s health. The unfortunate truth is that many of us have not taken the
trouble to understand the nature of political decision-making. In addition,
once we have laid blame on “ the lack of political will,” there is little
in-centive to put forward good solutions with alternatives that can satisfy the
acid test of being financially practicable, technically sound, socially
ac-ceptable, and politically feasible.
It is not given to many to participate in so noble an effort as advancing
the people’s health. It is a trust that we at PAHO hold sacred and we have
committed ourselves to the proper use of all the resources entrusted to us
to that end. It is for this reason that no report is complete without some
statement of the manner in which our resources are applied.
xxi
To those of us who are intimately involved in and committed to the
ef-forts to advance the people’s health, progress sometimes seems painfully
slow. But we forge ahead, correcting the correctable with the instruments
that we know do work, seeking and applying appropriately the new
tech-nology that will undoubtedly appear, and using every possible means to
reduce the disparities so that there is more of a common front to the
ad-vance. And we must take comfort in the knowledge that the people’s
health is advancing and we are increasingly acquiring the skills and tools
Annual Report of t he Direct or–2000
vii
Contents
The Director’s Message
. . . ix
Chapter
1
:
. . . 1
Health Situation Analysis
Chapter
2
:
. . . 19
Health in Human Development
Chapter
3
:
. . . 35
Health Promotion and Protection
Chapter
4
:
. . . 57
Environmental Protection and Development
Chapter
5
:
. . . 77
Health Systems and Services Development
Chapter
6
:
. . . 97
Disease Prevention and Control
Chapter
7
:
. . . 125
Supporting the Delivery of
Technical Cooperation: The Secretariat
C
o
n
t
e
n
t
Health Situation
Analysis
Annual Report of t he Direct or–2000
r
By t he end of t he t w ent iet h cent ur y,
1
the Region of the
Americas had achieved considerable improvements in the average
Healt h Sit uat ion Analysis
3
ost countries in the Region have met the main goals proposed in the historic conference on primary health care held in 1978 in Alma Ata, which established the “ Health for All by the Year 2000” initiative. Progress is reflected in steady improvements in such national indica-tors of well-being as life expectancy, easy ac-cess to safe water supply, and immunization coverage, and in reductions in health-ill out-comes, particularly the reduction of child mortality due to communicable dis-eases. These changes are taking place in the context of political and eco-nomic reforms, as well as an increasing decentralization of the health services. Nevertheless, the challenge of creating health systems to reduce major in-equalities among populations in the Region remains a priority. Notably, health gaps between countries have not diminished, even when the analyses that measure them compare countries with similar socioeconomic conditions. Socioeconomic changes have severely inhibited the ability of the countries’ health institutions to effectively and equitably deliver services to vulnerable segments of the population.
Given this, there is an urgent need to improve the empirical public health information that is used to periodically assess the health situation and analyze trends. A major challenge for the Pan American Health Organization has been to improve the comparability, validity, and reliability of the health information needed to identify and quantify the inequalities that disproportionately affect people in certain geographic areas or certain groups of society. It is equally im-portant to recognize the factors that determine those health inequalities.
One noteworthy accomplishment is that the ministries of health of 18 countries in the Americas (listed in Table 3) have built and enhanced the availability of their core health indicators databases to disaggregate data by subnational levels based on PAHO’s Regional Core Health Data/Country Pro-file Initiative. The availability of national information is critical for conduct-ing the health situation analyses that will be used to adjust and redirect health policies and programs to close existing equity gaps within and among countries. PASB commends these countries for developing their national health information initiatives and for publishing their core health data.
ADVANCING THE PEOPLE’S HEALTH Annual Report of t he Direct or–2000
4
that will permit a more precise subnational and local identification of health inequalities, as well as the selection of appropriate indicators and indices.
This chapter presents the health situation of the Member States, utilizing basic indicators of the populations’ health status and its determinants. Some indicators are analyzed at different levels of geographic or population ag-gregation to facilitate within-country comparisons. In addition, the chapter includes a series of new methodological analyses, using for the first time dis-tributions of available subnational core health indicators. These new meth-odological analyses complement other analyses presented in previous annual reports.
The health situation
in the Region
T
he country-level analyses use the basic indicators available in PAHO’sTechnical Information System of Core Health Data. This system con-tains up-to-date information for 48 Member States and territories of the Americas. To facilitate analysis at the country level, these were divided into eight subregions according to location, population size, and certain so-cioeconomic criteria (Table 1).The subnational analyses included data from 363 geographic units (states, provinces, or departments) of 18 countries. In collaboration with the PAHO/
Pan Am erican Healt h Organizat ion
TA BLE 1. Subregions of t he Region of t he A m er icas.
Subregion Countries included
Andean Region Bolivia, Colombia, Ecuador, Peru, and Venezuela Brazil
Central American Isthmus Belize, Costa Rica, El Salvador, Guatemala, Honduras, Nicaragua, and Panama
Latin Caribbean Cuba, Dominican Republic, Haiti, and Puerto Rico Mexico
Non-Latin Caribbean Anguilla, Antigua and Barbuda, Aruba, Bahamas, Barbados, British Virgin Islands, Cayman Islands, Dominica, French Guiana, Grenada, Guadeloupe, Guyana, Jamaica, Martinique, Montserrat, Netherlands Antilles, Saint Kitts and Nevis, Saint Lucia, Saint Vincent and the Grenadines, Suriname, Trinidad and Tobago, Turks and Caicos Islands, and U.S. Virgin Islands North America Bermuda, Canada, and United States of America
Healt h Sit uat ion Analysis
5
WHO Country Offices, several countries initiated evaluation and monitoring processes and published their health situation data and indicators for 1994–1998.
The population’s health status
The end of the twentieth century saw major changes in the patterns and causes of mortality. There has been a shift in causes of death from infectious diseases to chronic non-communicable diseases. This has produced variations in the epidemiological profiles that require specific, focused responses and health policy decisions in order to modify the health-risk determinants, in-cluding environmental factors and behavioral and lifestyle choices.
The most significant changes in mortality patterns over the last 20 years in the Americas have occurred in children. The Region’s mean infant mortality rate of 24.8 deaths per 1,000 live births in the 1995–2000 period is the lowest registered to date. Between 1980–1985 and 1995–2000, infant mortality fell by 12.1 deaths per 1,000 live births, or approximately 30%. In the Andean Re-gion, Brazil, the Central American Isthmus, and the Latin Caribbean the im-pact of this reduction has been between 30% and 45% (Figure 1), although the mortality ratio in these areas was between five and seven times higher than in North America, and at least 40% higher than the Regional average in both periods.
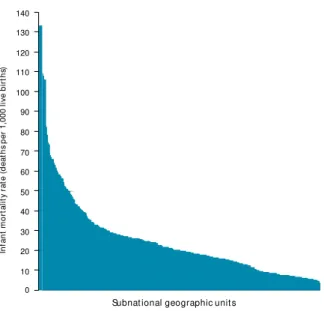
At the country level, health and living con-ditions have also improved, although not all subnational geopolitical units benefited to the same degree. Table 2 shows various health in-dicators for 363 geographic units of the 18 se-lected countries. Although the mean and me-dian infant mortality rates are 24.4 deaths per 1,000 live births and 19.7 deaths per 1,000 live births, respectively, the frequency distribution of the infant mortality rates (Figure 2) reveals the great variability and numerous inequalities that exist at the subnational level. Inequality also is evident in the comparison of the mini-mum value (3.71 deaths per 1,000 live births) and the maximum value (133 deaths per 1,000 live births, which is 35 times greater than the minimum value). The large gap among the countries also is reflected in the coefficient of
0 Andean Region North America Brazil Subregion Latin Caribbean Southern Cone Non-Latin Caribbean Central America Mexico 10 20 30 40 50 60 70 In fan t m o rt al it y r at e (d eat h s p er 1,000 l ive b ir th s) 1980–1985 1995–2000
Annual Report of t he Direct or–2000
ADVANCING THE PEOPLE’S HEALTH
6
variation,1which has a value of 0.8. Despite the differences, approximately 5%
of the geographic units have values above 60 deaths per 1,000 live births and more than half have values close to the Regional mean of 24 deaths per 1,000 live births.
The median values for the infant mortality rate at the subnational levels show variations among countries, ranging from 5.7 deaths per 1,000 live births in Canada to 83 deaths per 1,000 live births in Bolivia (Table 3). Bolivia’s infant mortality rate ratio, 15 times greater than Canada’s, indicates the high degree
Pan Am erican Healt h Organizat ion
1The ratio of the standard deviation to the mean.
TA BLE 2. M easures of t he dist r ibut ion of healt h indicat or s of subnat ional geogr aphic unit s in select ed count r ies of t he A m er icas, 19 9 5–19 9 8 .a-o
Standard Coefficient of
Indicator n M inimum M aximum Range M ean M edian deviation variation
Infant mortality rate
(deaths per 1,000 live births) 363 3.7 133.0 129.3 24.4 19.7 18.9 0.8
Illiteracy (% population) 258 0.7 58.2 57.6 16.5 13.0 11.4 0.7
Total fertility rate
(children per woman) 241 1.3 6.0 4.7 3.3 3.2 1.1 0.3
Urban population (%) 250 11.0 100.0 89.0 60.4 64.3 22.8 0.4
Annual population growth
rate (%) 217 –3.9 8.8 12.7 2.1 2.0 1.4 0.7
Life expectancy at birth (years) 192 56.8 79.0 22.2 69.8 70.0 3.9 0.1
Access to potable water
services (% population) 261 0.0 99.5 99.5 57.1 66.7 30.4 0.5
Access to excreta disposal
services (% population) 244 0.0 98.3 98.3 44.9 43.5 29.8 0.7
Doctors per 10,000 population 222 0.8 99.1 98.4 13.7 9.6 14.3 1.0
Children < 1 year vaccinated
against measles (%) 213 15.0 133.9 118.9 74.9 77.6 19.5 0.3
Prevalence of low
birthweight (%) 203 0.0 14.3 14.3 6.6 6.6 1.6 0.2
Sources:
aRede Interagencial de Informações para Saúde. Indicadores e dados básicos para a saúde. IDB 98 Brasil. Brasilia: Ministerio da Saúde; 1998. bMinisterio de Salud de Costa Rica, OPS/OMS. Indicadores Básicos 1995. Situación de Salud en Costa Rica. 1995.
c Ministerio de Salud Pública, OPS/OMS. Indicadores Básicos 1997. Situación de Salud en Cuba. 1997. dSecretaria de Salud de México, OPS. Indicadores Básicos 1997. Situación de Salud en México. 1998.
eMinisterio de Salud de Nicaragua, OPS/OMS. Indicadores Básicos 1997. Situación de Salud en Nicaragua. 1997. f Ministerio de Salud Pública de Uruguay. La Salud de Uruguay en Cifras. 1997.
gMinisterio de Salud Pública de Ecuador, Instituto Nacional de Estadística y Censos, OPS/OMS. Situación de la Salud en el Ecuador. Tendencias
de la natalidad y mortalidad 1987–1997. 1998.
hMinisterio de Salud de Guatemala, OPS/OMS. Indicadores Básicos 1998. Situación de Salud en Guatemala. 1998. i Ministerio de Salud de Panamá, OPS/OMS. Indicadores Básicos 1998. Densidad por Región de Salud. 1998.
j Ministerio de Salud Pública y Bienestar Social de Paraguay, OPS/OMS. Indicadores Básicos de Salud—Paraguay. 1998. k OPS/OMS. Situación de Salud de la Argentina. 1999.
l Secretaría de Salud de Honduras, OPS/OMS. Indicadores Básicos 99. Situación de Salud en Honduras. 1999. mMinisterio de Salud de Perú, PAHO. Indicadores Básicos 1999. Situación de Salud en el Perú. 1999.
nMinisterio de Sanidad y Asistencia Social, Dirección General Sectorial de Epidemiología y Dirección de Análisis de Situación de Salud de
Venezuela, OPS/OMS. Indicadores Básicos 1999. Situación de Salud en Venezuela. 1999.
Healt h Sit uat ion Analysis
7
of inequality between these countries (Figure 3). The median values within the countries suggests four pos-sible health inequality profiles: very low levels of in-fant mortality (fewer than 10 deaths per 1,000 live births); low levels (close to the Regional median of 24 deaths per 1,000 live births); high levels (20 to 40 deaths per 1,000 live births); and very high levels (40 or more deaths per 1,000 live births). In practically all the countries, the range between the maximum and mini-mum values reflects the degree of inequality within them. For example, the infant mortality rate ratio in Peru, which has high levels of infant mortality (nearly double the Regional level), shows great internal in-equalities. The rates in areas with the highest number of infant deaths are nearly four times those in the areas with the lowest number of infant deaths. Never-theless, it is important to note that the greatest inter-nal infant mortality inequalities do not occur necessar-ily in the countries with the highest national rates. In Colombia, which has low levels of mortality, the mor-tality rate ratio is 6.2, higher than that of all the coun-tries analyzed. In contrast, in Uruguay and Cuba, which have low or very low levels of mortality, the mortality rate ratio between subnational units is lower.
Taking into account small population sizes, fairly homogeneous socioeco-nomic conditions, and unstable infant mortality rates, the differences among Non-Latin Caribbean countries were analyzed utilizing life expectancy at birth for subnational units as the health status indicator. The average life expectancy at birth in this subregion in the 1995–2000 period is 72.6 years, with women outliving men by 5.2 years. Greater differences between men and women also were observed at the country level: for example, women outlive men by 6.5 years in Aruba, Saint Lucia, Guyana, Guadeloupe, the Bahamas, and Mar-tinique. In contrast, in the Virgin Islands, Saint Vincent and the Grenadines, and Montserrat, women outlive men by only three or fewer years. Guyana and Saint Kitts and Nevis ranked considerable lower than the subregional average figure for life expectancy at birth for women (Figure 4).
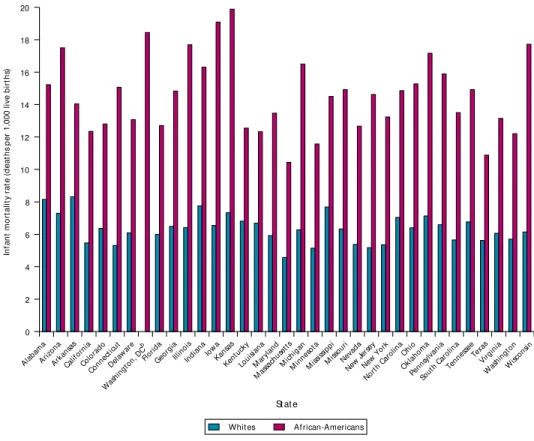
As is the case with life expectancy in the Non-Latin Caribbean, infant mor-tality rates within a country vary according to location and social group, in-dicating that inequalities exist regardless of a country’s mean rate (Figure 5a). For example, in Washington, D.C. (USA), infant mortality is higher for
minor-FIGURE 2. Inf ant m or t alit y r at es in select ed count r ies of t he A m er icasa, 19 9 5–19 9 8 . Dist r ibut ion pat t er n
f rom 36 3 subnat ional geogr aphic unit s.
aArgentina, Belize, Bolivia, Brazil, Canada, Colombia, Costa Rica,
Cuba, Ecuador, Guatemala, Mexico, Nicaragua, Panama, Paraguay, Peru, United States of America, Uruguay, and Venezuela.
Subnational geographic units
Annual Report of t he Direct or–2000
ADVANCING THE PEOPLE’S HEALTH
8
ity populations, particularly African-Americans, whose risk is at least twice that of the white population (Figure 5b).
Geographic units with infant mortality rates more than two standard devi-ations above the mean were identified in 11 of 18 countries in the Americas.
Measuring health inequalities
and their determinants
In order to determine and understand long-term health trends, the links among health status and individual biological and social characteristics, economic and political organization, social structure, cultural background, and demographic and macroecological processes must be recognized and taken into account.
A population’s demographic and socioeconomic characteristics are basic determinants of its living conditions. In the subnational units of Peru and
Pan Am erican Healt h Organizat ion
TA BLE 3. M easures of t he dist r ibut ion of t he inf ant m or t alit y r at e f or subnat ional geogr aphic unit s of count r ies of t he A m er icas, 19 9 5–19 9 8 .a-o
Standard Coefficient of Indicator n M inimum M aximum Ratio Range M ean M edian deviation variation
Argentina 24 9.7 34.4 3.55 24.7 20.8 20.05 6.2402 0.3
Belize 6 11.4 35.2 3.09 23.8 20.4 16.55 9.3164 0.46
Bolivia 9 50 133 2.66 83 87.3 83 27.171 0.31
Brazil 27 19.66 74.07 3.77 54.41 40 35.02 15.572 0.39
Canada 11 4.6 12.2 2.65 7.6 6.43 5.7 2.2136 0.34
Colombia 27 4.5 28 6.22 23.5 14.1 14.8 5.2159 0.37
Costa Rica 7 3.71 15.68 4.23 11.97 12.3 13.69 4.0678 0.33
Cuba 15 5.4 10.3 1.91 4.9 8.09 8 1.4815 0.18
Ecuador 20 10.9 32.7 3.00 21.8 19.9 18.45 6.1882 0.31
Guatemala 22 24.02 58.03 2.42 34.01 38.1 35.52 10.457 0.27
Mexico 33 14 42.8 3.06 28.8 24 22.2 7.2612 0.3
Nicaragua 17 12.63 40.12 3.18 27.49 23.8 22.4 8.3399 0.35
Panama 10 11.1 29.8 2.68 18.7 19.2 18.1 6.1744 0.32
Paraguay 18 16.45 61.54 3.74 45.09 25.3 21.26 10.818 0.43
Peru 24 26 109 4.19 83 54.9 51.5 18.761 0.34
Uruguay 18 13.3 25.7 1.93 12.4 18.4 18.35 2.7759 0.15
United States
of America 51 4.4 14.9 3.39 10.5 7.42 7.4 1.7729 0.24
Venezuela 24 8.9 42.1 4.73 33.2 24.9 24.55 7.2736 0.29
Healt h Sit uat ion Analysis
9
Brazil, there is an inverse relationship between the infant mortality rate and the proportion of the population with access to potable water, with cor-relations of –0.65 and –0.66, respectively. The neg-ative correlation between these two variables sug-gests that, in these countries, the infant mortality rate decreases as access to potable water increases (Figures 6a and 6b).
The relationship between the infant mortality rate and the proportion of the population with ac-cess to excreta disposal services in the subnational units of Panama and Peru also is inverse, with cor-relations of –0.80 and –0.67, respectively. In most of Panama’s provinces, more than 70% of the popula-tion has access to excreta disposal services and in-fant mortality rates are lower than 20 deaths per 1,000 live births. However, the provinces with the least access also have the highest infant mortality rates. As in the case of access to potable water, this suggests that as access to excreta disposal increases in these countries, the infant mortality rate de-creases (Figures 7a and 7b).
It is important to note that a negative correla-tion was also found in Uruguay, even though the country has a low infant mortality rate and good access to water (corr = –0.49) and excreta disposal (corr = –0.44) in comparison to other countries in the Region. This correlation was not as strong as in the other countries, but the inverse relationship between the infant mortality rate and environ-mental factors is still evident.
In the analysis of the relationship between the infant mortality rate and the proportion of illiter-ate population in several countries in the Region, Brazil showed an almost perfect positive correla-tion (corr = 0.94) (Figure 8a). This suggests a very strong association between this socioeconomic fac-tor and infant mortality in this country, where in-fant mortality increases as illiteracy increases. A strong positive correlation between these two indi-cators (corr. = 0.75) also is seen in Peru (Figure 8b).
FIGURE 3. Inf ant m or t alit y r at es in select ed count r ies of t he A m er icas, 19 9 5–19 9 8 . Count r y dist r ibut ion according t o subnat ional geogr aphic unit s.
FIGURE 4 . Dif f erences in lif e ex pect ancy at bir t h am ong f em ales f rom N on-Lat in Car ibbean count r ies, 19 9 5–20 0 0 .
–3 –2
Z-score with regards to the subregional mean for females of 75.7 years
–1 0 1 2 3 Antigua and Barbuda
Grenada Guyana Saint Kitts and Nevis Saint Lucia
Saint Vincent and the Grenadines Suriname
Trinidad and Tobago
Anguilla Aruba Bahamas Barbados Bermuda Cayman Islands Dominica French Guiana Guadeloupe Jamaica Martinique Montserrat Netherlands Antilles Turks and Caicos Islands UK Virgin Islands US Virgin Islands
Country 140 130 120 110 100 90 80 70 60 50 40 30 20 10 0 United Stat es
Cuba Bolivi
a
Costa R ica Colo mbi a Can ada Pan ama Urug uay Ecuad or Argen tina Parag uay Belize Nicar agua Ven ezu ela Brazi l Guat emal a Peru Mexi co In fan t m o rt al it y r at e (d eat h s p er 1,000 l ive b ir th s) ❋ ❋ ❋ ❋ ❋
Annual Report of t he Direct or–2000
ADVANCING THE PEOPLE’S HEALTH
1 0
Use of the distributions
of subnational-level
basic health data
T
identify population groups in geopolitical unitshe graphs and maps presented in this chapter that show the greatest inequalities in health and that require the greatest health care interventions.The availability of core health data disaggregated at subnational levels permits the exploration of the mag-nitude of within-country distributional inequalities in health. The exploratory analysis of health inequalities was done using the Lorenz curve2and the Gini
coeffi-cient.3 Using data from Guatemala’s 27 health areas
and Uruguay’s 18 departments, figures 9a and 9b show
the magnitude and distribution of inequalities in in-fant mortality in these two countries. In a situation of “ perfect equality,” each population quintile should ac-count for only 20% of the total deaths. However, these Lorenz curves show that almost 35% of Guatemala’s and 25% of Uruguay’s infant deaths occur in the high-est infant mortality rate quintile. Looking at the oppo-site extreme of the distribution, Guatemala’s lowest in-fant mortality rate quintile accounts for only 10% of infant deaths, and Uruguay’s accounts for 15%. These internal disparities are also expressed as a ratio be-tween extreme quintiles (the ratio of the 20% highest/the 20% lowest): Guatemala’s is 3.5 and Uruguay’s is 1.6. The Gini coefficient is a summary measure of these inequalities. The Gini values for Guatemala are 0.22 and 0.09 for Uruguay. However, the Gini coefficient does not account for socio-economic factors in the assessment of health inequalities, and therefore it is not possible to determine if the highest infant mortality rate quintile is in-deed the poorest quintile in the population.
In contrast, core health data, disaggregated at subnational levels, facili-tated the exploration of the degree of internal distributional inequalities in health, taking into account important socioeconomic variables. The popula-tion was broken down into a socioeconomic hierarchy according to the values
Pan Am erican Healt h Organizat ion
2The Lorenz curve shows the difference between two distributions. When the proportion in each quintile for
the y-axis variable is equal to the proportion in each quintile for the x-axis variable, the values plot a 45-degree line. The 45-degree of curvature reflects the 45-degree of difference (inequality) between the two proportions.
3The Gini coefficient, a summary measure of the deviation in the Lorenz curve, is the ratio of the area
be-tween the Lorenz curve and the 45-degree line to the whole area above or below the 45-degree line. If the Lorenz curve lies on the 45-degree line, the value of the Gini coefficient is zero. As the deviation increases, so does the Gini Coefficient; the maximum possible value of the Gini coefficient is 1.
4The concentration curve plots the cumulative proportions of health against the cumulative proportions of
the population, ranking the population by socioeconomic status, from the most disadvantaged to the least disadvantaged. If health is equally distributed across socioeconomic groups, then the concentration curve will
Alabama
–2.5 –2 –1.5 –1 –0.5 0 0.5 1.5
Z-score with regards to the national mean of 7.3 deaths per 1,000 live births 1 2 –2.5 3 3.5 4 Arizona
Arkansas Delaware District of Columbia Georgia Idaho Illinois Indiana Kansas Louisiana Maryland Michigan MississippiMissouri Nebraska North Carolina Ohio Oklahoma Pennsylvania South Carolina Tennessee Virginia
West Virginia Wisconsin
Colorado Florida Maine Texas Utah Massachusetts Nevada Alaska California Connecticut Hawaii Iowa Kentucky Minnesota Montana New Hampshire New Jersey New Mexico New York North Dakota Oregon Rhode Island South Dakota Vermont Washington Wyoming
Healt h Sit uat ion Analysis
1 1
of one of the three health determinants: poverty, access to potable water, and the social development index. This socioeconomic hierarchy was then related to the observed distribution of the infant mortality rate, a key health out-come variable. This analytical approach is expressed by the concentration curve4and its associated concentration index.5Figures 10a and 10b illustrate
this approach using national core health data from Brazil’s 27 states and Costa Rica’s 81 cantons to explore socioeconomic inequalities in infant mortality within these countries. The negative value of both concentration indexes in-dicates that the infant mortality is highest among the poorest members of the population. The graphs show that the concentration index is more than twice as great in Brazil as in Costa Rica. In Brazil, the poorest quintile accounts for almost 35% of all infant deaths, whereas the richest quintile accounts for
coincide with the 45-degree diagonal. The farther the concentration curve lies from the diagonal, the greater the degree of inequality in health (Wagstaff A, Paci P, Van Doorslaer E. On the measurement of inequali-ties in Health. Soc Sci Med1991;33(5):545–57).
5The concentration index is a summary measure of the distance between the concentration curve and the
diagonal of perfect equality and, hence, it measures the extent of health inequality that is systematically as-sociated with socioeconomic status. It is defined as twice the area between the concentration curve and the diagonal. Its values range from –1 (health inequality concentrated in the most socioeconomically disadvan-taged population group) to +1 (health inequality concentrated in the least socioeconomically disadvandisadvan-taged population group) (Wagstaff A, Paci P, Van Doorslaer E. On the measurement of inequalities in Health. Soc Sci Med1991;33(5):545–57).
0 2 4 6 8 10 12 14 16 18 20 State In fan t m o rt al it y r at e (d eat h s p er 1,000 l ive b ir th s) Whites African-Americans Alab ama Arizo na Arkan sas Califo rnia Colo rado Conn ectic ut Delaw are Was hing
ton, DC b Florid
a
Geo rgia
Illinoi s
Indian a
IowaKansas Kentu cky Loui sian a Mar ylan d Mas sachu setts Mich igan Min nesot a Miss issip pi Miss ouri Nevad a New Jersey New York North Car olin a Ohio Oklah oma Penns ylvan ia Sout h Car
olin a Tennes see Texas Virg inia Was hing ton Wisc onsin
FIGURE 5b. Com par ison of inf ant m or t alit y r at es bet w een W hit es and A f r ican-A m er icans in t he Unit ed St at es of ican-A m er ica, by st at e, 19 9 6 .a
Annual Report of t he Direct or–2000
ADVANCING THE PEOPLE’S HEALTH
1 2
10%. In contrast, Costa Rica’s poorest quintile accounts for almost 25% of all infant deaths, whereas the richest quintile accounts for 15%. Using data from Peru’s 24 de-partments, figure 10c shows the inequalities in infant mortality due to acute diarrheal diseases among the cumulative population of live births, ranked by socio-economic level and level of access to potable water. This particular situation is also corroborated by the strong negative correlation between infant mortality and levels of access to potable water, as shown in Figure 6a. The in-formation derived from these analyses can help decision-makers to identify priority areas for health interventions as well as to direct the allocation of resources to address national equity goals.
In planning intervention strategies it is useful to base health analyses on the patterns and degree of spatial distribution. To determine levels of unmet health needs utilizing various basic indicators, PASB proposes the analysis of multiple variables with linear combinations of
Z-scores6to identify health needs in critical areas. By
an-alyzing specific determinants, interventions can be tar-geted to reduce specific health risks and existing health inequalities. Figures 11a–c, which are thematic mappings that can be used in health analysis and program inter-ventions, show the distribution of health needs at sub-national levels in Brazil, Mexico, and Peru.7 These
epi-demiological maps make it possible to locate the areas and populations with the highest level of unmet health needs in these countries.
The standardization of the indicators makes it possi-ble to establish a hierarchical order of inequality be-tween units, as well as to combine different indicators with different units of measurement in a single index. The health needs index presented here is a standardized linear combination of the values of three basic indicators at the subnational level: infant mortality rate, propor-tion of the populapropor-tion with access of potable water, and literacy rates. The health needs index provides an opera-tional application of the results of the inequality assess-ments that identify the areas with higher degrees of
Pan Am erican Healt h Organizat ion
6Scores expressed as standard deviations from the mean value.
7These maps were prepared with ArcView CHALK 3.2 Geographic Information System,
using the standard deviation from the means of the selected indicators (expressed as a
Z-scores) to classify geographic units. These Z-scores represent a given indicator’s rela-tive distance from the national mean; as such, it constitutes a minimum attainable goal.
120 100 80 60 40 20 0 0 20
Population with access to potable water services (%) Correlation coefficient = –0.65
40 60 80 100
In fan t m o rt al it y r at e (d eat h s p er 1,000 l ive b ir th s)
FIGURE 6 a. Cor relat ion bet w een inf ant m or t alit y r at e and level of access t o pot able w at er ser vices, P er u, 19 9 6 .
80 60 40 20 0
Correlation coefficient = –0.66
0 20
Population with access to potable water services (%)
40 60 80 100
In fan t m o rt al it y r at e (d eat h s p er 1,000 l ive b ir th s)
FIGURE 6 b. Cor relat ion bet w een inf ant m or t alit y r at e and level of access t o pot able w at er ser vices, Br az il, 19 9 7.
0 8 16 24 32 40 0 20
Population with access to potable water services (%)
40 60 80 100
In fan t m o rt al it y r at e (d eat h s p er 1,000 l ive b ir th s)
Correlation coefficient = –0.80
Healt h Sit uat ion Analysis
1 3
needs and inequalities and facilitates the targeting of health interventions.
Directing health
interventions to
achieve health equity
I
n order to guide rational, effective, and equitabledecision-making, it is imperative that health situation analyses measure health inequalities with greater specificity and make use of available national and subna-tional basic information. The health analyses presented in this report reveal the unequal rates in the basic health indicators at subregional, national, and subnational lev-els and the extent of current health equality gaps be-tween and within countries. To identify areas or popula-tion groups with the greatest health care needs, the countries in the Region can use the simple statistical mea-sures and methodological procedures presented here (absolute frequency distribution and the range of se-lected basic indicators and measures of distribution and dispersion of indicators).In summary, since a country’s health indicators ex-pressed as national means do not reflect that nation’s heterogeneity, a new strategy is required to geographi-cally disaggregate information for health analyses. High inequality patterns were observed at both Regional and subregional levels and were replicated with greater in-tensity at the subnational and local levels. Some coun-tries in the Region of the Americas have major internal health differences and inequalities, as shown by large ranges of distribution and the extent of the dispersion of indicators, as well as high Gini coefficients, concentra-tion indices, and coefficients of variaconcentra-tion. Subnaconcentra-tional analyses facilitate rational decision-making to determine priorities and health policies, and the planning and
eval-120 100 80 60 40 20 0
0 20 40 60 80 100 Population with access to potable water services (%)
In fan t m o rt al it y r at e (d eat h s p er 1,000 l ive b ir th s)
Correlation coefficient = –0.67
FIGURE 7b. Cor relat ion bet w een inf ant m or t alit y r at e and level of access t o ex cret a disposal ser vices, P er u, 19 9 6 .
80 60 40 20 0
Correlation coefficient = 0.94
0 20
Illiterate population (%) 40 60 80 100
In fan t m o rt al it y r at e (d eat h s p er 1,000 l ive b ir th s)
FIGURE 8 a. Cor relat ion bet w een inf ant m or t alit y r at e and level of illit er acy in t he populat ion, Br az il, 19 9 7.
120 100 80 60 40 20 0
0 20 40 60 80 100 Illiterate population (%)
In fan t m o rt al it y r at e (d eat h s p er 1,000 l ive b ir th s)
Correlation coefficient = 0.75
Annual Report of t he Direct or–2000
ADVANCING THE PEOPLE’S HEALTH
1 4
Pan Am erican Healt h Organizat ion
uation of those health interventions that affect the de-tected health inequities.
The great variability in the levels of needs and health inequalities within the countries has been shown in this report through the analysis of such basic indicators as in-fant mortality, poverty, illiteracy, and access to potable water. The rates in some countries tend to be more ho-mogeneous, as the dispersion indicators indicate, while in others they are very heterogeneous, due to the persis-tence of major differences in the population’s health and living conditions.
The analysis of the health situation and its trends based on distributions of the basic indicators at subna-tional and local levels will show both the magnitude and the distribution of health inequalities. It will identify the areas and the population groups that need specific poli-cies, sustained intervention programs, and health ser-vices. In addition, it facilitates the recognition of the basic determinants that interact to affect individuals, population groups, and their environment. This infor-mation is fundamental to the reorientation of PASB’s technical cooperation.
The development of the capacity to amass reliable health information will facilitate equity-based analyses as well as a more precise definition of sectoral priorities and improved health program planning, monitoring, and evaluation.
It is critical for Member States to target health inter-ventions to those geographic areas and populations that have the highest levels of inequality and unmet health needs. Health situation analyses will assist countries in es-tablishing priorities for their health programs and inter-ventions and determining any national and local adjust-ments that may need to be made. This type of situation analysis, together with the consolidation of the Regional and national core health data initiatives, will support the formulation of equitable health policies and effective, quality programs that can improve the well-being of the entire population of the Americas, especially those most in need. 1.0 0.9 0.8 0.7 0.6 0.5 0.4 0.3 0.2 0.1 0.0
0.0 0.1 0.2 0.3 0.4 0.5 0.6 0.7 0.8 0.9 1.0 Live births (% cumulative population)
ranked by socioeconomic status Concentration index = –0.23
Deat h s u n d er ag
e 1 (%
c u m u lat ive)
perfect equality observed distribution
FIGURE 10 a. Inequalit ies in inf ant m or t alit y:
cum ulat ive dist r ibut ion of deat hs under age 1 am ong t he cum ulat ive populat ion of live bir t hs, r ank ed by socioeconom ic st at us, according t o t he propor t ion of households below t he nat ional pover t y line, Br az il, 19 9 7.
Live births (% cumulative population) Gini coefficient = 0.22
1.0 0.9 0.8 0.7 0.6 0.5 0.4 0.3 0.2 0.1 0.0
0.0 0.1 0.2 0.3 0.4 0.5 0.6 0.7 0.8 0.9 1.0 perfect equality observed distribution
Deat h s u n d er ag
e 1 (%
c u m u lat ive)
FIGURE 9 a. Inequalit ies in inf ant m or t alit y:
cum ulat ive dist r ibut ion of deat hs under age 1 am ong t he cum ulat ive populat ion of live bir t hs, r ank ed by m agnit ude of inf ant m or t alit y r at e, Guat em ala, 19 9 7.
Live births (% cumulative population) Gini coefficient = 0.09
1.0 0.9 0.8 0.7 0.6 0.5 0.4 0.3 0.2 0.1 0.0
0.0 0.1 0.2 0.3 0.4 0.5 0.6 0.7 0.8 0.9 1.0 perfect equality observed distribution
Deat h s u n d er ag
e 1 (%
c u m u lat ive)
FIGURE 9 b. Inequalit ies in inf ant m or t alit y:
Healt h Sit uat ion Analysis
1 5
PASB is committed to providing leadership and support to its Member States so that they may generate objective information for the analysis, monitoring, evaluation of health conditions that will contribute to the reduction of unjust health inequalities. Health situation analysis re-quires an equity approach, which has important policy and operational implications: it will provide the frame-work needed for monitoring the health conditions of the countries of the Americas as well as assist in the achieve-ment of health equity.
1.0 0.9 0.8 0.7 0.6 0.5 0.4 0.3 0.2 0.1 0.0
0.0 0.1 0.2 0.3 0.4 0.5 0.6 0.7 0.8 0.9 1.0 Live births (% cumulative population)
ranked by socioeconomic status Concentration index = –0.09
Deat h s u n d er ag
e 1 (%
c u m u lat ive)
perfect equality observed distribution
FIGURE 10 b. Inequalit ies in inf ant m or t alit y: cum ulat ive dist r ibut ion of deat hs under age 1 am ong t he cum ulat ive populat ion of live bir t hs, r ank ed by socioeconom ic st at us, according t o t he m agnit ude of t he nat ional social
developm ent index , Cost a Rica, 19 9 8 .
1.0 0.9 0.8 0.7 0.6 0.5 0.4 0.3 0.2 0.1 0.0
0.0 0.1 0.2 0.3 0.4 0.5 0.6 0.7 0.8 0.9 1.0 Live births (% cumulative population) ranked by socioeconomic
status according to level of access to potable water Concentration index = –0.18
Deat h s u n d er ag
e 1 d
u e t o A DD (% c u m u lat ive)
perfect equality observed distribution
Annual Report of t he Direct or–2000
ADVANCING THE PEOPLE’S HEALTH
1 6
Pan Am erican Healt h Organizat ion
FIGURE 11b. Healt h needs index , M ex ico, 19 9 7.
–3.32 to –2.47 (Best) –2.47 to –1.21 –1.21 to 0.38
0.38 to 1.88 1.88 to 6.88 (Worst)
FIGURE 11a. Healt h needs index , Br az il, 19 9 7.
–3.97 to –2.84 (Best) –2.84 to –0.87 –0.87 to 1.46
Healt h Sit uat ion Analysis
1 7
FIGURE 11c. Healt h needs index , P er u, 19 9 6 .
–5.65 to –2.42 (Best) –2.42 to –0.68 –0.68 to 0.39
Health in Human
Development
Annual Report of t he Direct or–2000
r
T he populat ion’s healt h
2
is both a product of
society and an indispensable contribution to economic
Healt h in Hum an Developm ent
2 1
he approach that today is known as health in human development is based on the assessment of a popu-lation’s health and its determinants. The concept of population health is the keystone of public health, and something that those who work in this field struggle every day to achieve. If gains are to be made in this regard, it is imperative that we improve our capacity to measure, monitor, and understand the complex dynamic of population health, which re-sponds far less to the usual medical care interventions than to changes in the physical and social environment.
Population health is both a product of society and an indispensable con-tribution to economic growth and political stability. A population’s level of health is, in itself, an excellent indicator of human development. Once this relationship is recognized, it becomes clear that the health sector must be-come more effective in establishing partnerships with other public and pri-vate players, including civil society organizations, as well as in spearheading the advocacy of public policies and programs that promote human health and development.