Vol. 23, No. 3 September 2002
IN THIS ISSUE . . . • Health Situation Analysis:
−
Demographic and Mortality Trends in the Region of the Ameri-cas, 1980-2000−
Epidemiological Situation of Acute Pesticide Poisoning in Central America, 1992-200• Norms and Standards in Epidemiology:
−
Case definitions: Cutaneous Leishmaniasis; Visceral Leishmaniasis−
Epidemiological Calendar 2003 • Anouncements:−
Obituaries: Dr. Ruth Puffer and Dr. Milton Terris−
Pan American Health Organization:
Celebrating 100 Years of Health
Epidemiological Bulletin
Demographic and Mortality Trends
in the Region of the Americas, 1980-2000
This year, the Pan American Health Organization (PAHO)celebrates a century of work towards coordinating efforts of the countries to improve health in the most vulnerable popu-lations of the Americas. In carrying out this effort, one of the essential functions of the Organization during this period has been the collection, analysis, and dissemination of infor-mation on health among the Member States. As part of its constitutional mandates, PAHO prepares since 1954 a qua-drennial report on the health situation and trends in the Amer-icas. Since 1998, this report is published under the title of “Health in the Americas.”1 Its 2002 edition was presented in
the previous issue of this Bulletin. This publication contains PAHO’s analysis of different public health aspects of the population and the organized responses of the health sector. It accounts for the advances in the health conditions of the countries, and documents existing inequalities in the state of health and the access and use of health resources.
Beginning with this issue, a series of articles will be pub-lished in the Bulletin, presenting a summary of the most rele-vant aspects of the health situation contained in “Health in the Americas.” The present article summarizes the situation and trends of the demographic changes, life expectancy at birth, and mortality in the Americas in recent years.
Introduction
“Demographic transition” in a population refers to a pro-cess involving the trends of mortality and fertility rates over time.2 As mortality starts to decline and social and economic
development occur, fertility is expected to drop. In the last decades, reductions in the overall mortality and fertility rates and population growth have been observed in the Americas, intensifying the on-going demographic transition. The con-sequent aging of the population in the presence of other important socio-demographic processes, such as migration and urbanization, has generated specific and complex de-mands for social and health goods and services. In addition, the majority of countries in the Americas have experienced what has been called “epidemiological polarization.”3 This
process is characterized by simultaneous and substantial
impacts on the population’s mortality profile by both com-municable and non-comcom-municable diseases and external caus-es. It is especially evident in the more susceptible population groups such as the poor or elderly. The resulting pattern of mortality magnifies the presence of significant health gaps between different social groups and geographic areas within countries.4 Considering the complex dynamics of the Region’s
demographic and health conditions in the Region, the aim of the present article is to describe important markers of the “demographic transition” process within the Americas, sin-gling out the changes in relevant indicators in recent years. DATASOURCES: This analysis is based on PAHO’s core health
data, using countries from the American Region as geographic units. The countries were grouped into eight sub-regions including North America, Mexico, Brazil, the Latin Caribbean, Central America, the Andean Area, the Southern Cone and the non-Latin Caribbean.4 Demographic data come from the
United Nations Population Division5, 6 and the US Census
Bureau’s International Program Center7. Mortality data come
from PAHO/WHO’s regional database on mortality. The data analysis includes the 19 countries for which data is available for 1980-2000. These countries account for 91.3% of the en-tire population of the Americas in 2001 and include Argenti-na, Barbados, Brazil, Canada, Chile, Colombia, Costa Rica, Cuba, the Dominican Republic, Ecuador, El Salvador, Jamai-ca, Mexico, Panama, Paraguay, Puerto Rico, Trinidad and Tobago, the United Sates, and Venezuela. Mortality rates were standardized by age and sex using the standard population pro-posed by the World Health Organization.8, 9
Demographic Situation
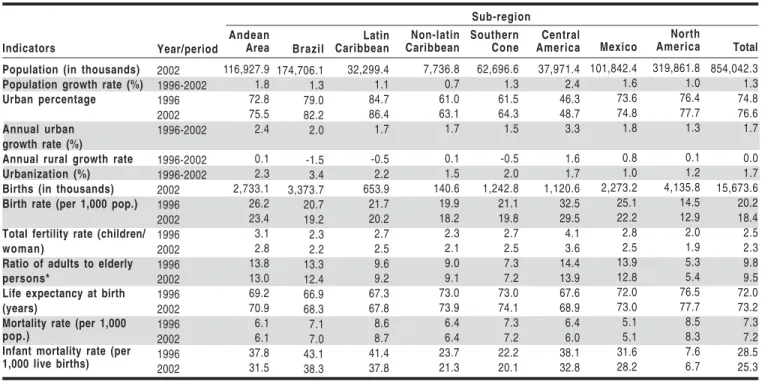
POPULATIONGROWTH: The estimated population in the
URBANIZATION: The population of the Americas is relatively
highly urbanized, particularly in the more industrialized coun-tries (Table 1). In 2002, it was estimated that 76.6% of the Region’s population lived in cities, compared to 41% in 1950. It should be noted, however, that currently the process of urbanization is occurring more rapidly in the less industrial-ized countries. The difference between the growth rate of the urban and the rural populations among the subregions was highest in Brazil with 3.4%, followed by the Andean Area with 2.3% and Latin Caribbean with 2.2%, indicating a faster urbanization process there than in other subregions. Approx-imately half of the largest cities in the Americas are in Latin America. Some 160 million people live in the 20 largest cities, 55 million of them in the largest metropolitan areas of Mexico City, Sao Paulo and New York.
BIRTHANDFERTILITY: There were an estimated 15.7 million births
in the Americas in 2002, about 74% from Latin America and the Caribbean (Table 1). Birth rates are expected to continue declining in the Region, as has already occurred over the past 40 years. In the 1960s, the birth rate in the Americas was 32.5 per 1,000 population, while in 2002 it was estimated to be 18.4 per 1,000. Similarly, a reduction in the fertility rates was also observed, with a decline from 3.1 children per woman in 1980-1985 to 2.3 in 2002. In this period, total fertility rates declined in all sub-regions, but more markedly in Brazil, Cen-tral America, the Andean Area and Mexico.
AGINGANDLIFEEXPECTANCYATBIRTH: Between 1996 and 2002,
the ratio of persons in the 15-64 year-old age group to the population aged 65 and over decreased in the Americas and in all sub-regions, except in North America and the non-Latin Caribbean. However, this indicator remains high in several
areas, especially in Central America, the Andean Area, Mexi-co and Brazil, with values higher than 12:1 (Table 1). Life expectancy at birth (LEB) in the Americas was estimated to be 73.2 years in 2002. This figure is increasing at different rates in all the subregions. Within the Region, the LEB esti-mate was 77.7 years for North America, with all the other sub-regions lagging 3.6 to 10 years behind. On average, this indi-cator for women in the Region is approximately 6.3 years longer than for men, with this difference varying from a low of 5.5 years in the Caribbean to a high of 8 years in Brazil.
Mortality indicators
OVERALLMORTALITY: It was estimated that the mortality rate in
2002 in the Americas will be 7.2 per 1.000 population (Table 1). In the last two decades of the 20th century, the Region has
seen a reduction of about 25% in the mortality rate. This indicator varies little between sub-regions, with rates rang-ing from 5.1 in Mexico to 8.7 in the Latin Caribbean.
INFANTMORTALITY: The infant mortality rate (IMR) in the
Amer-icas is estimated to be around 25.3 deaths per 1,000 live births in 2002, which indicates that a total of 400,000 children in the Region will die before their first birthday (Table 1). However, in 10 years the IMR decreased by almost one-third, from 36.9 deaths per 1,000 live births in 1980-1985. The greatest im-provement occurred in Central America, Brazil, and the Latin Caribbean, with reductions of 45%, 34%, and 30% respec-tively. Since the expected rate of decline is similar in all coun-tries, the subregions that have higher IMR are expected to experience greater absolute declines. The IMR continued to decrease from 1996 to 2002 in all American sub-regions (Ta-ble 1). The vast majority of the countries have lowered their IMR for both sexes.
Indicators
Population (in thousands) Population growth rate (%) Urban percentage
Annual urban growth rate (%) Annual rural growth rate Urbanization (%) Births (in thousands) Birth rate (per 1,000 pop.)
Total fertility rate (children/ woman)
Ratio of adults to elderly persons*
Life expectancy at birth (years)
Mortality rate (per 1,000 pop.)
Infant mortality rate (per 1,000 live births)
Year/period 2002 1996-2002 1996 2002 1996-2002 1996-2002 1996-2002 2002 1996 2002 1996 2002 1996 2002 1996 2002 1996 2002 1996 2002 Andean Area 116,927.9 1.8 72.8 75.5 2.4 0.1 2.3 2,733.1 26.2 23.4 3.1 2.8 13.8 13.0 69.2 70.9 6.1 6.1 37.8 31.5 Brazil 174,706.1 1.3 79.0 82.2 2.0 -1.5 3.4 3,373.7 20.7 19.2 2.3 2.2 13.3 12.4 66.9 68.3 7.1 7.0 43.1 38.3 Latin Caribbean 32,299.4 1.1 84.7 86.4 1.7 -0.5 2.2 653.9 21.7 20.2 2.7 2.5 9.6 9.2 67.3 67.8 8.6 8.7 41.4 37.8 Non-latin Caribbean 7,736.8 0.7 61.0 63.1 1.7 0.1 1.5 140.6 19.9 18.2 2.3 2.1 9.0 9.1 73.0 73.9 6.4 6.4 23.7 21.3 Southern Cone 62,696.6 1.3 61.5 64.3 1.5 -0.5 2.0 1,242.8 21.1 19.8 2.7 2.5 7.3 7.2 73.0 74.1 7.3 7.2 22.2 20.1 Central America 37,971.4 2.4 46.3 48.7 3.3 1.6 1.7 1,120.6 32.5 29.5 4.1 3.6 14.4 13.9 67.6 68.9 6.4 6.0 38.1 32.8 Mexico 101,842.4 1.6 73.6 74.8 1.8 0.8 1.0 2,273.2 25.1 22.2 2.8 2.5 13.9 12.8 72.0 73.0 5.1 5.1 31.6 28.2 North America 319,861.8 1.0 76.4 77.7 1.3 0.1 1.2 4,135.8 14.5 12.9 2.0 1.9 5.3 5.4 76.5 77.7 8.5 8.3 7.6 6.7 Total 854,042.3 1.3 74.8 76.6 1.7 0.0 1.7 15,673.6 20.2 18.4 2.5 2.3 9.8 9.5 72.0 73.2 7.3 7.2 28.5 25.3 Sub-region
Table 1: Demographic and mortality indicators for the Americas, by Subregion, 1996-2002
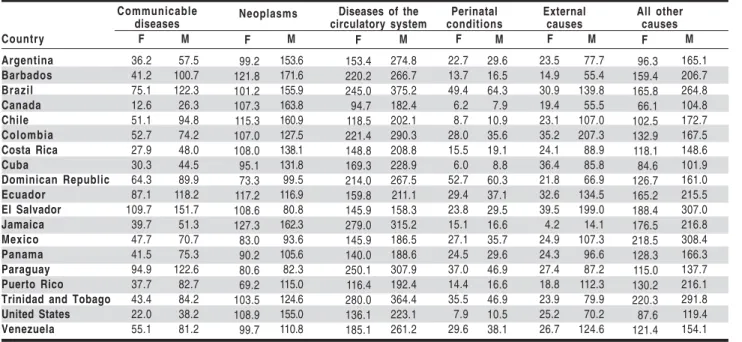
MORTALITYBYBROADGROUPSOFCAUSES:
Communicable diseases: Among the countries selected for analysis, the greatest decline in cause-specific mortality oc-curred in communicable diseases, from 95 per 100,000 popu-lation in 1980 to 57 per 100,000 in 2000. In the early 1980s, the mortality rate for communicable diseases varied from 12.9 per 100,000 population for females in Canada to 282.4 per 100,000 for males in Ecuador. By the end of the 1990s, the variation in this data ranged from 12.6 per 100,000 for females in Canada to 151.7 per 100,000 for males in El Salvador (Table 2). Marked reductions in mortality from communicable diseases occurred in almost all countries analyzed, except in Barbados, Canada, the United States, and Puerto Rico where rates were lowest (Graph 1). This increase was more likely the result of AIDS among young adults, particularly in males.
CHRONICDISEASESANDEXTERNALCAUSESOFDEATHS:
Neoplasms: Between the early 1980’s and the end of the 1990’s, there was an overall decrease in the mortality rates due to neoplasms in most of the countries analyzed, except for Barbados, Ecuador, Mexico, and Trinidad and Tobago for both sexes, and Canada, Cuba, Dominican Republic, Jamaica, and Paraguay for males only. Among the countries analyzed, at the end of 1990s mortality rates due to neoplasms ranged between 69.2 for females in Puerto Rico to 171.6 for males in Barbados (Table 2). Diseases of the circulatory system: In the Region, the greatest risk of dying continues to be due to diseases of the circulatory system with 214 deaths per 100,000 population, a rate almost twice as high as for neoplasms and 4 times greater than external causes. However, at the end of 1990s mortality rates from this group of diseases also de-creased in all countries for both sexes, ranging between 94.7 for females in Canada to 375.2 for males in Brazil (Table 2). In addition, the magnitude of reduction varied from a low of 0.2% for men in Paraguay to a high of 52.8% for men in El Salvador. External causes: Similarly, in many countries there
was also a reduction in mortality rates from external causes for both sexes. The exceptions were for men in Brazil with 5.7% , Colombia with 9.4%, Costa Rica with 3.2%, and Puerto Rico with 4.3% and for women in Costa Rica at 2.1%, Para-guay at 17.7%, and Puerto Rico at 4.3%, where rates increased. The mortality rates from external causes at the end of the 1990’s ranged from 4.2 for females in Jamaica to 207.3 for males in Colombia among the countries analyzed (Table 2).
Concluding remarks
During the latter part of the 20th century, advances in the
demographic transition occurred in the Americas, particular-ly in Latin America and the Caribbean. This process began with an important decline in infant mortality rates and in mor-tality rates due to communicable diseases. Since 1980, most of the countries have halved their mortality rates from com-municable diseases among children under 1 year of age. In addition, besides reductions of mortality rates, especially among younger age groups, for most of the countries of the Americas several factors might have moved this demograph-ic transition forward. These factors include contraception policies, increase of education level, accelerated urbaniza-tion, and economic modernizaurbaniza-tion, among others. In particu-lar, the growth of urbanization in the Americas – three quar-ters of the total population now live in cities – has had impor-tant health implications associated on the one hand with the risk factors related to urban settings, and on the other hand with the possible increase in the access to goods and services. A decline in fertility rates followed and modified these events. An estimated average fertility rate of 3.1 children per woman in 1980-1985 decreased to an estimate of 2.3 children per woman in 2002. These changes in the population’s demo-graphic and mortality profiles, especially the declining fertil-ity rates, have changed the overall age composition of the Region’s population, contributing to a longer life expectancy
Country Argentina Barbados Brazil Canada Chile Colombia Costa Rica Cuba Dominican Republic Ecuador El Salvador Jamaica Mexico Panama Paraguay Puerto Rico Trinidad and Tobago United States Venezuela F 36.2 41.2 75.1 12.6 51.1 52.7 27.9 30.3 64.3 87.1 109.7 39.7 47.7 41.5 94.9 37.7 43.4 22.0 55.1 M 57.5 100.7 122.3 26.3 94.8 74.2 48.0 44.5 89.9 118.2 151.7 51.3 70.7 75.3 122.6 82.7 84.2 38.2 81.2 F 99.2 121.8 101.2 107.3 115.3 107.0 108.0 95.1 73.3 117.2 108.6 127.3 83.0 90.2 80.6 69.2 103.5 108.9 99.7 M 153.6 171.6 155.9 163.8 160.9 127.5 138.1 131.8 99.5 116.9 80.8 162.3 93.6 105.6 82.3 115.0 124.6 155.0 110.8 F 153.4 220.2 245.0 94.7 118.5 221.4 148.8 169.3 214.0 159.8 145.9 279.0 145.9 140.0 250.1 116.4 280.0 136.1 185.1 F 22.7 13.7 49.4 6.2 8.7 28.0 15.5 6.0 52.7 29.4 23.8 15.1 27.1 24.5 37.0 14.4 35.5 7.9 29.6 M 29.6 16.5 64.3 7.9 10.9 35.6 19.1 8.8 60.3 37.1 29.5 16.6 35.7 29.6 46.9 16.6 46.9 10.5 38.1 M 274.8 266.7 375.2 182.4 202.1 290.3 208.8 228.9 267.5 211.1 158.3 315.2 186.5 188.6 307.9 192.4 364.4 223.1 261.2 F 23.5 14.9 30.9 19.4 23.1 35.2 24.1 36.4 21.8 32.6 39.5 4.2 24.9 24.3 27.4 18.8 23.9 25.2 26.7 M 77.7 55.4 139.8 55.5 107.0 207.3 88.9 85.8 66.9 134.5 199.0 14.1 107.3 96.6 87.2 112.3 79.9 70.2 124.6 F 96.3 159.4 165.8 66.1 102.5 132.9 118.1 84.6 126.7 165.2 188.4 176.5 218.5 128.3 115.0 130.2 220.3 87.6 121.4 M 165.1 206.7 264.8 104.8 172.7 167.5 148.6 101.9 161.0 215.5 307.0 216.8 308.4 166.3 137.7 216.1 291.8 119.4 154.1 Communicable diseases Neoplasms
Diseases of the circulatory system Perinatal conditions External causes All other causes
at birth and to the aging of the general population. As the population ages, a new pattern of health services needs and use presents a challenge for the health system.
Although the overall trends of demographic and mortal-ity indicators are described in this article, different degrees of demographic transition can be seen in the American Region. There are countries or territories in more advanced stages of demographic transition, such as Canada, Martinique, Aruba, Montserrat, Bermuda, Barbados, the United States, Cuba and Anguilla, where life expectancies at birth are higher than 76.0 years and fertility rates are lower than 2.0 children per wom-an. At the same time, there are countries with high fertility rates (>3.5 children per woman) in the presence of low life
Obituaries
Ruth Puffer
Dr. Ruth Puffer passed away on 2 September 2002. She was a biostatistician and public health professional born in Berlin, Massachusetts, United States. She obtained her de-grees in Public Health from the Johns Hopkins University and Harvard University. She started her career as Director of Statistical Services in the Department of Public Health for the state of Tennessee.
Between 1953 and 1970, Dr. Puffer served as chief of the Department of Health Statistics of the Pan American Health Organization (PAHO), where she played a key role in the Inter-American Investigation of Childhood Mortality. Two of her research studies: “Patterns of Urban Mortality” (1967) and “Patterns of Mortality in Childhood” (1973), had an im-portant influence on the practice of Public Health in the Re-gion. They are still considered classics of the scientific liter-ature and have had an undeniable impact on health services throughout the hemisphere. In 1978, Dr. Puffer received the Abraham Horwitz Award for Interamerican Health and in 2002, she was one of the “Public Health Heroes of the Americas” selected in celebration of the PAHO Centennial.
Milton Terris
Dr. Milton Terris, an international leader in the field of public health and epidemiology, passed away on 3 October 2002 in South Burlington, Vermont, United States. Dr. Terris worked as a professor and researcher in several schools of Public Health and Medicine in the United States and Canada. His work as an expert in Epidemiology and Health Policy had an important influence on the development of public health in many countries of the world and of the American Region in particular.
In recognition of his work, he was the recipient of multi-ple awards, including the Sedgwick Memorial Medal of the American Public Health Association and the Abraham Lil-ienfeld Award of the American College of Epidemiology, both from the United States. Dr. Terris was founder and editor of
the Journal of Public Health Policy and president of the
National Association for Public Health Policy of the United States. In 1988, he participated as editor in “The Challenge of Epidemiology,” a PAHO publication that is among the clas-sics in the history of epidemiology in the Region of the Amer-icas.
References:
(1) Pan American Health Organization. Health in the Americas: 2002 Edition. Volume 1. Washington, DC:PAHO, 2002. (2) Pan American Health Organization. Assessment of the
1980-1998 Health Situation and Trends in the Americas, por Subregión. Epidemiological Bulletin 20(1):2-10; 1999.
(3) Pan American Health Organization. Health Situation Analysis in the Americas, 1999-2000. Epidemiological Bulletin 21(4):1-3; 2000.
(4) Pan American Health Organization, Special Program for Health Analysis. Health Situation in the Americas. Basic Indicators 2000. Washington, DC: PAHO; 2000. (PAHO/SHA/00.01). (5) United Nations. World population prospects: the 2000 revision.
New York: UN Population Division; 2001.
(6) United Nations. World population prospects: the 1999 revision. New York: UN Population Division; 2000.
(7) US Census Bureau, International Program Center. International Data Base (IDB). Washington, DC: US Census Bureau; 2000. (8) Waterhouse J, et al. [eds]. Cancer incidence in five continents.
International Agency for Research on Cancer (IARC); Lyon, 1976 (Vol. 3, p.456). In: World Health Organization. World Health Statistics Annual 1995. Geneva: WHO; 1996.
(9) Xunta de Galicia, Consellería de Sanidade e Servicios Sociais. Pan American Health Organization, Special Program for Health Analysis. Análisis Epidemiológico de Datos Tabulados (Epidat), Version 2.1 [Computer software for Windows]; 1998
Source: Prepared by the Analysis Group of PAHO’s Special Program for Health Analysis (SHA) from data published in
Health in the Americas, 2002, from PAHO’s Technical Information System (TIS) and Core Health Database.
Graph 1: Percentage reduction/increase in estimated communicable disease mortality rate by sex, adjusted for
age, in selected countries of the Americas, 1980-2000
Epidemiological Situation of Acute Pesticide Poisoning
in Central America, 1992-2000
Introduction
One of the main problems for humanity in the XXI century is the degradation of the environment. Scientific and technolog-ical advances have generated positive developments for hu-mankind, but they have also opened the possibility of altering the planet’s ecological balance and affecting the health of pop-ulations.
Synthetic pesticides are also included in these scientific and technological developments. They are substances pri-marily used to prevent and destroy agricultural pests. They are beneficial in such that they control insect infestation and increase agricultural production. However, they are designed to destroy living organisms and therefore also create hazards for both human and animal health, and the environment. Syn-thetic pesticides have occupied a significant place among the more than 70,000 chemical substances available on the market since 1940 and they have become the principal strate-gy for the control of pests. Worldwide pesticide production doubled between 1970 and 1985 and sales, which in 1970 represented US$ 2,700 million, at the end of the century had reached an annual US$ 40,000 million. Approximately 2,800 million kilograms (kg) were sold during this period, repre-senting 900 active ingredients and more than 50,000 commer-cial formulations. The percentage of these substances used in less industrialized countries has increased in the last three decades from 20% to close to 40%.
It is estimated that about 3% of exposed agricultural workers suffer from an episode of acute pesticide poisoning (APP) every year. More than 50% of all APPs occur in less industrialized countries, though the quantity of pesticides used is less. This illustrates the deficient hygiene and safety conditions under which these products are used. In addition to the acute effects, prolonged periods of low level exposure to pesticides can also produce chronic effects such as damages to the central nervous system, congenital malformations, mu-tagenic effects, cancer, skin, lungs and eye lesions, damage to the immune system, and masculine sterility, among others.
In the seven countries of the Central American Subre-gion (Belize, Costa Rica, El Salvador, Guatemala, Honduras, Nicaragua and Panama), there has been a constant increase in the use of pesticides. In recent years, it reached an annual average of 45 million kg of active ingredients, imported and formulated in 42 plants located in these countries. Unfortu-nately, this increase was accompanied by inappropriate use of the products, deficient storage and production conditions, a lack of understanding of the real health effects due to un-specific symptomatology, and a lack of research on the long term effects of these products on health and environmental deterioration. According to the countries’ registration, 7,000 annual cases of APP are reported every year in this Subre-gion. However, underreporting is still considerable due to diffi-cult access of farm workers to health services, erroneous diag-noses, and problems in registration and reporting.
In light of the problem of the intensive pesticide use in the countries of the Central American Subregion, the Pan American Health Organization (PAHO), through the Division
of Health and Environment, has implemented a project (PLAG-SALUD in Spanish) that is financed by the Danish Agency for International Development (DANIDA), on the occupa-tional and environmental aspects of exposure to pesticides in the Central American Subregion. The purposes of this 10-year project, initiated in 1994, are to significantly reduce the health problems related to pesticides and support the imple-mentation of sustainable agriculture alternatives. To reach this goal, PLAGSALUD has been working in partnership with the ministries of health, agriculture, education, environment, and labor, as well as universities and civil society in each Central American country. Technical cooperation is provid-ed in the following areas: epidemiological surveillance, re-search, education, interinstitutional coordination, and the strengthening of legislation. Epidemiological surveillance provided valuable information, which was used for the anal-ysis in this report.
Methodology
The data collection carried out for this analysis made use of several sources of data and involved the participation of people responsible for the surveillance of these problems in the different countries of the subregion.
The data collected on the importation of active ingredi-ents and the use of pesticides by chemical group and by their classification according to which microorganism they control were obtained from registries of the Ministry of Agriculture for the 1992-2000 period. Based on these data, the trend of pesticide importation for this period was analyzed; further, indicators to evaluate the burden of pesticides were constructed, including the kilograms imported per inhabitant in the general population, per inhabitant in the population economically active in agricul-ture, and per hectare devoted to agriculture.
The data on the number of cases of APP from the coun-tries’ epidemiological surveillance system was used for the epidemiological analyses. Taking into account only the cas-es reported between 1992 and 2000, incidence ratcas-es were cal-culated using the number of cases and deaths reported and each country’s population at mid-period. The population data came from projections of the Central American Population Center of the University of Costa Rica. The case-fatality was calculated using the number of deaths due to APP divided by the total of reported APP cases.
The statistical analysis is descriptive, showing trends of the epidemiological indicators by year and country, with proportional distributions to stratify the information by dif-ferent variables. The cases of APP by sex and cause were estimated from the proportional distributions presented by the countries in their epidemiological information for these variables.
Results
BURDENOFPESTICIDESINTHE CENTRAL AMERICAN SUBREGION
The population of the Central American Subregion is currently nearly 35 million inhabitants, half of which live in rural areas, mainly in Guatemala and Honduras. In the coun-tries of the Central American Subregion and in many others of Latin America, a significant proportion of the economical-ly active population works in the agricultural sector. The highest proportion of the territory devoted to agriculture is found in El Salvador, Costa Rica, and Nicaragua, where the main products are coffee, sugarcane, grains such as rice, beans and corn, vegetables, banana, tobacco, and flowers. Between 85% and 90% of the imported pesticides are used in this sector annually, often by communities that have little access to social security or live in areas of limited health coverage.
The importation of Pesticides in the Central American Subregion has increased progressively. Between 1994 and 2000, it went from 34 to 45 million kg, an increase close to 32% in only 6 years. This subregion presents the highest rate of consumption per capita of these substances, amount-ing to nearly 1.5 kg of pesticides per person per year. In 2000, the burden of pesticides per economically active person devot-ed to agriculture in the region (6.7 kg/person) represents five times that of the general population (1.3 kg/person) (Graph 1). From 1992 to the year 2000, the burden of these substances in the Subregion went from 4.5 kg by agricultural worker to 6.7 kg. Among the three principal pesticide groups defined by microorganism they control, insecticides and fungicides showed a decline in the Region during the period, whereas herbicides showed a considerable increase, with imports going from 6.3 to 14.6 million kg between 1992 and 2000, an increase of 129%.
ACUTEPESTICIDEPOISONING
Acute pesticide poisoning has clinical manifestations similar to many common diseases which signs and symp-toms or signs during physical examination are not specific. Because of this, APP is a cause of morbidity that is often not recognized. Knowledge of the person’s exposure to occupa-tional or environmental factors is of vital importance for di-agnosis, treatment, and rehabilitation, as well as for public health purposes. For this reason, it is essential to obtain an adequate history of any occupational or environmental ex-posure that may cause and even exacerbate a health prob-lem. This also permits to search for other cases in the family, the workplace, or the community and to obtain environmen-tal data. Generally, the registration of cases in Central Amer-ica is limited in coverage and the levels of underreporting are high. Most of the available data comes from isolated studies. However, efforts have been made recently to strengthen sur-veillance of APP in countries of the Subregion.
The incidence rate of APP in the Central American Sub-region is close to 20 cases per 100,000 population, with a
Graph 1: Imported pesticides by country and in the Central American Subregion, 2000
progressively increasing risk for the period, from rates of 6.3 per 100,000 population in 1992 to 19.5 in the year 2000 (Graph 2). This increase may be related to an increase in surveillance efforts and therefore should be taken with caution. There were 6,934 cases of APP in the year 2000. For this year, the greatest number of cases was registered in El Salvador (2,349), followed by Nicaragua (1,651) and Guatemala (1,060). If the risk is analyzed by country and for the period 1998-2000 — when the epidemiological surveillance system was already functioning — high risk countries with respect to the medi-um incidence rate are Nicaragua and El Salvador, with rates higher than 35 per 100,000 population, and low-risk coun-tries are Honduras, Belize, and Guatemala, with rates lower than 10 per 100,000.
The data obtained through the surveillance system show that the 12 pesticides responsible for the greatest number of APP are Paraquat, Aluminium Phosphide, Methyl-Parathion, Metamidophos, Monocrotophos, Chlorpyrifos, Terbufos, Etoprop, Endosulfan, Carbofuran, Methomyl, and Aldicarb. It should be pointed out that these pesticides are of a high toxicity [levels Ia (extremely dangerous) and Ib (highly dan-gerous) in the WHO toxicological classification of pesticides]. There are less toxic alternatives to all of them and their use could be abandoned.
MORTALITYFROMACUTEPESTICIDEPOISONING
The mortality rates also show a rising trend in the peri-od, with a risk of death of 0.3 per 100,000 population in 1992 increasing to 2.1 in 2000 (Graph 2). As in the case of the morbidity data, these could be related to better surveillance and a greater awareness of medical personnel.A slight de-cline was registered between 1999 and 2000, from 867 to 748 deaths. Comparing the country rates with the average mor-tality for the 1998-2000 period, El Salvador and Nicaragua are considered high-risk countries with rates higher than 4 per 100,000 population and Belize, Costa Rica and Honduras appear in the low-risk countries with a mortality rate lower than 1. CASE-FATALITYOFACUTEPESTICIDEPOISONING
fatality increase to 11% in 2000 may be due to a gradual im-provement of the detection of fatal cases. This proportion is higher in El Salvador, Nicaragua, and Guatemala and indi-cates the severity of this health problem in comparison with other public health issues in the Subregion. However, this figure may also reflect a greater capture of the fatal forms of poisoning. It is also important to advance efforts to improve the training of health professionals in identifying and man-aging cases of APP properly.
RELATIONSHIPBETWEENTHEBURDENOFPESTICIDESANDTHEBE -HAVIOROFPOISONING
The number of kilograms of pesticides imported to the Subregion and the incidence rates of APP were compared using the correlation between these two indicators during the study period (1992-2000). A positive correlation was found (Spearman Correlation r=0.83, p=0.005), indicating a steady increase in pesticide imports and in turn an increase in the incidence of APP in the Region over this period. If there is no improvement in occupational safety, this could lead to an increase in the risk of APP associated with pesticide imports and use.
ACUTEPESTICIDEPOISONINGACCORDINGTOVARIABLESOFINTEREST
In people under 15 years of age, 816 cases of APP were registered (5.7 per 100,000 population under age 15) and 27 deaths (0.2 per 100,000) in the Subregion in the year 2000. This risk is smaller than that registered for the total popula-tion. Underreporting affecting the entire situation analysis deserves special attention in this age group, even more so because this group is highly vulnerable to exposure to these substances. Acute pesticide poisoning impacts a greater pro-portion of men, who represent approximately 70% of all cas-es, with a very similar pattern in all the countries.
The causes of APP presented are based on the following case classification, which depends on the circumstance of exposure:
- Occupational: Exposure to pesticides during work or pro-cesses derived from the latter, such as manufacture, formu-lation, storage, transportation, application, and final dis-posal.
- Accidental: Exposure to pesticides that occurs uninten-tionally and unexpectedly.
- Intentional: Exposure to pesticides with intent to cause harm. This includes suicide attempts, suicides, and homicides. In the year 2000, 36% of the cases of APP were occupa-tional, followed by those with intentional and accidental ori-gins. There are major variations in the proportion of each type of origin by country: in Guatemala, 60% are occupation-al poisoning, in Belize 50%, in Panama 41%, in Costa Rica 37%, in Nicaragua 33%, and in El Salvador 27%. When con-sidering the cases of occupational APP registered in these countries with respect to the economically active population devoted to agriculture, assuming this population is the most highly exposed, incidences reach 48 per 100,000 agricultural workers in 1999 and 37 in 2000, close to twice the risk regis-tered for the general population. Nicaragua, Panama, and Gua-temala show a particularly high risk.
UNDERREGISTRATION
Although the reporting of APP has improved in the last two years, the number of cases reported remains low. There are different reasons for the lack of registration of APP, the most important being: 1) the person with APP does not seek care in health centers (by lack of knowledge of the signs and symptoms, fear of losing their employment, difficulty of ac-cess to health services, cultural standards not favorable to seeking care, mild cases that do not seem to require care); 2) the person with APP seeks medical care but diagnosis is not done or not reported correctly; and 3) the person intoxicated seeks medical care, is diagnosed and reported, but for admin-istrative reasons the report is not registered in the epidemio-logical surveillance system.
In light of this situation, the PLAGSALUD project con-ducted a study of underregistration in each of the seven countries during the year 2001. In six countries it was accom-plished through community surveys and in one through ad-ministrative underregistration research (analysis of the infor-mation system that supports epidemiological surveillance in the health system). The general underregistration results were the following:
Belize: 99%
Costa Rica: Canton #1: 97.8% Canton #2: 96.7% Canton #3: 91.2% Canton #4: 82.2% El Salvador: 97% (municipal level)
77% (departmental level) 80% (national level)
Guatemala: 97.5% (municipal and departmental levels)
Nicaragua: 98.0%
Honduras: administrative underregistration was less than 20%
Panama: 93.6%
Graph 2: Pesticide importation trends, pesticide poisoning incidence and mortality rates in countries of
the Central American Subregion, 1992-2000
The previous information implies that, in general, be-tween one and 20 of every 100 cases of APP are reported, except in Honduras where only administrative underreport-ing was studied.
Conclusion
when the pesticides are classified by the type of organism they are designed to control, herbicides show a rising trend. Compared to the WHO estimates of an average pesticide bur-den at the global level of 0.6 kilograms per person, the burbur-den in the Region remains very high. For 2000, the Regional inci-dence rate was close to 20 cases per 100,000 population and the mortality rate was 2.1 per 100,000 population. Cases of acute poisoning and mortality also show a rising trend. This trend may reflect a better registration system or problems due to a poor management or a greater dangerousness of this type of substances. Nicaragua and El Salvador show the high-est risk. However, given the increase in imports of these sub-stances in countries such as Guatemala and Honduras, the lower risk may reflect an underregistration problem. The case fatality associated with pesticide poisoning is high. In 2000, 11% of the APP cases resulted in death. As a response, health personnel should be trained in the management of these sit-uations, and strict prevention and control activities should be put in place. Major efforts should be made to develop and implement strategies that lead to a drastic reduction of the use of synthetic pesticides, to the development of alterna-tives and subsequently to the protection of human health and the environment. Different initiatives supported by PLAGSA-LUD in the Central American Subregion are presented in Box 1. Recommendations for surveillance, prevention, and control of acute pesticide poisoning
In light of these major challenges facing Central America to control these problems, we can mention the following:
–
Promote epidemiological surveillance systems that per-mit the constant monitoring of patterns of the problem both in terms of human health and the environment, in order to correctly direct prevention and control activi-ties in a more effective and pertinent way. This requires the improvement of the data’s quality.–
To better analyze occupational poisoning, it is neces-sary that each country of the region generate more pre-cise and reliable case data.–
Improve epidemiological surveillance actions that are being put in place with regard to: poor completion of notification reports, more detailed analysis by cause and most often found pesticides; period of the year in which the poisoning occurs; toxicological classification of the pesticides; and severity of the poisoning, among others.–
Support the development of alternatives to pesticides, such as integrated pest management (IPM) and organic agriculture, which constitute a production system based on appropriate management practices. These practices should take into account conditions for biological ac-tivities in agrosystems to be developed appropriately, i.e. in a less dependent, polluting and dangerous way.–
Promote and organize citizen participation, particularly that of the most exposed workers and communities, per-mitting direct involvement in the decision-making pro-cess in the different territorial entities. For that to hap-pen, access to up-to-date and complete information on pesticides is required.The following are among the initiatives developed for the prevention and control of the different health and environmental problems derived from the use of pesticides:
Legislation
The ministers of health of the countries of the Subregion ratified, during the XVI Special Meeting of the Health Sector of Central America and the Dominican Republic, an agreement on restrictions and prohibitions of pesticides (Agree-ment no. 9). Through this agree(Agree-ment, it was requested of the ministries of health, agriculture, environment and natural resources to initiate the process of restricting the 12 pesticides responsible for the greatest morbidity and mortality by APP in the Central American Isthmus (Methyl-parathion, terbufos, etoprop, aldicarb, metamidophos, methomyl, monocrotophos, carbuforan, endosulfan, aluminium phosphide, paraquat and chlorpyrifos). Furthermore, in order to bring about stronger legislative actions, the countries were urged to standard-ize the prohibition of 107 additional pesticides currently prohibited in one or more countries. El Salvador and Nicaragua have spearheaded this process by prohibiting 35 and 17 pesticides in 2000 and 2001, respectively. In Belize, control is being performed through a classification of pesticides of restricted use, listing the 40 most toxic insecticides. A special license is required to buy these substances.
Epidemiological Surveillance
Surveillance of acute pesticide poisoning was incorporated in the surveillance systems of the seven countries. With the information obtained in the countries, it has been possible to design prevention and control strategies to intervene on the risk factors. Furthermore, environmental surveillance has been strength-ened through studies of pesticide residues in food in several countries, and the monitoring of the presence of pesticides in the environment, specifically in water, as occurred in the flooded areas of Honduras after Hurricane Mitch. Community participation
One of the most effective and practical results of PLAGSALUD is the creation
Box 1: Initiative of prevention and control of APP supported by PLAGSALUD in the Central American isthmus in the seven countries of over 350 intersectoral local commissions on pesticides (CLIPs for their Spanish name, “Comisión local intersectorial de plaguicidas”), which gather hundreds of members working at the local level, from farmers to government workers, community representatives, and NGO workers. These commissions are the liveliest expression of the day to day work carried out in Central America to reduce the negative effects of pesticides, to educate the general population on the risks of these substances, and to find and apply alternatives to these substances. Education
Educational material has been prepared, both at the subregional and country level, for workers, the community in general, technicians and professionals in the health, agriculture, labor, education, and environmental sectors. Gua-temala is making particular efforts in education. In the last three years, 30,000 people have been trained in insecticide management and alterna-tives to these, with an emphasis in the six regions with greater problems. These educational activities have been carried out using educational mate-rials translated in several Mayan tongues. Formal education has also been encouraged through distance learning courses, continuing medical educa-tion of health personnel and other nonmedical personnel working in poison-ing prevention and the control of environmental pollution by these substances. Search for alternatives to pesticides
References:
Aguirre E. Informe de intoxicaciones por plaguicidas, Costa Rica, 1999-2000. San José, Costa Rica; 2001.
ASDI/Pan American Health Organization. XVI Reunión del Sector Salud de Centroamérica y República Dominicana (RESSCAD), Informe Final. Honduras, 2000.
Economic Commission for Latin America and the Caribbean. Población económicamente activa 1980-2000. Boletín No. 64.
Source: Prepared by Dr. Samuel Henao from the Environmental Quality Program (HEQ) of PAHO’s Division of Health and Environment (HEP) and by Dr. Maria Patricia Arbelaez from the Public Health Department of the University of Antioquia, Medellin, Colombia.
Standardization: A Classic Epidemiological Method for the
Comparison of Rates
Introduction
One of the fundamentals of health situation analysis (HSA) is the comparison of basic health indicators. Among other objectives of HSA, this allows to identify risk areas, define needs, and document inequalities in health, in two or more populations, in subgroups of a population, or else in a single population at different points in time. Crude rates, whether they represent mortality, morbidity or other health events, are summary measures of the experience of popula-tions that facilitate this comparative analysis. However, the comparison of crude rates can sometimes be inadequate, par-ticularly when the population structures are not comparable for factors such as age, sex or socioeconomic level. Indeed, these and other factors influence the magnitude of crude rates and may distort their interpretation in an effect called confounding (box 1).1, 2, 3
The calculation of specific rates in well defined sub-groups of a population is a way of avoiding certain con-founding factors. For example, specific rates calculated by age groups are often used to examine how diseases affect people differently depending on their age. However, although this uncovers the patterns of health events in the population and allows for more rigorous comparison of rates, it can some-times be impractical to work with a large number of sub-groups.4 Furthermore, if the subgroups consist of small
pop-A confounding effect appears when the measurement of the effect of an exposure on a risk is distorted by the relation between the exposure and other factor(s) that also influence(s) the outcome under study.1 Similarly, a confounding factor (or confounder) must meet three criteria: 1) to be a known risk factor for the result of interest,2 2) to be a factor associated with exposure but not a result of exposure2 and 3) to be a factor that is not an intermediate variable between them.
An example is that of smoking as a counfounder in the study of coffee consumption as risk factor for ischemic heart disease. The association between coffee consumption and ischemic heart disease may be confounded by smoking. Indeed, smoking is a known risk factor for ischemic heart disease. It is associated with coffee consumption as smokers are usually consumers of coffee, but it is not a result of drinking coffee. Smoking is not an intermediate variable between coffee consumption and ischemic heart disease. Schematically:
Box 1: Definition of Confounding
Sources:
(1) Last J. A Dictionnary of Epidemiology. Fourth Edition. New York, New York: Oxford University Press. 2001
(2) Gordis L. Epidemiology. Second Edition. Philadelphia, PA: W.B. Saunders Company. 2000 Coffee consumption
Smoking
Ischemic heart disease
Smoking is a confounder of the association between coffee consumption and ischemic heart disease.
–
Establish controls for pesticides posing greater human health and environmental hazard through: prohibition of pesticides in their countries of origin, prohibition of sub-stances belonging to persistent organic pollutants, ho-mogeneity of pesticides prohibited in all the countries of the subregion, strictest controls for the sale of products that have produced the greatest number of APP, ade-quate elimination of residues and containers, prohibi-tion of applicaprohibi-tion by women and children, and selec-tion of pesticides based on molecules found in fungi, bacteria, and plants that act on the pest organism and induce resistance of the same.–
Better controls on compliance using existing legislation.–
One of the biggest problems in the subregion is the stan-dardization in all the countries of the list of prohibited pesticides. This standardization is required in order to improve controls at customs, in the field, at the points of sale, and generally in the enforcement of existing legisla-tion.–
Improve the conditions of hygiene and safety for farm workers and their families, who are the population with greater exposure to these substances.Accessed in October 2001. http://www.cepal.cl/publicaciones/ poblacion/9/LCG2059/BD64.html
Corriols, Marianela. Indicadores agro sanitarios de la exposición laboral agrícola a plaguicidas en Nicaragua. Manejo Integrado de Plagas,CATIE 2001;60.
University of Costa Rica. Datos demográficos. Centro Centroamericano de Población. San José, 2001.
Ministerio de Salud de Chile, Departamento de Epidemiología, Red Nacional de Vigilancia Epidemiológica de Plaguicidas. Situación epidemiológica de las intoxicaciones agudas por plaguicidas. Chile, 1998. Santiago, Chile; 2000.
Henao S. Utilización de plaguicidas sintéticos, un problema por resolver en el nuevo milenio. Manejo Integrado de Plagas, CATIE 2000;55.
Kegley S. California Pesticide Use Update. Global Pesticide Campaigner 2001;11(2):4.
Pan American Health Organization/World Health Organization, PLAGSALUD. Pesticide free, Central America attemps to revert indiscriminate use. MASICA 2001.
Pan American Health Organization/World Health Organization, PLAGSALUD. Plaguicidas y salud en el Istmo Centroamericano. Washington, DC:OPS (En edición).
Pan American Health Organization, Special Program for Health Analysis. Health Situation in the Americas, Basic Indicators 2000. Washington, DC:OPS;2000. (PAHO/SHA/00.01)
United Nations Development Program/European Union. Estado de la Nación, Séptimo informe. San José, Costa Rica; 2001.
ulations, the specific rates can be very imprecise. The pro-cess of standardization (or adjustment) of rates is a classic epidemiological method that removes the confounding ef-fect of variables that we know — or think — differ in popula-tions we wish to compare. It provides an easy to use summa-ry measure that can be useful for information users, such as decision-makers, who prefer to use synthetic health indices in their activities.
In practice, age is the factor that is most frequently ad-justed for. Age-standardization is particularly used in com-parative mortality studies, since the age structure has an im-portant impact on a population’s overall mortality. For exam-ple, in situations with levels of moderate mortality, as in the majority of the countries of the Americas, an older popula-tion structure will always present higher crude rates than a younger population.
There are two main standardization methods, character-ized by whether the standard used is a population distribu-tion (direct method) or a set of specific rates (indirect meth-od). The two methods are presented below.
Direct method
In the direct standardization method, the rate that we would expect to find in the populations under study if they
all had the same composition according to the variable which effect we wish to adjust or control (such as age, socioeco-nomic group, or other characteristics) is calculated. We use the structure of a population called “standard”, stratified ac-cording to the control variable, and to which we apply the specific rates of the corresponding strata in the population under study. We thus obtain the number of cases “expected” in each stratum if the populations had the same composition. The adjusted or “standardized” rate is obtained by dividing the total of expected cases by the standard population. An example is presented in box 2.
An important step in the direct standardization method is the selection of a standard population.3 The value of the
adjusted rate depends on the standard population used, but to a certain extent this population can be chosen arbitrarily, because there is no significance in the calculated value itself. Indeed adjusted rates are products of a hypothetical calcula-tion and do not represent the exact values of the rates. They serve only for comparisons between groups, not as a mea-sure of absolute magnitude.3 However, some aspects should
be taken into account in the selection of the standard popu-lation. The standard population may come from the study population (sum or average for example). In this case
howev-Box 2: Comparison of general age-standardized mortality rates in Mexico and the United States, using the direct method, 1995-1997
Source of the data: Pan American Health Organization. Perfiles de mortalidad de las comunidades hermanas fronterizas México - Estados Unidos Edición 2000 / Mortality profiles of the Sister Communities on the United States-Mexico border 2000 Edition. Washington, D.C.: OPS. 2000
Age-adjusted mortality rateMexico = 6.4 per 1,000 pop. and Age-adjusted mortality rateUnited States = 5.7 per 1,000 pop. <1
1-4 5-14 15-24 25-44 45-64 65+
Standard Population (1)
2,400 9,600 19,000 17,000 26,000 19,000 7,000
100,000
Mexico (2)
1,693.2 112.5 36.2 102.9 209.6 841.1 4,967.4
United States (3)
737.8 38.5 21.7 90.3 176.4 702.3 5,062.6
Mexico (4) = (1)x(2)/100,000
41 11 7 17 55 160 348
639
United States (5) = (1)x(3)/100,000
18 4 4 15 46 133 354
574 Age-specific mortality rate per 100,000
population, 1995-1997 Expected number of deaths
In this example, the standard population that was used is the so-called “old” world standard population defined by Waterhouse (see Box 3). The crude mortality rate for all ages in the United States for 1995-1997 is 8.7 per 1,000 population. In Mexico it is much lower: 4.7 per 1,000 population. We can conjecture that the higher rate in the United States may be due to an older population structure than in Mexico. Therefore, we wish to study the rates of the two countries when controlling for the effect of the age structure difference.
In this example, to use the direct method we need:
- The specific mortality rates by stratum of the characteristic we want to control, in this case age, in each population (i.e. Mexico and the United States) - A standard population, stratified in the same way
First we calculate the expected number of deaths in both countries, applying the rate of each country to the standard population (columns (4) and (5)). The sum of all the groups gives us the total of expected deaths.
To calculate the adjusted rate, we divide this number by the total standard population.
er, it is important to ensure that the populations do not differ in size, since a larger population may unduly influence the adjusted rates.5 The standard population may also be a
pop-ulation without any relation to the data under study, but in general, its distribution with regard to the adjustment factor should not be radically different from the populations we wish to compare.
The comparative study of adjusted rates may be carried out in different ways: we can calculate the absolute ence between the rates, their ratio, or the percentage differ-ence between them. Obviously, this comparison is valid only when the same standard was used to calculate the adjusted rates. When the national standards change (as in the United States in 1999 for example, when a new standard was adopted based on the 2000 population instead of the 1940 standard), the time series have to be recalculated at all levels. Updating the standard populations provides a more current common standard. For comparison of rates from different countries, the standard population used by WHO and PAHO is the so-called “old” standard population defined by Waterhouse.6
The age distribution of this population is shown in Box 3. The direct method is most often used. However, it re-quires rates specific to population strata corresponding to the variable of interest in all the populations we wish to com-pare, which are sometimes not available. Even when these specific rates are available for all the subgroups, they are sometimes calculated from very small numbers and can be very imprecise. In this case, the indirect standardization meth-od is recommended.3
Indirect method
Indirect standardization is different in both method and interpretation. An example of adjustment using the indirect method is presented in box 4. Instead of using the structure of the standard population, we utilize its specific rates and
apply them to the populations under comparison, previously stratified by the variable to be controlled. The total of expect-ed cases is obtainexpect-ed this way. The Standardizexpect-ed Mortality Ratio (SMR) is then calculated by dividing the total of ob-served cases by the total of expected cases. This ratio allows to compare each population under study to the standard population. A conclusion can be reached by simply calculat-ing and lookcalculat-ing at the SMR. A SMR higher than one (or 100 if expressed in percentage) indicates that the risk of dying in the observed population is higher than what would be ex-pected if it had the same experience or risk than the standard population. On the other hand, a SMR lower than one (or 100) indicates that the risk of dying is lower in the observed population than expected if its distribution were the same as the reference population. The actual adjusted rates can also be calculated using the indirect method by multiplying the crude rate of every population by its SMR.4 Just like in the
direct method, a single value is obtained for every popula-tion which, even though it only represents an artificial num-ber, takes into account the differences in the compositions of the populations.
Standardized Mortality Ratios are frequently used in epidemiology to compare different study groups, because they are easy to calculate and also because they provide an estimate of the relative risk between the standard population and the population under study. However, it is important to know that there are instances when this comparison is not adequate, like for example when the ratios of the rates in the groups under study and in the population of reference are not homogeneous in the different strata.7 However, the
com-parison between each group and the population of reference is always relevant. The SMRs of different causes in a popu-lation may also be calculated using a single standard. Conclusion
As with any summary measure, adjusted rates may hide great differences between groups, which can be of impor-tance to explain changes in the rates due to or associated with the variable that we wish to adjust for, for example. Nev-ertheless, whenever possible it is important to analyze the specific rates along with the adjusted rates. The two meth-ods used in a single population should lead to the same con-clusions. If it were not the case, the situation in the different population strata requires more in-depth research.4
One of the reasons for sometimes limited use of these methods is the lack of tools or instruments that simplify it. To respond to this need, the General Direction of Public Health of the Xunta de Galicia and PAHO’s Special Program for Health Analysis have developed the “EpiDat” computer package for analysis of tabulated data. EpiDat is distributed free of charge via the Internet at: http://www.paho.org/Spanish/SHA/ epidat.htm. A newer version of this package will be issued soon. The software SIGEpi (see http://www.paho.org/English/ sha/be_v22n3-SIGEpi.htm), which combines the capacity of a geographic information system with epidemiological tools, also allows to generate adjusted rates.
In short, adjusted rates allow for more exact compari-sons between populations. This is important because it can be used in setting priorities between groups. Nevertheless, the crude rates are the only indicators of the real dimension or magnitude of a problem and hence remain valuable public health tools.
Box 3: “Old” Standard Populations (World and European)
Age groups (Years) 0 1-4 5-9 10-14 15-19 20-24 25-29 30-34 35-39 40-44 45-49 50-54 55-59 60-64 65-69 70-74 75-79 80-84 85+ Total
World 2,400 9,600 10,000 9,000 9,000 8,000 8,000 6,000 6,000 6,000 6,000 5,000 4,000 4,000 3,000 2,000 1,000 500 500 100,000
European 1,600 6,400 7,000 7,000 7,000 7,000 7,000 7,000 7,000 7,000 7,000 7,000 6,000 5,000 4,000 3,000 2,000 1,000 1,000 100,000
Source: Prepared by the Analysis Group of PAHO’s Special Program for Health Analysis (SHA)
Box 4: Use of indirect standardization to compare mortality in the Colombian department of Vichada and mortality in Colombia in general, 1999
Source of the data:
(1) Ministerio de Salud de Colombia, Instituto Nacional de Salud de Colombia, PAHO/WHO Representation in Colombia. Situación de Salud en Colombia, Indicadores Básicos 2002. Bogotá, Colombia: Ministerio de Salud, PAHO; 2002.
(2) Ministerio de Salud de Colombia. La Salud en Colombia - Diez años de información. Santafé de Bogotá, Colombia. 1994
NOTE: Confidence interval for SMRs
The confidence interval provides the range of values within which we expect to find the real value of the indicator under study, with a given probability. That way, it gives an estimate of the potential difference between what is observed and what is really happening in the population, which helps in interpreting the value of the observed indicator. The 95% confidence interval is the most used. As mentioned previously, it indicates the range of values within which we expect to find the real value of the indicator, with a probability of 95%.
In the case of the SMR, the calculation of the confidence interval can be carried out in the following way:
1) First, the Standard Error (SE) for the SMR is calculated using the following formula:
deaths observed
SMR SE =
2) The 95% Confidence Interval (CI) is calculated as follows: CI(95%) ⇒SMR ±(1,96 xSE)where 1.96 is the value of the Z distribution with a level of
confidence of 95%. It is assumed that the values follow a normal distribution.
In this example: SEVichaca = 15.9 and CIVichaca (95%) = [174.1 ; 205.9]
The confidence interval indicates that we know with a probability of 95% that the SMR’s value is between 174.1 and 205.9. The crude mortality rate in Colombia in 1999 was 4.4 per 1,000 population, with variations between 1.8 per 1,000 population in the department of Vichada and 6.9 per 1,000 in Quindio.1 We would like to study the possible significant differences in the observed mortality (or in the risk of dying) in the country and in its departments. The case of the state of Vichada is presented in this example.
In this case, in order to use the indirect method we need: - The age-specific mortality rates by age group in Colombia - The population of the state of Vichada stratified by age
- The total number of deaths observed in the department of Vichada
The first step is to calculate the expected number of deaths in Vichada by applying the standard rates to the population of the department (column (3) = (1) x (2)). Then the calculated deaths are summed up and the SMR is calculated by dividing the total number of observed deaths by the expected deaths.
Age-specific mortality rates, per 100,000 pop. Colombia, 19991
(1)
339 34 219 752 4,573
Population of the Department of
Vichada1 (2)
2,364 4,390 10,002 2,503 513
19,772
Expected deaths in Vichada
(3)
39 7 27 53 84
267
The SMR of 53% indicates that in the population of Vichada the risk of dying is 47% less than expected according to the mortality standards of all of Colombia, controlling for the age variable. 0-4
5-14 15-44 45-64 65 and more
Observed deaths in Vichada, 19991
61 5 27 22 27
142
References:
(1) Last J. A Dictionary of Epidemiology, Fourth Edition. New York, New York: Oxford University Press. 2001
(2) Jenicek M, Cléroux R. Epidemiología: Principios, Técnicas y Aplicaciones. Barcelona, España: Salvat Editores. 1987 (3) Gordis L. Epidemiology. Philadelphia, PA: W.B. Saunders
Company. 1996
(4) Pagano M, Gauvreau K. Principles of Biostatistics. Belmont, California: Wadsworth, Inc. 1993
(5) Kramer S. Clinical Epidemiology and Biostatistics. A primer for Clinical Investigators and Decision-makers. Berlin Heidelberg,
German: Springer-Verlag. 1988
(6) Waterhouse J et al. (eds.). Cancer incidence in five continents, Lyon, IARC, 1976.
(7) Szklo M, Nieto J. Epidemiology, Beyond the basics. Gaithersburg, MD: Aspen Publishers, Inc. 2000
(8) Xunta de Galicia, Consellería de Sanidade e Servicios Sociais. Pan American Health Organization, Special Program for Health Analysis. Análisis Epidemiológico de Datos Tabulados (Epidat), Version 2.1 [Computer software for Windows]; 1998
53% 100 x 267 142
Case Definitions
Cutaneous Leishmaniasis
Rationale for surveillance
Cutaneous leishmaniasis is endemic in over 70 countries. The yearly incidence is estimated at 1,500,000 cases. The disease has several clinical forms: localized cutaneous leishmaniasis, diffuse cutaneous leishmaniasis, the most difficult to treat, and (in the western hemisphere mainly) mucocutaneous leish-maniasis, which is the most severe form as it produces disfig-uring lesions and mutilations of the face. In foci where man is believed to be the sole reservoir (anthroponotic foci), epi-demics are linked to human migrations from rural to poor suburban areas; in zoonotic foci, where mammals are the res-ervoirs, epidemics are related to environmental changes and movement of non-immune people to rural areas.
Surveillance is essential to establish disease impact and to monitor efforts towards the control of disease and the detec-tion of epidemics.
Recommended case definition
Clinical description
Appearance of one or more lesions, typically on uncovered parts of the body. The face, neck, arms, and legs are the most common sites. At the site of inoculation a nodule appears, and may enlarge to become an indolent ulcer. The sore re-mains in this stage for a variable period of time before heal-ing, and typically leaves a depressed scar. Other atypical forms may occur. In some individuals, certain strains can dis-seminate and cause mucosal lesions. These sequelae involve nasopharyngeal tissues and can be very disfiguring.
Laboratory criteria for diagnosis
– positive parasitology (stained smear or culture from the lesion)
– mucocutaneous leishmaniasis only: positive serology (IFA, ELISA).
Case classification
WHO operational definition
A case of cutaneous leishmaniasis is a person showing clin-ical signs (skin or mucosal lesions) with parasitologclin-ical con-firmation of the diagnosis (positive smear or culture) and/or, for mucocutaneous leishmaniasis only, serological diagno-sis.
Recommended types of surveillance
At peripheral level individual patient records must be retained for investigation and case management.
Routine monthly reporting of aggregated data of cases from periphery to intermediate and central level.
Active case finding through surveys of selected groups or mass surveys (standardized and periodical) is an alternative to estimate the prevalence of cutaneous leishmaniasis.
International: annual reporting from central level to WHO (limited number of countries).
Recommended minimum data elements
Individual patient records at peripheral level:
Leishmaniasis data: clinical features, date of diagnosis, para-sitological (Mucocutaneous leishmaniasis only) and sero-logical diagnosis, Leishmania species, treatment outcome. Identification data: unique identifier, age, sex, geographical information, past travels, duration of stay at current residence.
Aggregated data for reporting:
Number of cases by age, sex, type of diagnosis.
Recommended data analysis, presentation, reports Tables: Incidence by geographical area, by age, by sex, by type of diagnosis, by month / year.
Point prevalence (if active case detection). Maps: Incidence by village.
Principal uses of data for decision-making
– Evaluate the real extent of the problem and the main pop-ulations at risk
– Improve and focus the control activities
– Improve management and follow-up of cutaneous leish-maniasis, disseminated cutaneous leishmaniasias and mucocutaneous leishmaniasis patients (WHO guide-lines)
– Identify technical and operational difficulties – Evaluate impact of control interventions – Anticipate epidemics
Special aspects
The prevalence of cutaneous leishmaniasis tends to be gross-ly underestimated because most of the official data are ob-tained through passive case detection only. Other factors that may lead to misdiagnosis or non-diagnosis are: wide scatter of foci, limited access to medical facilities, scarcity of diagnostic facilities, and limited or irregular availability of first-line drugs.
As in previous years, we are including the Epidemiological Calendar for easy reference and use.
The Epidemiological Calendar includes the 365 days of the year, which are grouped in 52 weeks. Its use during surveillance activities is important because by standardizing the time variable, it provides a means to compare events that occur in a given year or during a specific period to others occurring at a later time or in other countries.
The 2002 Epidemiological Calendar begins on the last week of 2002. This is due to the fact that 1) the epidemiological weeks all start on Saturday, and 2) to determine the first epidemiological week of the year, we must choose the first Saturday in January that follows four or more days in January. Consequently, the first epidemiological week of 2003 starts on Sunday, 29 December 2002, and ends on Saturday, 4 January 2004.
Epidemiological Calendar
Source: “WHO Recommended Surveillance Standards, Second edition, October 1999”, WHO/CDS/CSR/ISR/99.2
Rationale for surveillance
Visceral leishmaniasis is endemic in over 60 countries. The incidence is estimated at 500,000 cases each year. It is the most severe form of leishmaniasis and it can be fatal in the absence of treatment. Deadly epidemics frequently occur in the anthroponotic foci of Bangladesh, India, Nepal, and Sudan, where man is believed to be the sole reservoir. Surveillance is essential in establishing disease impact and monitor efforts towards disease control and detecting epidemics.
Recommended case definition
Clinical description
An illness withprolonged irregular fever, splenomegaly and weight loss as its main symptoms.
Laboratory criteria for diagnosis
– positive parasitology (stained smears from bone marrow, spleen, liver, lymph node, blood, or culture of the organism from a biopsy or aspirated material)
– positive serology (IFA, ELISA).
Case classification
WHO operational definition:
A case of visceral leishmaniasis is a person showing clinical signs (mainly prolonged irregular fever, splenomegaly, and weight loss) with serological (at geographic area level) and/ or parasitological confirmation (when feasible at central lev-el) of the diagnosis. In endemic malarious areas, visceral leish-maniasis should be suspected when fever lasts for more than two weeks and no response has been achieved with anti-malaria drugs (assuming drug-resistant anti-malaria has also been considered).
Recommended types of surveillance
Routine monthly reporting of aggregated data from periph-ery to intermediate and central level.
Active case finding through surveys of selected groups or mass surveys (standardized and periodical) is an alternative to estimate the prevalence of visceral leishmaniasis.
International: annual reporting from central level to WHO (limited number of countries).
Recommended minimum data elements
Individual patient records at peripheral level:
Identification data: Unique identifier, age, sex, geographic information, travel history, duration of stay at current resi-dence.
Leishmaniasis data: Clinical features, date of diagnosis, sero-logical/parasitological diagnosis, Leishmania species, treat-ment outcome.
Aggregated data for reporting:
Number of cases by age, sex, type of diagnosis.
Recommended data analysis, presentation, reports
Tables:
Incidence by geographic area, age, sex, type of diagnosis, risk group, by clinical features, by month/year.
Point prevalence (if active case detection).
Principal uses of data for decision-making
– Evaluate the real extent of the problem and the main popu-lations at risk
– Improve and focus the control activities – Identify technical and operational difficulties – Evaluate impact of control interventions – Anticipate epidemics
Special aspects
Visceral leishmaniasis tends to be largely underreported be-cause most of the official data are obtained through passive case detection only. The number of people exposed to infec-tion or infected without any symptoms is much more impor-tant than the number of detected cases.