MORTALITY IN CHILDREN UNDER I5 YEARS OF AGE IN CALI, COLOMBIA l
Drs. Guillermo Llat~os,~ Jorge A. Escobar,3 and Edgar MuFioz’
By means of a sampling of deaths of children under 15, an attempt is made to evaluate the characteristics of medical certification and its effect on the analysis of causes of death in Cali, Colombia.
In+roduc#ion
Quantitative and qualitative data on the characteristics of the community to be served are of fundamental importance to the plan- ning of public health activities. In Colombia, as a result of the requirements enforced with respect to burials, quite complete infor- mation on the number of deaths is obtainable from death certificates. Their value is dimin- ished, however, not only by the inadequacy
of the data they contain but also by the sub- jective nature of many of them. It is not unusual for diseases regarded as having a social stigma (syphilis, tuberculosis, and even cancer) to be listed as something else, which confuses subsequent analysis of causes of death.
The recording of deaths by cause, sup- planting the old, less specific count of total deaths, which indicated only the general mortality rate, was a major victory for epidemiology. It contributed greatly to know-
ledge of the history of diseases, since it reveals trends in the mortality caused by each of them.
In Colombia, mortality statistics are the only index available for studying and demon- strating the extent of the changes brought about by community health programs and for
l Published in Spanish in BoleGn de la Oficina Sanitaria Panamericana Vol. LXIII, No. 4 (October 1967), pp. 289-298.
2 Chief, Epidemiology and Biostatistics Section,
Department of Preventive Medicine, UniversGy of
Valle, Cali, Colombia.
*Assistant Professor, Department of Pediatrics,
University of Valle.
4 Consultant in Medical Education, PAHO/WHO,
Zone I, Caracas, Venezuela.
setting priorities for these programs, since morbidity records are not adequately kept. But the statistical analysis of death certifi- cates can be no more accurate than the data on cause of death as determined by the physician, who is the person responsible for this part of the cert%cate. Cali was one of the cities included in the Inter-American Investigation of Mortality,5 which was con- ducted under the sponsorship of the Pan American Health Organization in 10 cities in Latin America, one in the United States, and one in England (I ) . Over a period of two years the investigators studied the deaths among persons from 15 to 74 years of age in urban Cali, and their preliminary conclu- sions mentioned the low quality of the dead certicates (2 ) .
This paper describes the efforts carried out to complete the picture of mortality in Cali and make possible a better determination of the reliability of the city’s vital statistics. The local physicians cooperated in this work.
Method of Work
The study took for its basic the death certificates of children under 15 years of age signed by Cali physicians during the period from 1 July 1964 to 30 June 1965. Every week the Municipal Statistical Office fur- nished copies of the forms used for issuing death certificates, which were divided, after those for nonresidents had been discarded,
6 PAHO Scienthic Publication 151, Patterns of Urban Mortality--Report of the Inter-American Investiga- tion of Mortality (1967).
46 BOLETiN DE LA OFICINA SANITARIA PANAMERICANA
into three groups: (1) children under 1 year; (2) children between 1 and 4 years; and (3) children from 5 to 14. From each of these groups a random sample of 25 per cent was selected.
A nurse trained in epidemiological work first visited the family of the deceased to collect information on the medical care re- ceived by the child during his last year and particularly during his last illness. She also appraised such data as the condition of the parents’ dwelling and their socioeconomic level and occupation, and verified their resi- dence, using as a criterion-independent of their length of stay in Cali-whether they intended to stay in the city or had come merely to seek medical treatment. In the case of children under 1 year questions were asked about prenatal care, attendance at confinement, complications of the mother during pregnancy, the weight, size, and con- dition of the newborn infant, and so on; the mother’s opinion about the causes of the child’s death was also solicited. As part of the epidemiology program, a resident physician from the Department of Preventive Medicine visited at the same time the doctor who had signed the certificate in order to reconstruct the clinical history. When the child had received care at a hospital or health center, the records were reviewed. If the certifying physician did not remember the patient, or if death had occurred without medical attendance, the residents visited the family to obtain better information on the course of the disease.
Periodically, the working group, which was composed of two of the authors (Llanos and Escobar), the resident physicians, the nurse, and a pathologist, reviewed the completed histories to discuss each one and determine the basic cause of death. When all agreed on one diagnosis, a single cause was assigned and given a value of three points; when, in the judgment of the group, there were two causes to which the death could be attributed, one more important than the
other, two points were assigned to the former and one to the latter; in the few cases in which there was not unanimous agreement, three causes were indicated and each was given one point. To tabulate according to this system of weighted values, the totals for each cause were added up and divided by three to obtain the weighted number of deaths due to that cause in the group. This is why fractions sometimes occur; they are merely the result of this artificial system.
Emphasis was laid on the child’s nutri- tional state, which was classified according to the weight standard used by Mexican authors (3). Subsequently the data were codified in accordance with the seventh revi- sion of the International Chsification of
Diseases (4) and processed on IBM equip- ment.
Resuk
Descriptive Data
During the period of the study there were 2,595 deaths in Cali of children under 15. Of these, the certificates for 615 (23.7 per cent) were reviewed; eight cases were later discarded for not meeting the requirements of the study (six because of nonresidency, one for proving on investigation to be older than 15, and another for being confirmed as a stillbirth).
Table 1 shows the distribution of the deaths studied by age and sex, and also the percentage represented by the sample in
TABLE l-Distribution of Deaths Studied, by Age and
Sex, and Percentage Represented by the Sample in Each Age Group, Cali, Colombia, 1965.
Under 1 month 108 1;: 170 23.2
l-l 1 months 138 262 25.2
1-4 years 78 71 149 22.0
S-14 years 17 9 26 17.4
Total 341 266 607
Llanos et al. - CHILD MORTALITY IN CALI. COLOMBIA 47
TABLE P-Infant Mortality Rates, Cali, Colombia, 1965.
Sex births Live
Male . _.
Female ::. :2”%
Both sexes 24:481
= Deaths per 1,000 live births.
5%:: mortality Infant 1 year rate n
1,013 81.9
755 62.3
1,768 72.2
each age group. It may be observed that the 5-to-14 group is the least represented, which should be borne in mind in examining the results. It is worth while to emphasize that almost three quarters of the total number of deaths (71.3 per cent) were of children under 1 year-a reflection of the high infant mortality in Colombia. From the birth records during the same period (5) the mortality rates in Table 2 were calculated. These two tables indicate that the risk of death is higher among male children than among girls, which remains true of the other age groups considered.
Table 3 shows the percentage of visits that could not be carried out, either because of incorrect address or because the family had moved, as is common in Colombia when a death occurs in a house. Owing to transpor- tation problems, it was difficult to visit the families of the dead children without delay. The high proportion of home visits not carried out accords with the high number of deaths for which the causes couId not be clarified and consequently a definitive diag- nosis could not be reached. An attempt was also made to evaluate the kind of medical
TABLE 3-Disfribution of Visits to Families of Children Who Died, by Age Groups, Cali, Colombia, 1965.
Age group
Home visit Yes No
% not visited
Under I month. 96
1z;’ 43.5
l-11 months 141 46.2
l-4 years _.__ 73
5-14 years.. ‘::. 18 76 8 51.0 30.8
Total 328 279 46.0
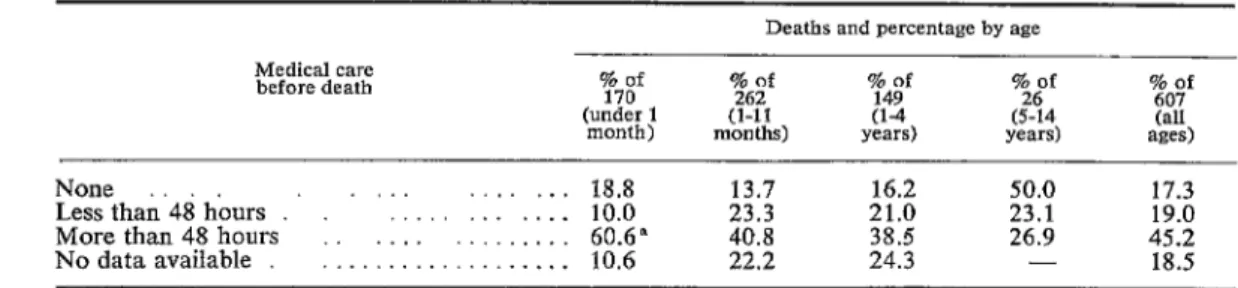
care received by the child during his last illness; the results are presented in Table 4. The table shows that 17.3 per cent of the children received no medical care; but if
those attended by a physician only in the last hours of their illness (19 per cent) are in- cluded, the figure jumps to 36.3 per cent.
It is important to note that the tendency to take a child at once for medical attention decreases as he grows, since the proportion of deaths without medical care or with care only in the last hours of illness reaches 73.1 per cent in the 5-to-14 age group.
Analysis of Causes
In analyzing the causes of death the system used to obtain the basic cause should be borne in mind. Table 5 summarizes the findings, which show that in the great ma- jority of cases (76.2 per cent) the investi- gators agreed on the assignment of a single cause. OnIy in eight cases (1.3 per cent) were three possibilities considered.
In only 22 of the deaths was there a
TABLE 4-Distribution of Child Deaths According to Medical Core Received during Last Illness, by Age, Cali, Colombia, 1965.
Medical care before death
Deaths and percentage by age
%’
(under 1 month)
76;’
% of149 Ttf 20;’
(l-11 (l-4 (5-14
months) years) years) SZes) (all
None
Lessthah’48hburs . . ‘I:... :I:‘.::: 18.8 10.0 23.3 13.7 21.0 16.2 50.0 23.1 17.3 19.0
More than 48 hours 60.6" 40.8 38.5 26.9 45.2
No data available . : : : : . : : : : : : : : : 10.6 22.2 24.3 - 18.5
48 BOLETiN DE LA OFICINA SANITARIA PANAMERICANA
TABLE S-Distribution of Deaths by Number of Diagnoses Assigned in the Investigation, Cali, Colombia, 1965.
No. of diagnoses
Deaths by ape
87.0 71.0 70.3 92.3 76.2
13.0 27.9 26.4 7.7 22.5
- 1.1 3.3 - 1.3
complete autopsy; in 64, medicolegal autop- and are in first place, whereas the investiga- sies, which are of very poor quality in Cali, tion placed them in second place, with only were carried out. Thus the majority of the 24 per cent, which is reflected also in the cases were discussed on the basis of their appendix under listing for “Gastroenteritis” clinical history, with very few laboratory in the various age groups. Another signifi- findings. Tables 6 and 7 present the causes cant finding is the slight importance attribu- of death grouped according to the Interna- ted by the physicians to nutritional diseases
tional Chsification. A mere look at these as a cause of death. According to the certifi- tables, which supplement the data in the cates only 6 of the deaths (1 per cent) were appendix, indicates the differences between from this cause; in the investigation, on the the information on the certificates (that is, other hand, almost 30 deaths (4.9 per cent) what the certifying physician declared) and were attributed to this cause. If to these are that uncovered in the study. It is notable that added the 36.6 deaths that, in accordance on the death certificates diseases of the diges- with the International Classification, are in- tive system amount to aImost 40 per cent cluded in “Certain diseases of early infancy”
TABLE 6-Causes of Death in Children under 15 Years of Age by Diagnoses Assigned on Death Certificate, According to the International Classification of Diseases, Cali, Colombia, 1965.
Order
Inter- national code
Grow of diagnoses
Age gmws Under l-11 1-4 1 month months YCiTS
A11
Per cell1 5-14 ages
YGXS
~___
1
2
3
4
2 7
! 10
11
12
13
IX xv
I
VIII
XTV
E-XVII VI
III
!I1
X
XIII
XVI
Diseases of the digestive sys-
tem . . . . . . . . . . . - 163 78 1 242
Certain diseases of early
infancy . . . . 123 9 -- 132
Infective and parasitic
diseases . . . . . . 10 27 20 6 63
Diseases of the respiratory
system 1
Congenital maIf&&&: : . 28 41 8 19 1 62
Accidents and poisonings. . . 1 - ; ii ;i
Diseases of the nervous system
and sense organs. 3 8 8 2 21
Nutritional diseases. . - -
Neoplasms - -
the’ c&&&+ ’ ’ 3” 1 5”
Diseases of
system . . . . . . . . 1 2 1 - 4
Diseases of the genito-urinary
system . . . . . - 2 1 - 3
Diseases of the bones and
organs of movement. - - 1 1 2
Symptoms and ill-defined
conditions . 3 2 1 - 6
All causes . . . . 170 262 149 26 607
39.9
21.7
10.4
10.2 6.3 3.8
3.4
0’::
0.6
0.5
0.3
Llanos et al. * CHILD MORTALITY IN CALL COLOMBIA 49
TABLE 7-Causes of Death in Children under 15 Years of Age by Diagnoses Assigned in the Investigation, According to the International Classification of Diseases, Cali, Colombia, 1965.
Order national Inter- code
Group of diagnoses
Age groups Under 1-11 l-4 1 month months years
Au Per Call 5-14 ages
Ye=
1 xv
2 IX
3 I
4 VIII
2 XIV III
Certain diseases of early
infancy . . . . .
Diseases of the digestive sys- tem . . . . Infective and parasitic
diseases . . . . . . Diseases of the respiratory
system . . . . . . . . . Congenital malformations. . Nutritional diseases. . . . . Accidents and poisonings. . . . . Diseases of the nervous system
and sense organs. Neoplasms
Diseases of. tie bones’ . and organs of movement. Diseases of the genito-urinary
system . . . .
Diseases of the circulatory system
Symptoms and ili-defined conditions
All causes. .
110.0
-
9.0
1.0 24.0 - -
4.0 -
- -
22.0 170.0
38.3
103.4
18.3
33.0
El l:o
6.0
-
0.3
56.3 261.9
- - 148.3
42.7 - 146.1
13.3 6.0 46.6
11.3 0.3 45.6
2%
lo:o
0.7 29.6 32.0
13.7 24.7
Ei ;:; 18 3 4:o
1.0 1.0 2.0
1.0 - 1.0
- - 0.3
30.0 - 108.3
148.9 26.0 606.8
24.5
24.1
7.7
7.5
i-z 4:1
17.8 100.0
under the heading “Nutritional maladjust- ment” (772) as a product of malnutrition, the total rises to 66.6 deaths, or 11 per cent. Malnutrition would thus be the third major cause of death.
This shows up even more clearly in the appendix, where the investigation shows nu- tritional maladjustment as the second most important cause of death in children from 1 to 11 months, with almost 14 per cent of the deaths, whereas on the certificates it does not appear at all. The same thing happens in the I-to-4-year group, in which malnutri- tion occupies fourth place (4 per cent) on
the certificates and second place (19.2 per cent) in the investigation.
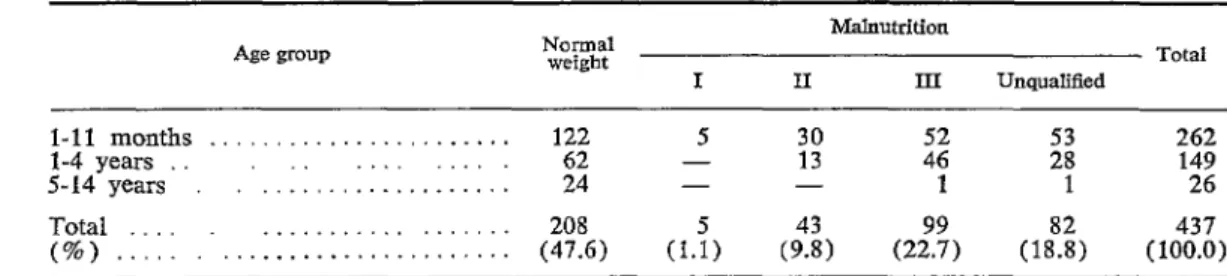
Table 8 shows the nutritional state of the children studied, classified according to the weight standard used by the Mexican au- thors. As can be seen, only 47.6 per cent of the children are of %ormal weight,” even though this column inchrdes all those on whom there was no information about nu- tritional state. That is, the 52.4 per cent of cases of malnutrition should be considered a minimum; the reaI number must be some- what higher. All stages of malnutrition were found primarily in the 1-to-11-month and
TABLE S-Distribution of Deaths of Children 1 Month to 14 Years of Age, by Nutritional State as Determined from Clinical History, Cali, Colombia, 1965.
Age group
Malnutrition
Total
I II III Unqualified
l-11 mcmths . _. _. _. . . . . 122 2 30 E 1; 262
l-4 years
.‘..::...::::..::::.: 62 13 149
S-14 years 24 - - 1 1 26
Total
50 BOLETiN DE LA OFICINA SANITARIA PANAMERICANA
the 1 -to-4-year groups, as had been expected, since at those ages the child is completely dependent and is growing rapidly, so that the lack of an adequate diet is quickly ap- parent in the form of malnutrition.
Commenfs
A knowledge of the causes of death in a community depends on the medical certifi- cation of death, since the subsequent stages of compilation, codification, and tabulation of data are performed adequately in most countries. The basic error of many inac- curate mortality statistics thus lies in that first stage; in turn, the lack of importance attributed to vital statistics is due to their poor quality, and unfortunately little is being done to improve them.
It is obvious that the physician often signs the death certificate just to get out of the situation and make his escape from the family. This explains the considerable di- ferences between the true cause of death and the one to which he has attested. More- over, it is only recently that our medical schools have begun to teach the true impor- tance of tabulating the causes of death; as
a result, physicians have not been interested in properly filling out the certificate.
One means of improving the statistics, perhaps the right one for promoting the proper certification of death, is to establish registration areas similar to those created in the United States at the beginning of this century, In this way, and with periodic studies like the one described, more would come to be known about mortality trends in the Latin American countries.
It may be that one reason for the poor representation of malnutrition among the causes of death is the “sole cause” system, which overlooks equally important contribut- ing causes. In addition, the physician, obses-
sed by gastroenteritis, finds no one to blame for the high infant mortality.
Acknowledgmenb
Thanks are expressed to Dr. Luis Eduardo Velez, who drew up the plan of operations
of the study; to Dr. Mercedes de Gaiter, of the Department of Pathology, for her advice; to Miss Ana Salazar, who conducted the home interviews; and to Drs. Francisco Villadiego, Vicente Jimenez, and Walter Torres, whose dedication and enthusiasm made possible the gathering of the medical information.
Summary
In 1964-1965, with a view to obtaining de- tailed knowledge of the problem of mortality in Cali, Colombia, a study was carried out on
the basis of a method similar to that of the
Inter-American Investigation of Mortality. A
sampling was taken of data on deaths among children under 15 years of age and all clinical, pathological, laboratory and other data were carefully investigated; a clearer idea of the causes of death was thus obtained. The findings of this investigation were compared with the data contained in death certificates (which pro- vide the basis for official statistics), and it was noted that, among the cases of death, nutri- tional diseases appeared more frequently in the study findings than in the certificates, whereas the exact opposite occurred in the case of diarrhea1 diseases.
It was concluded that the inaccuracies of mortality statistics are due, basically, to errors in medical certification. In most countries, the subsequent phases of compilation, codification, etc., are carried out satisfactorily. With a view to improving these statistics and obtaining bet- ter knowledge of mortality trends in the Latin American countries, it is recommended that medical schools continue to attribute to ade- quate certification and tabulation the im- portance that they deserve. It is also recom- mended that registration areas be established, similar to those created in the past in the United States, and, furthermore, that studies such as the present one be carried out periodically in order to evaluate progress achieved. D
REFERENCES
(I) Ruth Puffer et al. “Investigaci6n intemacional
colaborativa sobre mortalidad.” BoZ Ofic (2) Correa, P., G. Llanos, and “Estudio sobre Causas de Muerte en Cal?‘. B. Aguilera. Sanit Panamer 58:1-16, 1965. Antioquia Me’dica 14:359-365, 1964.
4. t
4
-7%
Llanos et al. - CHILD MORTALITY IN CALI, COLOMBIA 51
(3) Ramos Galvkn, R., and J. Cravioto. Creci-
miento y Desarrollo (Mexico, D.F.) 15 Diseases, Injrfries, and Causes of D.eath.
(6) : 1031-1043, 1958. F;;pth revrsron, 1957, Geneva, Swrtzer-
(4) World Health Organization. Manual of the
International Statistical Classification of (5) Municipal Statistica Office, Cali, Colombia.
Appendix
COMPARISON OF PRINCIPAL CAUSES OF DEATH IN CHILDREN UNDER 15 YEARS OF AGE, ACCORDING TO THE CERTIFICATES OF DEATH AND THE ASSIGNMENT MADE IN THE
INVESTIGATION, CALI, COLOMBIA, 1965
(Numbers in parentheses are those from the International Classificarion of Disemes, WHO,
seventh revision)
A. Under I month (total deaths: 170)
Death Certificate %
1. Postnatal asphyxia and atelectasis
(762) 21.8
2. Immaturity (774;‘776): : : 1. : : 1. : 14.7 3. Pneumonia (763)
4. Diarrhea of newborn (764) _. : : : : 11.8
8.2 5. Congenital malformations of heart
(754) 7.6
All other causes. 35.9
B. From 1 to II months (total deaths: 262)
Death Certificate %
1. Gastroenteritis (571, 572) 62.2
2. Bronchitis and bronchopneumonia (491, 500)
3. Tuberculosis (001~608). : : : : : : : 15.6
5.0
4. Purulent meningitis (057). . 3.0
5. Whooping cough (056). , 2.7
All other causes 11.5
C. From I ro 4 years (total deaths: 149)
Death Certificate %
1. Gastroenteritis (571, 572). . 52.3
2. Bronchitis and bronchopneumonia (491,
500) . 12.7
3. Tuberculosis (001-008) . . . . . . _ 6.0
4. Nutritional deficiency (280-286) 4.0
5. Meningitis (057) . 3.4
All other causes . 21.6
D. From 5 to 14 years (total deaths: 26)
Death Certificate %
1. Other and unspecified accidents (E-OlO-
E-915, E-920-E-928, etc.) . 26.9
2. Accidental drowning (E-929) . . . 19.2 3. Epilepsy (353) _. . . _, . . . . 7.7
All other causes . . . . . . _ 46.2
Investigation %
1. Immaturity (774, 776) 26.9
2. Postnatal asphyxia and atelectasis
(762) 11.9
3. Birth injury (760, 761). . 8.2
4. Pneumonia (763) 5.7
5. Diarrhea of newborn (764) 4.7
All other causes. . . 42.6
Investigation %
I. Gastroenteritis (571, 572) 39.1
2. Nutritional maladjustment (malnutri-
tion) (772) . .___... 13.8
3. Bronchitis and bronchopneumonia (491, 500) . . . . . . . ..__. __ 12.6
4. Whooping cough (056) 2.8
5. Purulent meningitis (057). 1 . 1. 2.3
All other causes. . 29.4
Investigation %
1. Gastroenteritis (571, 572) 28.6
2. Nutritional deficiency (280, 286) 19.2 3. Bronchitis and bronchopneumonia (491,
500) . . 7.6
4. Accidents in home (E-870, E-900, E-
904, E-917, E-918). 5.4
5. Whooping cough (056). . 3.4
All other causes 35.8
Investigation %
1. Motor vehicle traffic accidents (E-810- E-835)
2. Accidental drowning (E-929)
. 30.8 19.2
3. Epilepsy (353) _. 8.8
4. Tuberculosis (010) . . . . 7.7