Printed in Brazil - ©2006 Sociedade Brasileira de Química 0103 - 5053 $6.00+0.00
Article
*e-mail: [email protected]
New Phenoxyl Radical Complexes of Manganese, Gallium, Indium and Iron Based
on an H
2bbpen Ligand Derivative
Ademir dos Anjos,a Adailton J. Bortoluzzi,a Miguel S. B. Caro,a Rosely A. Peralta,a
Geraldo R. Friedermann,b Antonio S. Mangrichb and Ademir Neves*,a
a
LABINC, Departamento de Química, Universidade Federal de Santa Catarina, 88040-900 Florianópolis-SC, Brazil
b
LABEPR, Departamento de Química, Universidade Federal do Paraná, 81531-970 Curitiba-PR, Brazil
Reportamos aqui a síntese e caracterização do ligante hexadentado H2L (N,N’,N,N’ -bis[(2-hidroxi-3,5-di-terc-butilbenzil)(2-piridilmetil)]etilenodiamino), como derivado adicional do bem conhecido pré-ligante H2bbpen, e que contém dois grupos fenolatos e dois grupos piridínicos conectados à unidade etilenodiamina. Os grupos fenolatos no pré-ligante H2L estão adequadamente protegidos por grupos substituintes volumosos (terc-butil) nas posições orto- e para-, a partir dos quais complexos contendo radicais fenoxil estáveis podem ser obtidos. Assim, sintetizamos quatro novos complexos mononucleares com MnIII, GaIII, InIII e FeIII, que através de oxidação eletroquímica
produzem espécies fenoxil mono- ou di-oxidadas em solução. Estas espécies radicalares foram caracterizadas por espectroscopia UV-Vis e Ressonância Paramagnética Eletrônica e estudos eletroquímicos. Como esperado, no caso dos complexos de GaIII, InIII e FeIII, nenhum processo de
oxidação centrado no metal foi observado. Entretanto, o complexo de manganês sofre processos de oxidação centrados tanto no metal quanto no ligante e conseqüentemente um complexo MnIV–
radical fenoxil pode ser gerado em solução. As estruturas dos complexos [MnIII(L)]+ e [GaIII(L)]+
foram determinadas por análises de cristalografia de raios X, revelando complexos monocatiônicos com geometrias octaédricas distorcidas.
Reported herein are the synthesis and characterization of the hexadentate H2L pro-ligand (N,N’,N,N’-bis[(2-hydroxy-3,5-di-tert-butylbenzyl)(2-pyridylmethyl)]ethylenediamine), as a further derivative of the well known pro-ligand H2bbpen which contains two phenolate and two pyridyl pendant arms. The phenolate groups in H2L are suitably protected by bulky substituents (tert-butyl) in the ortho- and para- positions, from which stable phenoxyl radical complexes can be formed. Thus, we have synthesized four new mononuclear complexes with MnIII, GaIII,
InIII and FeIII which through electrochemical oxidation generate one- and two-electron oxidized
phenoxyl species in solution. These radical species were characterized by UV-Vis, Electronic Paramagnetic Resonance and electrochemical studies. As expected, in the case of the GaIII, InIII
and FeIII complexes no metal-centered oxidation was observed. However, the manganese complex
undergoes metal- and ligand-centered oxidation processes and therefore a phenoxyl radical-MnIV complex can be generated in solution. The crystal structures of the [MnIII(L)]+ and [GaIII(L)]+
complexes were determined by X-ray crystallographic analyses revealing monocationic complexes with distorted octahedral geometries.
Keywords: H2bbpen, trivalent complexes, phenoxyl radical, crystal structures
Introduction
Extensive efforts have been made to provide valuable insight into the general aspects of the structures, physicochemical properties, and functions
of phenoxyl radical complexes with a series of transition-metal ions.1-5 In an attempt to understand the
spectroscopic properties, redox features, stability and chemical reactivity of phenoxyl radicals a series of
recent model studies using MIII-phenoxyl radical
Ligands based on the salen [N,N’-alkyl-bis
(-salicylimine)] frame have been the most extensively studied, since they are known to be of general utility in transition metal chemistry.2 In particular, complexes
which have many applications have been prepared utilizing substituted and unsubstituted H2bbpen pro-ligands (H2bbpen={N,N’,N,N’
-bis[(2-hydroxybenzyl)(2-pyridylmethyl)]ethylenediamine}).11-16 Manganese11,12
and vanadium13-15 complexes with bbpen2– have been
reported as interesting structural models for manganese and vanadium-containing metalloenzymes while those of gallium and indium have been reported as being of interest in nuclear medicine applications.16
In this paper we present the new H2bbpen derivative pro-ligand H2L, which contains two phenolate pendant arms with bulky substituents (tert-butyl) in the ortho- and para- positions, which enable it to produce stable phenoxyl
radical complexes. The mononuclear cation complexes (schematic representation shown in chart 1) [MIII(L)]+ (M
= Mn, Ga, In and Fe), were easily obtained through stoichiometric reactions of H2L and the hydrated metal salts of Mn, Ga, In and Fe in methanolic solutions. Electrochemical oxidation of the [MIII(L)]+ complexes
generates one- and two-electron oxidized phenoxyl species in solution which were characterized by UV-Vis, EPR and electrochemical studies. The crystal structures of the [MnIII(L)]+ and [GaIII(L)]+ complexes were determined by
X-ray crystallographic analysis revealing monocationic complexes with distorted octahedral geometries.
Experimental
Abbreviations
H2bbpen: {N,N’,N,N’
-bis[(2-hydroxylbenzyl)(2-pyridylmethyl)] ethylenediamine}; H2L: {N,N’,N,N’
-bis[(2-hydroxy-3,5-di-t-butylbenzyl)(2-pyridylmethyl)]
ethylenediamine}; [TBA][PF6]: tetra-n-butylammonium hexafluorophosphate; SWV: square wave voltammetry; CV: cyclic voltammetry.
Materials
2-pyridinecarboxaldehyde, Mn(ClO4)2.6H2O,
Ga(NO3)3.H2O, In(NO3)3.H2O, Fe(ClO4)3.9H2O and
tetra-n-butylammonium hexafluorophosphate [TBA][PF6] were
obtained from Aldrich Chemical Co. 3,5-di-tert
-butyl-2-hydroxybenzyl chloride was synthesized through the modification of a method described in the literature.17
Triethylamine (Et3N) and ethylenediamine were obtained from Merck. The reagents and solvents used in the syntheses were reagent grade and used without further purification. Spectroscopic grade solvents from Merck were dried on molecular sieves for physicochemical characterization of the complexes. High-purity argon was used to deoxygenate solutions.
Physical measurements
Elemental analyses were performed with a Perkin-Elmer 2400 instrument. IR spectra were measured in the range 4000-400 cm-1 with KBr pellets, using a Perkin-Elmer 781
spectrometer. The solution electrical conductivity was measured with a Digimed conductivity bridge, Type CD-21, with solute concentrations of ca. 10-3 mol dm-3. The NMR
spectra were obtained on a Bruker-FT 200 MHz (1H, 1H-1H
COSY) spectrometer in CD3CN (complexes 2 and 3), at 25
°C. Chemical shifts were referenced to tetramethylsilane (TMS). Electronic and spectroelectrochemical spectra of the complexes were recorded on a Perkin-Elmer Lambda-19 spectrophotometer and Varian Cary 50Bio. First derivative EPR spectroscopy of “powdered” and solution samples was carried out with a Bruker ESP 300E X-band spectrometer. Cyclic voltammetry, square-wave voltammetry and coulometry were carried out with a Princeton Applied Research (PARC) model 273 potentiostat/galvanostat in
dichloromethane solutions containing 0.1 mol dm-3
[TBA][PF6] as the supporting electrolyte (argon atmosphere, room temperature and -60 °C) in a conventional electro-chemical cell. Glassy carbon and platinum wire electrodes were used as the working and counter electrodes, respectively. Potentials were referenced to the Ag/Ag+ electrode
constructed in our laboratory. The Fc+/Fc couple (E° = 400
mV vs. NHE) was used as an internal standard18 to monitor
the reference electrode and was observed at +385 mV versus
Ag/Ag+.
Synthesis
H2L. This compound was prepared by the reaction between
ethylenediamine and 2-pyridinecarboxaldehyde followed by reduction with NaBH4 and addition of 3,5-di-tert
J. Braz. Chem. Soc.
2-hydroxybenzyl chloride as reported in the literature.19
mp 134-135 °C.19 1H NMR (200 MHz; solvent CDCl
3;
standard SiMe4) δ: 8.51 (2H6, d, 3J
H6/H5 4.6 Hz), 7.58 (2H4,
dd, 3J
H4/H5 7.6 Hz, 3JH4/H3 7.6 Hz), 7.26-7.19 (2H5, 2H3,
2H8, m), 6.83 (2H7, s), 3.76 (4H2, 4H2’, s), 2.88 (2H1, 2H1’, s), 1.38 (18H9, s), 1.25 (18H10, s); the phenolic protons were observed at 10.5 ppm. 13C NMR (200 MHz; solvent
CDCl3; standard SiMe4) δ: 157.4 (C4), 153.8 (C14), 149.0 (C8), 140.5 (C11), 136.4 (C6), 135.6 (C13), 123.8 (C5), 123.6 (C10), 122.9 (C7), 122.2 (C12), 121.2 (C9), 59.4 (C3), 59.0 (C2), 50.5 (C1), 34.8 (C15), 34.0 (C16), 31.6 (C17), 29.6 (C18).
Caution! the complex isolated as the perchlorate salt should be handled as a potentially explosive compound.
[MnIII(L)](ClO
4).1/2H2O (1). The reaction of Mn(ClO4)2.
6H2O (0.362 g, 1.0 mmol) with H2L (0.679 g, 1.0 mmol) in methanol afforded a purple microcrystalline precipitate which was filtered off, washed with cold methanol and ether, and dried under vacuum. Yield: 89%. Single violet crystals of the complex suitable for X-ray crystallography were obtained by recrystallization from an ethanol/acetone (1:1) solution of 1. Anal. Calc. for MnC44H61N4O6.5Cl (MW: 840.36
g mol-1): C, 62.89; H, 7.32; N, 6.67%. Found: C, 62.81; H,
7.52; N, 6.74%. IR (KBr) νmax/cm-1: ν (CH t-butyl) 2951vs;
ν(CO) 1243s; ν (ClO) 1093vs.
[GaIII(L)](ClO
4).CH3OH.2H2O (2). The pro-ligand H2L
(0.679 g, 1.0 mmol) reacts in methanol with Ga(NO3)3 (0.256 g, 1.0 mmol) and NaClO4 (0.122 g, 1.0 mmol) to form a stable white microcrystalline precipitate. The complex was filtered off, washed with cold methanol and dried under vacuum. Yield: 75%. Crystals suitable for X-ray crystallography were obtained by recrystallization
from a methanolic solution of 2. Anal. Calc. for
GaC44H62N4O7Cl (MW: 864.17 g mol-1): C, 61.15; H, 7.23;
N, 6.48%. Found: C, 61.30; H, 7.03; N, 6.57%. IR (KBr)
νmax/cm-1: ν (CH t-butyl) 2949vs; ν(CO) 1260s; ν (ClO)
1096vs.
[InIII(L)](ClO
4).H2O (3). The In(NO3)3.H2O (0.355 g, 1.0
mmol) reacts in methanol with H2L (0.679 g, 1.0 mmol) in the presence of NaClO4 (0.122 g, 1.0 mmol) to form a stable white microcrystalline complex which was filtered off, washed with cold methanol and dried under vacuum. Yield: 71%. Anal. Calc. for InC44H62N4O7Cl (MW:909.27g mol-1): C, 58.12; H, 6.87; N, 6.16%. Found: C, 58.72; H,
6.89; N, 6.10%. IR (KBr) νmax/cm-1: ν (CH t-butyl) 2953vs;
ν(CO) 1268s; ν (ClO) 1093vs.
[FeIII(L)](ClO
4).H2O (4). A mixture of Fe(ClO4)3.9H2O
(0.516 g, 1.0 mmol) and H2L (0.679 g, 1.0 mmol) in
methanol afforded a blue microcrystalline precipitate which was filtered off, washed with cold methanol and ether, and dried under vacuum. Yield: 85%. Anal. Calc. for FeC44H62N4O7Cl (MW: 850.30 g mol-1): C, 62.15; H,
7.35; N, 6.59%. Found: C, 61.75; H, 7.14; N, 6.51%. IR (KBr) νmax/cm-1: ν (CH t-butyl) 2953vs; ν(CO) 1268s; ν
(ClO) 1091vs.
Determination of the crystal structures of complexes 1
and 2
For both complexes, the intensity data were collected with an Enraf-Nonius CAD4 diffractometer, at room
temperature, with graphite-monochromated MoKα
radiation. Cell parameters were determined from 25 carefully centered reflections using a standard procedure.20
All data were corrected for Lorentz and polarization effects.21 An empirical absorption correction based on the
azimuthal scans of 7 appropriate reflections was also applied to the collected intensities with the PLATON program22 (T
min = 0.811; Tmax = 0.891). The structure was
solved by direct methods and refined by full-matrix
least-squares methods using SIR9723 and SHELXL9724
programs, respectively.
Complex 1. A dark green crystal was selected from the
crystalline sample of complex 1 under polarized light and fixed at the end of a glass fiber for X-ray analysis. Most of the non-hydrogen atoms were refined anisotropically, the exceptions being for some carbon atoms of tert-butyl
fragments and the oxygen atoms of the perchlorate couterions. H atoms attached to C atoms were placed at their idealized positions, with C-H distances and Ueq values
taken from the default settings of the refinement program. The H atoms of the water molecule of crystallization were not found on the Fourier difference map. One perchlorate group was found to be disordered. In the case of this perchlorate (Cl1) three oxygen atoms are disordered over two positions around the threefold axis of the tetrahedron. The site occupancies for the disordered atoms were refined and they are 0.56(1) and 0.44(1). A tert-butyl moiety was
also found to be disordered, where the terminal carbon atoms occupy two alternative positions with refined occupation factors of 0.52(2) and 0.48(2).
Complex 2. The crystals of this complex are sensitive to
atoms of the perchlorate counterion, which are disordered over two alternative positions with occupancy factors of 0.63(1) and 0.37(1). Hydrogen atoms of the alcohol group (methanol) and the water molecules were not found on the Fourier map. H atoms bonded to carbon atoms were included in the refinement list using the same method as in complex 1. Further relevant crystallographic data for
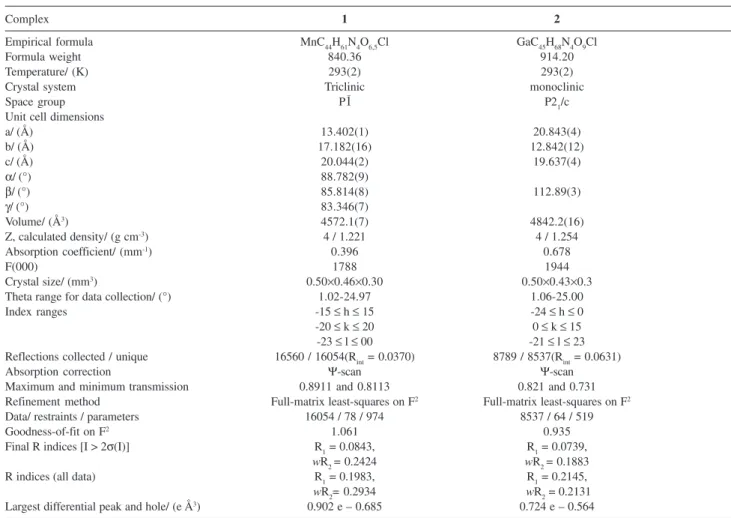
complexes 1 and 2 are summarized in Table 1.
Results and Discussion
Synthesis and physical characterization
The hexadentate H2L pro-ligand is derived from
alkyldiamines containing phenolate-type and α-pyridyl pendant arms. The characterization of H2L was
unam-biguously established by 1H NMR spectroscopy and
melting point techniques as reported in the literature.19
The H2L pro-ligand reacts in methanol with trivalent metals to form the stable cationic [MIII(L)]+ complexes.
These were isolated in high yields as the perchlorate salts. The complexes are soluble in a variety of organic solvents
(CH2Cl2, CH3CN, CH3OH, THF) and are exceedingly stable in these solvents. However, the complexes are insoluble in water. Molar conductivity measurements in CH3CN for all complexes showed values in the range 110-125 Ω-1 cm2 mol-1 (25 °C), indicating their 1:1 electrolyte
behavior.25 This is consistent with the stoichiometry
determined from elemental analysis.
Description of the crystal structures of complexes 1 and 2
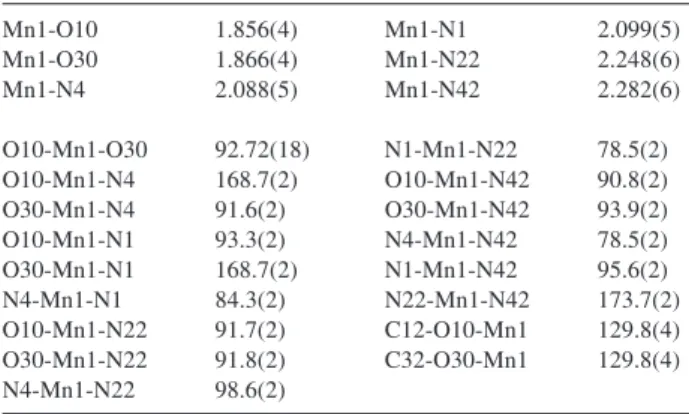
An ORTEP plot26 of complex 1 is shown in Figure 1
and selected bond lengths and angles are summarized in Table 2. The compound crystallizes in the space group P1–
with two molecules of the [MnIII(L)]+ cation, two
perchlorate counterions and one water molecule in the asymmetric unit. Considering the reduced formula [Mn(L)][ClO4].0.5H2O, the value of Z is 4 which is unusual for a triclinic crystal system.
In the structure of 1, the Mn3+ ion lies in a distorted
octahedral geometry, in which the two halves of the symmetrical ligand L2– are coordinated in a facial
arrangement (fac-N2O set): two phenolate oxygen and two
Table 1. Crystal data and structure refinement for complexes 1 and 2
Complex 1 2
Empirical formula MnC44H61N4O6,5Cl GaC45H68N4O9Cl
Formula weight 840.36 914.20
Temperature/ (K) 293(2) 293(2)
Crystal system Triclinic monoclinic
Space group P1– P21/c
Unit cell dimensions
a/ (Å) 13.402(1) 20.843(4)
b/ (Å) 17.182(16) 12.842(12)
c/ (Å) 20.044(2) 19.637(4)
α/ (°) 88.782(9)
β/ (°) 85.814(8) 112.89(3)
γ/ (°) 83.346(7)
Volume/ (Å3) 4572.1(7) 4842.2(16)
Z, calculated density/ (g cm-3) 4 / 1.221 4 / 1.254
Absorption coefficient/ (mm-1) 0.396 0.678
F(000) 1788 1944
Crystal size/ (mm3) 0.50×0.46×0.30 0.50×0.43×0.3
Theta range for data collection/ (°) 1.02-24.97 1.06-25.00
Index ranges -15 ≤ h ≤ 15 -24 ≤ h ≤ 0
-20 ≤ k ≤ 20 0 ≤ k ≤ 15 -23 ≤ l ≤ 00 -21 ≤ l ≤ 23 Reflections collected / unique 16560 / 16054(Rint = 0.0370) 8789 / 8537(Rint = 0.0631)
Absorption correction Ψ-scan Ψ-scan
Maximum and minimum transmission 0.8911 and 0.8113 0.821 and 0.731
Refinement method Full-matrix least-squares on F2 Full-matrix least-squares on F2
Data/ restraints / parameters 16054 / 78 / 974 8537 / 64 / 519
Goodness-of-fit on F2 1.061 0.935
Final R indices [I > 2σ(I)] R1 = 0.0843, R1 = 0.0739,
wR2 = 0.2424 wR2 = 0.1883
R indices (all data) R1 = 0.1983, R1 = 0.2145,
wR2= 0.2934 wR2 = 0.2131
J. Braz. Chem. Soc.
tertiary nitrogen atoms of ethylenediamine form the equatorial plane, with atoms of the same type in cis positions
with respect to each other, while two pyridine groups that are mutually trans, complete the coordination sphere of
the MnIII cation. As can be observed in Figure 1 the donor
atoms N1, N22 and O10 occupy one face of the octahedron while N4, N42 and O30 occupy the other face. The axial Mn-Npyridine bond distances of 2.248(6) and 2.282(6) Å in complex 1 are the longest of the coordination sphere and
this is consistent with a Jahn-Teller distortion of this high-spin Mn(III) (d4) ion. On the other hand, these bond
distances are somewhat longer than the corresponding Mn-Npyridine bond distances observed in the reported [MnIII(bbpen)]+ complex (2.237(5) and 2.252(5) Å)11 despite
the fact that the equatorial Mn-Namine bonds (av. 2.094(5) Å in 1 and 2.101(4) Å in [MnIII(bbpen)]+) and the equatorial
Mn-Ophenolate bonds (av. 1.861(4) Å in 1 and 1.867(4) Å in
[MnIII(bbpen)]+) are very similar. Furthermore, as described
for [MnIII(bbpen)]+, the MnIII-N
pyridine bond distances in 1
are significantly shorter (≈0.2 Å) than those found in other MnIII-N
pyridine complexes with Jahn-Teller distortion27-30 and
this structural feature can be explained in terms of the ring strain caused by the rigidity of the five-membered rings
formed with the pyridyl arms in the [MnIII(bbpen)]+11 and
the [MnIII(L)]+ complexes.
The Mn-Namine bonds are also somewhat longer than those for other known Mn(III) complexes31 containing only
MnIII-N
amine bonds in the equatorial plane, and this is a
consequence of the weak trans effect of the shorter MnIII
-Ophenolate bond distances. These bond distances are shorter than Mn-Ophenolate bond distances observed for structurally characterized manganeseIII compounds.28-30,32-34 The trans
angles at the MnIII center in 1 are in the range of
168.7(2)-173.7(2)° with the greatest distortion from linearity occurring at the O10-Mn-O4 and O30-Mn-N1 angles.
A perspective view of complex 2 is shown in Figure 2
and selected bond lengths and angles are summarized in Table 3. The gallium complex crystallizes in the monoclinic system, space group P21/c. The asymmetric
unit consists of a mononuclear [GaIII(L)]+ cation, one
methanol molecule and two water molecules as the crystallization solvent, and one uncoordinated perchlorate anion. As expected, the distorted octahedral geometry is very similar to the coordination geometry in complex 1
and also similar to that previously reported for the [GaIII(Clbbpen)]+ complex.16 In complex 2, the face of the
octahedron is again occupied by N1, N22 and O10 while the other face is occupied by N4, N42 and O30.
The identical Ga-Npyridine bond distances (2.105(5) Å) in complex 2 are similar to those found in the [GaIII(Clbbpen)]+
complex (2.121(2) and 2.107(2) Å), while the Ga-Ophenolate bond distances in complex 2 (1.854(4) and 1.859(4) Å) are
slightly shorter than those observed in [GaIII(Clbbpen)]+
(1.860(2) and 1.871(2) Å).16 Unlike the findings for complex 2, the [GaIII(Clbbpen)]+ complex shows a chloride atom in
the para- position relative to each of the phenol groups. A
significant difference is observed on comparing the Ga-Namine bond distances for the two the complexes: 2.155(5) / 2.160(5) Å in complex 2 and 2.158(2) / 2.180(2) Å in
[GaIII(Clbbpen)]+.
Figure 1. Ortep26 view of the [MnIII(L)]+ cation in 1, showing the atom labeling scheme. Displacement ellipsoids are shown at the 50% proba-bility level.
Table 2. Selected bond lengths (Å) and angles (°) for complex 1
Mn1-O10 1.856(4) Mn1-N1 2.099(5)
Mn1-O30 1.866(4) Mn1-N22 2.248(6)
Mn1-N4 2.088(5) Mn1-N42 2.282(6)
O10-Mn1-O30 92.72(18) N1-Mn1-N22 78.5(2) O10-Mn1-N4 168.7(2) O10-Mn1-N42 90.8(2)
O30-Mn1-N4 91.6(2) O30-Mn1-N42 93.9(2)
O10-Mn1-N1 93.3(2) N4-Mn1-N42 78.5(2)
O30-Mn1-N1 168.7(2) N1-Mn1-N42 95.6(2)
N4-Mn1-N1 84.3(2) N22-Mn1-N42 173.7(2)
O10-Mn1-N22 91.7(2) C12-O10-Mn1 129.8(4) O30-Mn1-N22 91.8(2) C32-O30-Mn1 129.8(4) N4-Mn1-N22 98.6(2)
Table 3. Selected bond lengths (Å) and angles (°) for complex 2
Ga1-O10 1.854(4) Ga1-N42 2.105(5)
Ga1-O30 1.859(4) Ga1-N4 2.155(5)
Ga1-N22 2.105(5) Ga1-N1 2.160(5)
In complex 2 the trans angles involving N42-Ga-N22,
O30-Ga-N1 and O10-Ga-N4 averaged 168.2(18)°, whereas the cis angles involving Npyridine-Ga-Namine and Npyridine
-Ga-Ophenolate averaged 85.48(18)°, providing a minimally distorted octahedral geometry around the central metallic core. Angles and distances for the atoms are relatively similar to those reported for the galliumIII complexes.35-42
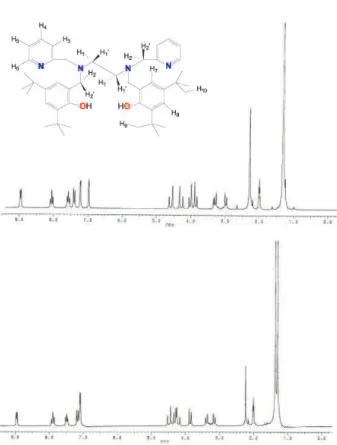
1H NMR spectra of complexes 2 and 3
1H NMR spectra for complexes 2 and 3 are shown in
Figure S1 (see Supplementary Information). The attribution of the signals was carried out with the help of tabulated data reported in the literature.43 The
bidimen-sional COSY technique was used to verify the couplings between protons. 1H chemical shifts, assignments and
multiplicity for complexes 2 and 3 can be seen in Table
S1 in the supplementary information. The 1H and 13C NMR spectra of the H
2L pro-ligand
have been reported in the literature19. The NMR spectra
of the metal complexes 2 and 3 showed a differentiation
of almost all the hydrogen atoms because they are in different chemical environments due to the rigid structure in which the ligand lies when it is coordinated to the metal center.
The 1H NMR spectra of the metal complexes 2 and 3
(Figure S1) were recorded in CD3CN and were very similar to each other with the exception of the region corres-ponding to the methylene hydrogen atoms (H2, H2’). In these spectra, two sets of resonance signals were observed; one for the pyridyl groups (δ8.95-7.22) and the other for the hydroxybenzyl groups (δ7.16-6.97).
The singlet at δ3.76 in the spectrum of the H2L pro-ligand is split into four doublets in the spectra of both complexes, attributed to the eight non equivalent methylene hydrogen atoms (H2,H2’). In complex 2 these
signals appeared at δ4.57 and δ4.27 (2H2py,H2’py) and at
δ4.02 and δ3.85 (2H2ph,H2’ph), whereas in complex 3 they
appeared at δ4.47 and δ4.20 (2H2py,H2’py) and at δ4.31 and δ 3.85 (2H2ph,H2’ph).
The two doublets at δ3.27 and δ2.96 correspond to the methylene hydrogen atoms of the ethylenediamine backbone (H1,H1’), which also became nonequivalent upon complexation in complex 2. In complex 3 these signals
appeared at δ3.35 and δ3.15. The four tert-butyl groups
appeared as a single signal at δ1.24 in complex 2 and as
two signals in complex 3 (δ1.36 and δ1.29).
In the 1H NMR spectrum of complex 2 the chemical
shifts of the solvent residual peak (CD3CN) and the water peak were determined at δ1.99 and δ2.22, respectively.44
In the spectrum of complex 3 these signals appeared at
δ2.00 and δ2.19, respectively.
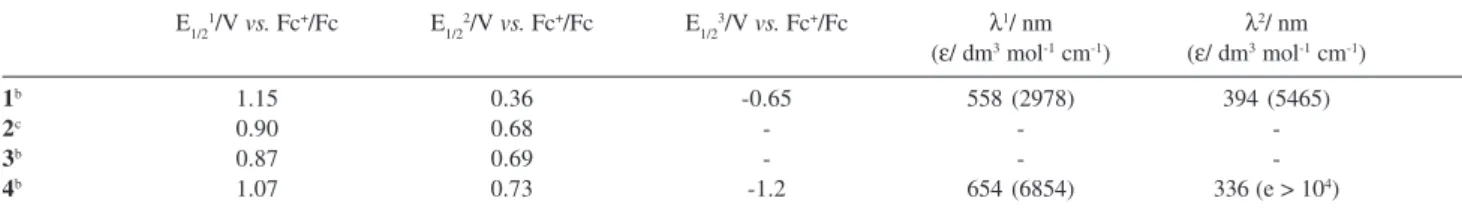
Electrochemistry
The electrochemical data are summarized in Table 4. The square wave voltammogram of complex 1 in CH2Cl2
at 298 K (Figure 3) displays three reversible oxidation processes at 1.15, 0.36 and -0.65 V vs. Fc+/Fc. The cathodic
process corresponds to the MnII/MnIII couple, and the
anodic process at 1.15 V can be attributed to the reversible formation of two-coordinated phenoxyl radicals. Interestingly, the redox potential at 0.36 V can be attributed either to the MnIII/MnIV or phenolate/phenoxyl couples.
Spectroelectrochemical and coulometric studies (vide-infra), under the same experimental conditions as those employed in the square wave voltammetry, revealed that in fact the two processes occur simultaneously with the [MnIV(L•)]3+ trication being generated in CH
2Cl2 solution.
The only similar species are those reported by Wieghardt and co-workers6-8 in which MnIV complexes showed
coordinated phenoxyl radicals. Recently, Chaudhuri and Figure 2. A perspective view26 of the [GaIII(L)]+ cation in 2, showing the
atom labeling scheme. Displacement ellipsoids are shown at the 50% probability level.
Figure 3. Square wave voltammogram of complex 1 in CH2Cl2 (0.1 mol
dm-3 [(TBA)PF
J. Braz. Chem. Soc.
co-workers7 reported MnIV-radical complexes which are
able to catalyze the oxidation of 3,5-di-tert-butylcatechol
in the presence of molecular oxygen as the sole oxidant to afford 3,5-di-tert-butylquinone, quantitatively.
In complex 1,the redox couple MnIII/MnII is shifted
by 300 mV to more negative potentials in relation to the [MnIII(bbpen)]+ complex11 as a consequence of the electron
donating effect of the tert-butyl groups in the
p-position of the phenol in the ligand.
Complexes 2 and 3 contain redox-inactive GaIII and
InIII ions, respectively. Therefore, all redox activity
observed must be ligand-centered. The two one-electron oxidations (Table 4) of 2 (see inset in Figure 3) and 3 (see
inset in Figure S2, Supplementary Information) are assigned to the successive formation of one- and two-coordinated phenoxyl radicals, in good agreement with results reported in the literature.1,6,9 It is important to note
that the anodic E1/2 values for the GaIII and InIII complexes
are comparable to the redox potential observed for the generation of the trication [MnIV(L•)]3+ and are thus in
full agreement with this assignment. On the other hand, on the timescale of a coulometric experiment at ambient temperature only the dication [Ga(L•)]2+ is stable. Thus,
oxidation of complex 2 by one electron equivalent at a
constant potential of 0.75 V vs. Fc+/Fc produces a
yellow-green solution of the respective dication. The trication [M(L••)]3+ is unstable under these conditions.
In the potential range +1.8 to –1.0 V vs. Fc+/Fc, the
CVs and square-wave voltammogram of complex 4
(Figure S2) reveal three reversible one-electron transfer processes. The cathodic process at –1.2 V vs. Fc+/Fc is
assigned to a metal-centered reduction of FeIII to FeII,
whereas the two oxidation waves (0.73 and 1.07 V vs.
Fc+/Fc) are ligand-centered successive phenoxyl radical
formation processes. These results suggest that no formation of FeIV species occurs. The reduction potential
in complex 4 is 0.4 V cathodic shifted when compared to
that reported for the [FeIII(bbpen)]+ complex (–0.82 V vs.
Fc+/Fc) which is also derived from the ethylenediamine
backbone containing phenol and pyridyl pendant arms.45
However, in this complex no substituents are found in the
ortho- and para- positions of the phenol groups. Moreover,
from an overall view of these results one can conclude that the electron-donor tert-butyl substituents in the ortho
-and para- positions of the phenol groups significantly
enhance the basicity of the oxygen atoms in H2L. Since the redox potentials E1/2 for complexes 2-4 are
very similar, we conclude that the redox chemistry is ligand-based. Thus, the scheme shown below summarizes the phenoxyl radical species generated from the complexes via one-electron oxidation reactions.
where: M = GaIII, InIII or FeIII; one (•) or two (••) dots
indicate the presence of one or two phenoxyl radicals.
In previous studies on tris(phenolate)-metal complexes (M = Ga, Co, Fe), Wieghardt and co-workers6,10 established
that the redox potentials for the [MLc·]+/[MLc] couples
vary from 0.35 V vs. Fc+/Fc for the gallium complex to
0.38 V vs. Fc+/Fc for the iron complex. It has been shown
that these values correlate with the π-donor bond strength of the M-Ophenolate bond which is relatively strong in GaIII
(d0), and even stronger in high-spin FeIII (d5) complexes.
The same trend for the redox potentials was found in the study reported here, i.e., E1/2 is lower for complexes 2 and 3 than for complexes 1 and 4.
Electronic spectra and spectroelectrochemistry
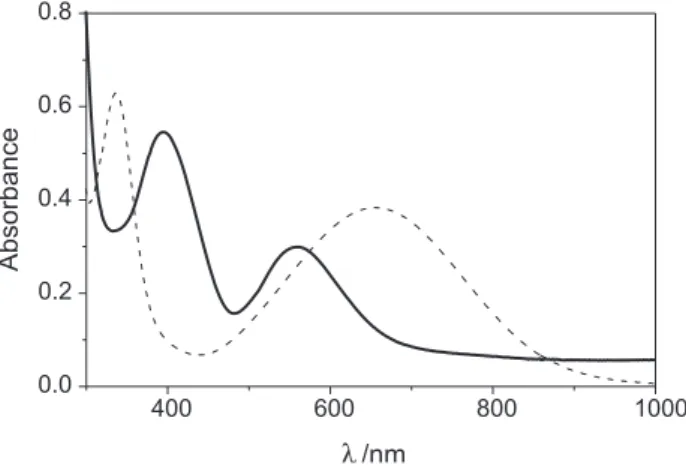
The electronic spectra of complexes 1 and 4 measured
in CH2Cl2 are shown in Figure 4 and the data are summarized in Table 4.
Complex 1 (Figure 4) shows a large band at λmax 558 nm (ε 2978 dm3 mol-1 cm-1), attributed to the
phenolate-to-MnIII charge transfer transition (LMCT) from the π p orbital
on the phenolate oxygen to the half-filled MnIII d
π* orbital.
The electronic spectrum displays an additional band at λmax
394 nm (ε 5465 dm3 mol-1 cm-1), which is also assigned to
a LMCT process, but originated from the pπ orbital to the dσ* orbital transition. The stronger interaction in 1 (due to
Table 4. Redox potentialsa and electronic spectraldata for the complexes
E1/21/V vs. Fc+/Fc E
1/22/V vs. Fc+/Fc E1/23/V vs. Fc+/Fc λ1/ nm λ2/ nm (ε/ dm3 mol-1 cm-1) (ε/ dm3 mol-1 cm-1)
1b 1.15 0.36 -0.65 558 (2978) 394 (5465)
2c 0.90 0.68 - -
-3b 0.87 0.69 - -
-4b 1.07 0.73 -1.2 654 (6854) 336 (e > 104)
aConditions: [complex] = 10-3 – 10-4 mol dm-3 in CH
2Cl2 (0.1 mol dm-3 [(TBA)PF6]; glassy carbon working electrode; platinum wire counter electrode; Ag/Ag+ reference electrode; T = 298 K. The Fc+/Fc couple (E° = 400 mV vs. NHE)18 was used as an internal standard (E
the shorter MnIII-O
phenolate bond distance) is consistent with
its lower energy phenolate-to-Mn(III) LMCT band at λmax
558 nm compared with other Mn(III) complexes described in the literature for which this lower energy band lies in the 350-480 nm range.28-30 A similar result was found for the
[MnIII(bbpen)]+ complex (λ
max 506 nm).11 However, the
presence of electron-donating groups (tert-butyl) contributes
to a greater bathochromic shift in the band of complex 1.
The pπdσ* charge-transfer band is also shifted to lower energy in 1.
Figure 5 shows the spectral change in the 350-850 nm range during the oxidation of [MnIII(L)]+ to the [MnIV(L•)]3+
species in a spectroelectrochemical experiment. The electronic spectrum of the electrochemically generated radical-manganese(IV) species shows two intense bands (ε > 103 dm3 mol-1 cm-1) at λ
max 538 nm and λmax 970 nm.
These values are significantly higher when compared to those observed for the [MnIV(bbpen)]+ complex (λ
max 506
and 790 nm).11 Data for the Nernst plot shown in the inset
of Figure 5 were obtained by recording the absorbance of the 538 nm band after equilibrium was established following selected potential steps. The E°´ = 0.37 V vs.
Fc+/Fc and n = 2.23 electron values obtained from this
plot are in good agreement with the square wave and coulometric results. From these results we propose that both, the MnIII to MnIV and the ligand-centered oxidation
(phenolate to phenoxyl) processes occur simultaneously with similar redox potentials and formation of a MnIV
-phenoxyl radical species in CH2Cl2.
Coulometry and spectroelectrochemical measurements for the reduction of complex 1 confirm the results obtained
from the square wave voltammetric studies, indicating that this is also a one-electron transfer process (n = 0.90 ± 0.1
electron), possibly involving the MnII complex (E°´ =
-0.64 ± 0.05 V vs. Fc+/Fc). However, the reduced pale red
solution undergoes decomposition in a few minutes.
The UV-Vis spectrum of complex 4 (Figure 4) is dominated
by intense absorption bands at 654 nm (ε > 5864 dm3 mol-1
cm-1) and 336 nm (ε > 104 dm3 mol-1 cm-1) which may be
assigned to phenolate-FeIII charge transfer transitions from p p
orbitals to dπ* and dσ* orbitals, respectively. These low energy transitions when compared with the [FeIII(bbpen)]+ complex45
confirm the significant effect of the electron-donor tert-butyl
substituents. The monooxidized radical displays the typical intense phenoxyl radical bands at 390, 410 and 680 nm, in good agreement with results reported in the literature.1,6 In the
spectroelectrochemical study (reduction process), the application of potential near the E½ value (–1.2 V vs. Fc+/Fc)
is followed by the disappearance of the phenolate-FeIII charge
transfer transitions and the appearance of a new band around 530 nm (E° = -1.09 ± 0.06 V vs. Fc+/Fc and n = 0.85 ± 0.1
electron from the Nernst plot). The latter may be assigned to a FeII-pyridine charge transfer transition.
Complexes 2 and 3 are colorless in CH2Cl2, however,
monooxidized forms of these complexes are yellow. The spectrum for the [Ga(L•)]2+ complex (Figure 6), generated
electrochemically at controlled potentials, displays three bands in the UV-Vis region: 390 and 408 nm (ε > 103 dm3
mol-1 cm-1) and a transition at 600-900 nm of much lower
intensity (ε < 103 dm3 mol-1 cm-1). Similar spectra for many
other phenoxyl radicals have been reported.1,6,9
EPR spectroscopy
The EPR spectra of complexes 1, 2 and 3 show no
signal, since manganeseIII, galliumIII and indiumIII ions are
EPR silent.
The X-band EPR spectrum (Figure 7a) of the electrochemically generated [MnIV(L•)]3+ species (1 minute
of electrolysis process) exhibits a signal at g ≈ 2.0 (six lines Figure 4. Electronic spectra in CH2Cl2 of complexes: 1 (solid line, 1.0 x
10-4 mol dm-3) and 4 (dashed line, 5.0 x 10⁻⁵ mol dm-3). Figure 5. Spectral changes during spectropotentiostatic experiments with complex 1 in CH2Cl2 (0.1 mol dm-3 [(TBA)PF
J. Braz. Chem. Soc.
with ΔH ≈ 100 G) at 298 K, typical of a MnIV ion.
Interestingly, in the same spectrum an isotropic signal at g≈
2.005 (ΔH ≈ 9.0 G) is clearly observed, which is typical of a phenoxyl radical. Thus, the EPR spectrum indicates the
formation of an unusual MnIV-phenoxyl radical
species in solution, in very good agreement with the electrochemical and spectroelectrochemical studies. In fact, observation of both of the individual processes (radical + MnIV) is possible at the beginning of the experiment indicating
that the spins are most probably not coupled. However, after a short time (~ one minute), these signals disappear and the formation of an isotropic signal centered at g ≈ 2.06 (Figure 7b) becomes prominent. These results clearly indicate that the [MnIV(L•)]3+ species is unstable under these experimental
conditions and that a decomposition process, most probably with breaking of the H2L pro-ligand, is taking place. Alternatively, it is reasonable to attribute the signal at g =
2.005 to an uncoordinated phenoxyl radical since this EPR signal seems too narrow for a phenoxyl coordinated to a paramagnetic ion.
The X-band EPR spectra of [Ga(L•)]2+ (Figure 8) and
[In(L•)]2+ (see inset in Figure 8) in CH
2Cl2, generated
electrochemically from complexes 2 and 3, respectively,
were recorded at 298 K. Both species exhibit typical S = ½ signals (g = 2.0049, ΔH = 9.5 Gauss) without hyperfine structure, which correspond to the phenoxyl radical.1,6,9The
EPR spectrum simulated for [Ga(L•)]2+46 is also shown in
Figure 8.
The X-band EPR spectrum of complex 4 (see Figure
S3 at Suplementary Information) recorded in frozen CH2Cl2 solution displays a broad intense signal at g≈ 4.3. This well resolved signal is typical of rhombically distorted, high-spin monomeric iron(III) complexes (S = 5/2). In the coulometric experiment at room temperature, no apparent
change was observed concerning the EPR spectrum of complex 4. For [Fe(L•)]2+ a S = 2 ground state is expected,6
but this has not yet been proven experimentally. Figure 6. Electronic spectrum of the electrochemically generated
phenoxyl radical complex [2·]2+ in CH
2Cl2 (0.1 mol dm-3 [(TBA)PF6]) at 298 K.
Figure 7. X-band EPR spectra of the electrochemically generated [MnIV(L–)]3+ species in CH
2Cl2 (0.1 mol dm-3 [(TBA)PF6]) at 298 K: (a) beginning of the electrolysis process (1 minute), (b) after 2 minutes of electrolysis.
Figure 8. X-band EPR spectrum of [2·]2+: experimental spectrum (⋅⋅⋅) and
simulated spectrum46 (—). Conditions: CH
2Cl2 (0.1 mol dm-3 [(TBA)PF6]) at 298 K. Inset: spectrum of [3·]2+ under the same experimental
The trication [MIII(L••)]3+ species for all complexes are
unstable under the conditions employed in our experiments (298 K). This was also confirmed through the coulometric experiments.
Conclusions
In this study, LMIII complexes (M = Mn, Ga, In, Fe)
based on a derivative of the well-known pro-ligand H2bbpen ({N,N’,N,N’-Bis[(2-hydroxybenzyl)
(2-pyridyl-methyl)]ethylenediamine}) were synthesized. All of the available electrochemical and spectroscopic data suggest that the oxidized forms of the complexes contain coordinated phenoxyl radicals. In no instance has a metal-centered oxidation been observed. The results for the manganese complex differed from those for the other complexes, the oxidized species clearly containing a manganese(IV) ion. This manganese complex undergoes metal- and ligand-centered redox processes, which were elucidated by spectroelectrochemistry and EPR
spectroscopy: a phenoxyl radical-MnIV complex is
accessible. These MIII-phenoxyl complexes represent
additional models for establishing some structural properties, along with the stability and reactivity, of relevant phenoxyl radical species. Further structural and physicochemical studies, involving the synthesis of mononuclear MIII = Ga, In, Fe, Mn complexes with suitable
pentadentate ligands derived from N-methyl-1,3-propanediamine (a labile coordination site for the interaction with alcohol-substrates should be available), are currently underway and will be the subject of future reports.
Acknowledgments
This research was supported by grants from CNPq, PRONEX and FINEP.
Supplementary Information
The 1H NMR spectra of compounds 2 and 3, the
square-wave voltammogram and the X-band EPR spectrum of
complex 4 are available free of charge at http://
jbcs.sbq.org.br, as a PDF file.
The crystallographic data (atomic coordinates and equivalent isotropic displacement parameters, calculated hydrogen atom parameters, anisotropic thermal parameters and bond lengths and angles) have been deposited at the Cambridge Crystallographic Data Centre (deposition numbers CCDC 297919 and CCDC 297920). Copies of this information may be obtained free of charge from:
CCDC, 12 Union Road, Cambridge, CB2 1EZ, UK (Fax: +44-1223-336-033; e-mail: [email protected] or http://www.ccdc.cam.ac.uk).
References
1. Chaudhuri, P.; Wieghardt, K. In Progress in Inorganic Chemistry; Karlin, K. D., ed., John Wiley & Sons Inc.: New York, 2001, vol. 50, p. 151 and references therein.
2. Jazdzewski, B. A.; Tolman, W. B.; Coord. Chem. Rev. 2000,
200, 633 and references therein.
3. Itoh, S.; Taki, M.; Fukuzumi, S.; Coord. Chem. Rev. 2000, 198,
3 and references therein.
4. Whittaker, J.W.; Chem. Rev. 2003, 103, 2347 and references
therein.
5. Borman, C. D.; Saysell, C. G.; Sokolowski, A.; Twitchett, M. B.; Wright, C.; Sykes, A. G.; Coord .Chem. Rev. 1999, 192, 771 and references therein.
6. Adam, B.; Bill, E.; Bothe, E.; Goerdt, B.; Haselhorst, G.; Hildenbrand, K.; Sokolowski, A.; Steenken, S.; Weyhermüller, T.; Wieghardt, K.; Chem.-Eur. J. 1997, 3, 308.
7. Mukherjee, S.; Weyhermüller, T.; Bothe, E.; Wieghardt, K.; Chaudhuri, P.; Dalton Trans. 2004, 22, 3842.
8. Chun, H.; Chaudhuri, P.; Weyhermüller, T.; Wieghardt, K.; Inorg. Chem. 2002, 41, 790.
9. Müller, J.; Kikuchi, A.; Bill, E.; Weyhermüller, T.; Hildebrandt, P.; Moussa, L. O.; Wieghardt, K.; Inorg. Chim. Acta 2000, 297, 265.
10. Kimura, S.; Bill, E.; Bothe, E.; Weyhermüller, T.; Wieghardt, K.; J. Am. Chem. Soc. 2001, 123, 6025.
11. Neves, A.; Erthal, S. M. D.; Vencato, I.; Ceccato, A. S.; Mascarenhas, Y. P.; Nascimento, O. R.; Hörner, M.; Batista, A. A.; Inorg. Chem. 1992, 31, 4749.
12. Neves, A.; Vencato, I.; Erthal, S. M. D.; Inorg. Chim. Acta 1997,
262, 77.
13. Neves, A.; Ceccato, A. S.; Erthal, S. M. D.; Vencato, I.; Nuber, B.; Weiss, J.; Inorg. Chim. Acta 1991, 187, 119.
14. Neves, A.; Ceccato, A. S.; Vencato, I.; Mascarenhas, Y. P.; Erasmus-Buhr, C.; J. Chem. Soc., Chem. Commun. 1992, 652. 15. Neves, A.; Ceccato, A. S.; Erasmus-Buhr, C.; Gehring, S.; Haase, W.; Paulus, H.; Nascimento, O. R.; Batista, A. A.; J. Chem. Soc., Chem. Commun. 1993, 1782.
16. Wong, E.; Liu, S.; Rettig, S. J.; Orvig, C.; Inorg. Chem. 1995, 34, 3057.
17. Sokolowski, A.; Müller, J.; Weyhermüller, T.; Schnepf, R.; Hildebrandt, P.; Hildenbrand, K.; Bothe, E.; Wieghardt, K.; J. Am. Chem. Soc. 1997, 119, 8889.
18. Gagné, R.R.; Koval, C.A.; Lisensky, G.C.; Inorg. Chem. 1980,
19, 2854.
J. Braz. Chem. Soc.
Chim. Acta 2005, 358, 3106.
20. Enraf-Nonius; CAD-4 EXPRESS Version 5.1/1.2, Enraf-Nonius: Delft, The Netherlands, 1994.
21. Spek, A.L.; HELENA; CAD-4 Data Reduction Program, Univ. of Utrecht: Netherlands, 1996.
22. Spek, A. L.; PLATON Molecular Geometry and Plotting Program, Univ. of Utrecht: Netherlands, 1997; North, A. C. T.; Phillips, D. C.; Mathews, F. S.; Acta Crystallogr. 1968, A24,
351.
23. Altomare, A.; Burla, M.C.; Camalli, M.; Cascarano, G.; Giacovazzo, C.; Guagliardi, A.; Moliterni, A.G.G.; Polidori, G.; Spagna, R.; J. Appl. Cryst. 1999, 32, 115.
24. Sheldrick, G.M.; SHELXL-97 Program for Crystal Structure Refinement; Univ. of Göttingen: Germany, 1997.
25. Geary, W. J.; Coord. Chem. Rev. 1971, 7, 81. 26. Farrugia, L. J.; J. Appl. Crystallogr. 1997, 30, 565.
27. Streetz, B. R.; Day, R. O.; Marianelli, R. S.; Day, V. W.; Inorg. Chem. 1979, 18, 1847.
28. Bertoncello, K.; Fallon, G. D.; Murray, K.; Inorg. Chim. Acta
1990, 174, 57.
29. Oki, A. R.; Hodgson, D. J.; Inorg. Chim. Acta 1990, 170, 65. 30. Li, X.; Pecoraro, V. L.; Inorg. Chem. 1989, 28, 3403.
31. Bhula, R.; Collier, S.; Robinson, W. T.; Weatherburn, D. C.; Inorg. Chem. 1990, 29, 4027.
32. Nakamura, T.; Niwa, K.; Usugi, S.; Asada, H.; Fujiwara, M.; Matsushita, T.; Polyhedron 2001, 20, 191.
33. Palenik, G. J.; Inorg. Chem. 1997, 36, 4888.
34. Bermejo, M. R.; Fondo, M.; Garcia-Deibe, A.; Rey, M.; San-Martin, J.; Sousa, A.; Watkinson, M.; McAuliffe, C. A.; Pritchard, R. G.; Polyhedron 1996, 15, 4185.
35. Liu, S.; Rettig, S. J.; Orvig, C.; Inorg. Chem. 1992, 31, 5400.
36. Liu, S.; Wong, E.; Karunaratne, V.; Rettig, S. J.; Orvig, C.; Inorg. Chem. 1993, 32, 1756.
37. Liu, S.; Wong, E.; Rettig, S. J.; Orvig, C.; Inorg. Chem. 1993, 32, 4268.
38. Wong, E.; Liu, S.; Lugger, T.; Hahn, F. E.; Orvig, C.; Inorg. Chem. 1995, 34, 93.
39. Kennard, C. H. L.; Inorg. Chim. Acta 1967, 2, 347.
40. Riley, P. E.; Pecoraro, V. L.; Carrano, C. J.; Raymond, K. N.; Inorg. Chem. 1983, 22, 3096.
41. Moore, D. A.; Fanwick, P. E.; Welch, M. J.; Inorg. Chem. 1989,
28, 1504.
42. Moore, D. A.; Fanwick, P. E.; Welch, M. J.; Inorg. Chem. 1990,
29, 672.
43. Herse, M.; Meier, H.; Zeeh, B.; Spektroskopische Methoden in der Organischen Chemie, 4nd ed., Thieme Inc.: Stuttgart, 1991. 44. Gottlieb, H. E.; Kotlyar, V.; Nudelman, A.; J. Org. Chem. 1997,
62, 7512.
45. Lanznaster, M.; Neves, A.; Bortoluzzi, A. J.; Assumpc, A. M. C.; Vencato, I.; Machado, S. P. Drechsel, S. M.; Inorg. Chem.
2006, 45, 1005.
46. Bruker EPR; WIN-EPR and SimFonia: Post-Processing Program and Simulation Software for PC-Windows or CD-ROM, version 1.0, 1997.
Received: June 13, 2006
0103 - 5053 $6.00+0.00
Supplementary Information
*e-mail: [email protected]
New Phenoxyl Radical Complexes of Manganese, Gallium, Indium and Iron Based
on an H
2bbpen Ligand Derivative
Ademir dos Anjos,a Adailton J. Bortoluzzi,a Miguel S. B. Caro,a Rosely A. Peralta,a
Geraldo R. Friedermann,b Antonio S. Mangrichb and Ademir Neves*,a
a
LABINC, Departamento de Química, Universidade Federal de Santa Catarina, 88040-900 Florianópolis-SC, Brazil
b
LABEPR, Departamento de Química, Universidade Federal do Paraná, 81531-970 Curitiba-PR, Brazil
Table S1.1H NMR chemical shifts (ppm), assignments and multiplicity for complex 2 and 3 in CD 3CN
Complex 2 Complex 3
Chem. Shift Mult. Assign. Chem. shift Mult. Assign.
8.95 d (3J
H6/H5 5.4 Hz) 2H6 8.94 d (3JH6/H5 5.2 Hz) 2H6
8.05 dd (3J
H4/H5 7.9 Hz, 3JH4/H3 7.9 Hz) 2H4 7.89 dd (3JH4/H5 7.8 Hz, 3JH4/H3 7.8 Hz) 2H4
7.56 dd (3J
H5/H6 6.3 Hz, 3JH5/H4 6.3 Hz) 2H5 7.48 dd (3JH5/H6 6.2 Hz, 3JH5/H4 6.2 Hz) 2H5
7.40 d (3J
H3/H4 7.9 Hz) 2H3 7.16 d (3JH3/H4 7.9 Hz) 2H3
7.22 d (4J
H8/H7 2.2 Hz) 2H8 7.10-7.07 m 2H8 2H7
6.97 d (4J
H7/H8 2.2 Hz) 2H7 4.47 d (2J 18 Hz) 2H2py
4.57 d (2J 19 Hz) 2H
2py 4.31 d (2J 12 Hz) 2H2ph
4.27 d (2J 19 Hz) 2H
2’py 4.20 d (2J 18 Hz) 2H2’py
4.02 d (2J 13 Hz) 2H
2ph 3.85 d (2J 12 Hz) 2H2’ph
3.85 d (2J 13 Hz) 2H
2’ph 3.35 d (2J 10.4 Hz) 2H1
3.27 d (2J 10 Hz) 2H
1 3.15 d (2J 10.4 Hz) 2H1’
2.96 d (2J 10 Hz) 2H
J. Braz. Chem. Soc.
Figure S1.1H NMR spectra of complex 2 (top) and complex 3 (bottom) in CD3CN. Inset: schematic representation for 1H NMR interpretation.
Figure S2. Square wave voltammogram of complex 4 in CH2Cl2 (0.1 mol dm-3 [(TBA)PF
6]): glass carbon working electrode. Conditions: see Table 4. Inset square wave voltammogram of complex 3.
![Figure 2. A perspective view 26 of the [Ga III (L)] + cation in 2, showing the atom labeling scheme](https://thumb-eu.123doks.com/thumbv2/123dok_br/18990838.460590/6.892.94.436.108.294/figure-perspective-view-iii-cation-showing-labeling-scheme.webp)
![Figure 7. X-band EPR spectra of the electrochemically generated [Mn IV (L – )] 3+ species in CH 2 Cl 2 (0.1 mol dm -3 [(TBA)PF 6 ]) at 298 K: (a) beginning of the electrolysis process (1 minute), (b) after 2 minutes of electrolysis.](https://thumb-eu.123doks.com/thumbv2/123dok_br/18990838.460590/9.892.68.413.102.369/figure-spectra-electrochemically-generated-species-beginning-electrolysis-electrolysis.webp)