A
r
t
ic
le
*e-mail: [email protected]
Methyl and Total Mercury Found in Two Man-Made Amazonian Reservoirs
Helena A. Kehrig,*,a Elisabete F. A. Palermo,a Tércia G. Seixas,a Helder S. B. Santos,a
Olaf MalmaandHirokatsu Akagib
a Instituto de Biofísica Carlos Chagas Filho, Universidade Federal do Rio de Janeiro,
21941-902 Rio de Janeiro-RJ, Brazil
bNational Institute for Minamata Disease (NMD) 4058-18, Hama, Minamata, 867-0008, Kumamoto, Japan
Metilmercúrio (MeHg) e mercúrio total (Hg) foram determinados em amostras de água e peixe coletadas em dois reservatórios da Amazônia Brasileira, que apresentam diferentes características limnológicas e ecológicas. As amostras de água de Tucuruí, reservatório mesotrófico com águas claras, apresentaram a concentração de Hg (12,7 ± 8,4 ng L-1) superior à encontrada em Balbina
(2,2 ± 0,5 ng L-1), que é um reservatório oligotrófico com águas escuras. Nem Cichla spp. (peixe
piscívoro), nem Geophagus surinamensis (peixe onívoro) apresentaram diferença significativa nas concentrações normalizadas pelo comprimento de MeHg e Hg no músculo, entre os dois reservatórios. MeHg e Hg aumentaram com o peso e o comprimento do Cichla spp. e, também, com o posicionamento trófico na cadeia alimentar. O fator de bioconcentração (FBC) do Hg aumentou com o nível trófico dos peixes, do onívoro (103) para o piscívoro (104). Os peixes de
Balbina, ecossistema naturalmente rico em matéria orgânica dissolvida, apresentaram maior FBC. Não somente as diferentes características limnológicas e ecológicas, mas também o hábito alimentar dos peixes parecem ter influência nas concentrações de mercúrio nestes organismos.
Methylmercury (MeHg) and total mercury (Hg) concentrations were determined in water and fish samples from two reservoirs within Brazilian Amazon that present different limnological and ecological characteristics. Tucuruí, a mesotrophic reservoir with clear water, presented higher Hg in water samples (12.7 ± 8.4 ng L-1) than Balbina (2.2 ± 0.5 ng L-1), an oligotrophic reservoir with
black water. Neither Cichla spp. (piscivorous fish), nor Geophagus surinamensis (omnivorous fish) presented significant differences in length-normalized concentrations of MeHg and Hg in muscle, between both reservoirs. MeHg and Hg increased with body weight and standard length
of Cichla spp., and also with the trophic level on the food chain. The Hg bioconcentration factor
(BCF) increased with the trophic level of the fish, from the omnivorous (103) to piscivorous fish
(104). Fish from Balbina, an ecosystem naturally rich in dissolved organic matter, presented the
highest BCF. Not only the different limnological and ecological characteristics but also the feeding habits seem to influence the mercury concentration in fish.
Keywords: limnological and ecological characteristics, hydroelectric reservoirs,
bioconcentration factor, abiotic and biotic samples, total and methyl mercury
Introduction
Methylmercury, the most abundant organic form of mercury in the environment, has been recognised as a serious pollutant of aquatic ecosystems. However limited information about its distribution through the aquatic food chain is available in tropical areas. Methylmercury is largely responsible for the accumulation of mercury in organisms (bioaccumulation) and for
the transfer of mercury through the aquatic food chain (biomagnification).
The concentrations of mercury in fish of the Amazonian rivers have been a subject of concern for the health of humans and wildlife for over 15 years. Deforestation for agricultural projects, damming for hydroelectric power plants, and alluvial gold extraction in Amazonia are increasing mercury discharges into aquatic systems, exposing riverine populations to organic mercury (methylmercury) through the consumption
of fish.1,2 The consumption of fish heavily contaminated with
Numerous researchers have reported the enrichment of
methylmercury in fish from newly impounded reservoirs.3-6
Recent studies showed that soil and wetland inundation are important sources of mercury as methylmercury to overlying water, as well as to the aquatic food chain. This causes an increase in the mercury level in the food
chain, particularly in predatory fish.7 The risk of elevated
mercury concentrations in fish has become one of the most important issues in assessing the environmental impact of
hydroelectric reservoirs.8
The elevated mercury concentrations in fish in newly impounded reservoirs are thought to result from an enhancement of the mobility and bioavailability of mercury
following flooding.9 When a landscape is inundated, organic
carbon in the soil and plants is degraded and released into the water. A high amount of organic matter in the water is accompanied by increased decomposition by microbes and consequently on oxygen deficit. It is generally believed that most methylation of Hg occurs in anoxic environments such
as those found immediately following reservoir creation.10
Wright and Mason11 suggested that mercury and
methylmercury bioaccumulation in the presence of large organic compounds occurs through other mechanisms of uptake besides passive diffusion from water to the cells of the organisms. Dissolved organic matter (DOM) interacts very strongly with mercury, affecting its speciation, solubility, mobility and toxicity in the aquatic ecosystems. Mercury concentrations in many Amazonian soils are naturally high and mercury released from soils into aquatic systems is thought to be higher than the combined
input from anthropogenic sources.12 Further studies in the
1990s have shown that flooding of both podzolic and peat
soil increases mercury methylation.13 Roulet et al.14 found
that the dominant stock of mercury in the Amazon aquatic ecosystem is derived from soil erosion.
There is a need for a basin-wide and systematic approach to sampling and analysis of mercury in fish from different tributaries and reservoirs in the Brazilian Amazon. This means selecting species (or possibly genera) that are representative of the location from which they are captured, and paying attention to factors that are related to the variation in the percentage of total mercury that is present as methylmercury. The present study makes an initial contribution to this task by presenting total mercury and methylmercury data from two reservoirs within the Brazilian Amazon. The present paper adds new insight to existing studies and also complements and compares earlier findings with data generated by this study.
In this study we used two fish species from the Cichlidae
family, Cichla spp. (tucunaré) and Geophagus surinamensis
(acará), which are endemic in the Amazonian ecosystem
and present sedentary and territorial habits. Their preferred habitat is lentic (slow moving) water. They were used as bioindicators of mercury, especially because they integrate mercury over time, in two man-made reservoirs for hydroelectric power plants, Tucuruí and Balbina reservoirs, in the Amazonian basin.
Cichla spp. (tucunaré) are exclusively piscivorous and
opportunistic in their feeding habits.15Cichla is useful for
this purpose because it is commonly consumed and easily
identified (at least to the level of genus). The genus Cichla
is comprised of 15 nominal species recognized by external characters, of which colour pattern and meristics are most
significant.16Cichla is widely distributed in the Amazon
River basin.16 This fish is an important food fish in the diet
of some Amazonian human populations, being consumed
several times a week in several riverine communities.17 Its
commerce is an important economic activity throughout
the region. However, Cichla presents a risk of potentially
harmful methylmercury exposure to humans.
Geophagus surinamensis (acará), an omnivorous fish
species with a tendency towards herbivory,15 is commonly
consumed by some Amazonian human populations.
G. surinamensis lives in mud and sand-bottomed canals.18
G. surinamensis presents a low risk of potentially harmful methylmercury exposure to humans. However, this omnivorous fish presents a high ecological influence on the biotransfer and biomagnification of mercury through
the aquatic food chain.19 Its commerce is also an important
economic activity throughout the region.
The present study was aimed at answering the following question: do different limnological and ecological characteristics influence the assimilation and trophic transference of methylmercury? We also verified if the different limnological and ecological characteristics influence on the concentrations of total mercury in the water column.
For these proposes, we collected samples of water
and muscle of two sedentary fish species, Cichla spp. and
G. surinamensis at two hydroelectric reservoirs (Balbina and Tucuruí) within the Brazilian Amazon that present different limnological and ecological characteristics. Total mercury and methylmercury concentrations were determined in the abiotic and biotic samples.
Experimental
Sampling and sampling areas
and limnological characteristics (Figure 1). Table 1 shows some morphometric and limnological characteristics of
Tucuruí and Balbina reservoirs, based on literature data.20
Muscle samples were collected from 95 specimens of
Cichla spp. and 130 specimens of Geophagus surinamensis
that were caught with nets or directly acquired from local fishermen. Identification of the fish species was done with the help of the fishermen. Body weight and standard length were measured for every fish, and a piece of dorsolateral muscle tissue was sampled for total mercury and methylmercury analysis. Fishing activity is quite intense
in both reservoirs, and Cichla spp. is the predominant
commercial species caught. Biometric parameters from
fish species analyzed (Cichla spp. and G. surinamensis)
in this study are presented in Table 2.
The water samples of the surface water column were collected at six areas within both reservoirs, Balbina and Tucuruí. Double-bagged PET bottles (each one with 2.5 L)
Table 1. Morphometric and limnological characteristics of Balbina and
Tucuruí reservoirs20
Characteristics Reservoir
Balbina Tucuruí
Localization in the Brazilian Amazon (State)
Amazonas Pará
Latitude 01º00’-02º00’S 03º43’-05º15’S
Longitude 59º00’-60º00’W 49º12’-50º00’W
Main river Uatumã Tocantins
Operation Feb 1989 Marc 1985
Vegetation Humid forest Humid forest
Drainage area / km2 18450 803250
Retention time / month 11.7 1.7
Inundated area / km2 2360 2875
Total volume / km3 17.5 45.5
Average flow / (m3s-1) 577 11000
Maximum depth / m 30 75
Water color Black water Clear water
Trophic stage of aquatic environment
Oligotrophic Mesotrophic
Conductivity / (µS cm-1) 20 47-62
pH 5.5-6.0 6.5-7.4
Use Hydroelectric
production and fishery
Hydroelectric production and fishery
Figure 1. Sampling areas in the Brazilian Amazonian.
Table 2. Biological characteristics of sedentary fish species, Cichla spp. and Geophagus surinamensis, and regression relationships between their body weight (W) and standard length (L). (N corresponds to the number of fish specimens collected)
Species Sampling area N Body weight
(min-max) / g
Standard length (min-max) / mm
Relation W and L
Cichla spp. Balbina reservoir 17 400 (97-740)
270 (170-515)
logW = −1.99 + 1.88 logL r2 = 0.76; p < 0.0001
Tucuruí reservoir 78 400 (117-1682)
276 (175-540)
logW = −0.48 + 1.23 logL r2 = 0.51; p < 0.0001
Total 95 logW = −0.74 + 1.34 logL
r2 = 0.52; p < 0.0001
Geophagus surinamensis
Balbina reservoir 11 176 (114-350)
173 (160-195)
logW = −5.12 + 3.28 logL r2 = 0.49; p < 0.01
Tucuruí reservoir 119 137 (41-298)
160 (110-200)
logW = −3.72 + 2.64 logL r2 = 0.89; p < 0.0001
Total 130 logW = −3.77 + 2.67 logL
partially filled with dilute trace metal grade HCl (Merck p.a.) and arm length poly gloves were used in the sampling. Before each sample was collected, the HCl (Merck p.a.) was emptied (downstream of collection) and the bottle rinsed three times with ambient water. The sampling bottle was then filled, immediately recapped, double bagged, and stored in the cooler for transport back to the laboratory.
Instrumentation
Muscle tissue and water samples were analysed for total mercury with a cold vapour atomic absorption spectrometer with a flow injection mercury system (FIMS)- FIAS 400 (Perkin Elmer) with auto sampler AS90 (Perkin Elmer). The carrier gas was argon (99.998%) at
a flow rate of 75 mL min-1. For methylmercury analysis,
the chromatographic system used was a 14 B Shimadzu
gas chromatograph (GC) with a pulsed current 63Ni
electron-capture detector-ECD (Kyoto, Japan) equipped with a Shimadzu C-R6A Chromatopac integrator and a GC silane-treated glass column of 1 m × 3 mm i.d. (GL Sciences Japan) with Hg-20A as stationary phase on 60-80 mesh Uniport HP (GL Sciences, Japan). On the top of column, nearest the injection port, 0.2 g of NaCl crystals were added to enhance the methylmercury detection. This method is based on the fact that methylmercury dithizonate in the final solution in toluene is converted into its chloride form as soon as it passes through the NaCl on the top of
the columns.21 The column oven, detector and injector
temperature were maintained at 150 °C, 250 °C and 180 °C, respectively. The carrier gas was nitrogen (99.999%)
at a flow rate of 40 mL min-1.
Analytical procedure
Total mercury analysis in water samples
The determination of Hg concentration was performed on two aliquots of unfiltered water samples (2.0 L). The
sample was mixed well with 10 mL of H2SO4 (Merck
p.a.) and 5 mL of 0.5% KMnO4 (Merck p.a.) solution, and
allowed to stand for 5 min. The sample was neutralized
with 20 mL of 10 mol L-1 NaOH (Merck p.a.) and 5 mL
of 10% hydroxylamine hydrochloride (Merck p.a.) and allowed to stand for 20 min. After addition of 5 mL of 10% EDTA tetrasodium salt (Dojindo p.a.), the mercury was extracted with 10 mL of 0.01% dithizone (Merck p.a.) in toluene (Tedia ABSOLV) purified with an equal volume of
0.1 mol L-1 NaOH (Merck p.a.) just before use. An aliquot
(5 mL) of the organic layer was transferred into a 50 mL centrifuge tube and dried using a rotary evaporator. The residue in the tube was acid digested for total mercury
analysis following the same procedure as that used for
biological samples.22 Analytical blanks were prepared in a
similar way without addition of the analytes.
Total mercury analysis in fish muscle samples
Total mercury was determined in three aliquots of approximately 500 mg of wet samples of muscle. The
sample was acid digested with 3 mL of H2SO4:HNO3
(1:1, v/v) (Merck p.a.) and 1 mL of conc. H2O2 (Merck
p.a.) in a 50 mL centrifuge tube at 60 °C in water bath for
45 min. After addition of 5 mL of 5% KMnO4 (Merck p.a.)
solution, the digested sample allowed to stand overnight. Total mercury (Hg) concentrations in the acid digested solution were determined by CVAAS (FIMS-system) with
sodium borohydride (Merck p.a.) as a reducing agent.22
Analytical blanks were prepared in a similar way without addittion of the analyte.
Methylmercury analysis in muscle tissue of fish samples
For methylmercury (MeHg), we used an analytical procedure developed at the National Institute for Minamata Disease (NIMD) laboratory and adapted at the UFRJ laboratory. The methylmercury analysis in muscle tissue of fish was made by a combination of the dithizone-toluene
extraction and GC-ECD analysis.22
Methylmercury was performed in two aliquots of approximately 500 mg of wet samples of muscle. Sample
was digested with 10 mL of 1 mol L-1 alcoholic potassium
hydroxide solution in a 50 ml screw-capped centrifuge tube at 100 °C in water bath for 45 min. The digested sample was
slightly acidified with 10 mL of 1 mol L-1 HCl (Merck p.a.).
After washing with 5 mL of n-hexane (Tedia ABSOLV)
the methylmercury was extracted with 10 mL of 0.05% dithizone (Merck p.a.) in toluene (Tedia ABSOLV) purified
with an equal volume of 0.1 mol L-1 NaOH just before to
use. The organic layer was then washed twice with 5 mL of
1 mol L-1 NaOH to remove the excess dithizone. An aliquot
(5 ml) of the organic layer was back extracted with 2 mL
of 0.01% Na2S in 0.1 mol L-1 NaOH/ethanol (1:1v/v). The
excess sulphite ions from the methylmercury solution were
eliminated with continuous bubbling (50 mL min-1) with N
2
gas and some drops of 1 mol L-1 HCl for a further 5 min. To
the sample solution, 2 mL of Walpole’s buffer (pH 3.0) was added. Walpole’s buffer was made with 600 mL of Milli
Q water + 200 mL of 1 mol L-1 CH
3COONa + 200 mL of
1 mol L-1 HCl. The methylmercury from this inorganic layer
was re-extracted with 1 mL of 0.05% purified dithizone-toluene. The organic layer was then washed twice with
2 mL of 1 mol L-1 NaOH to remove the excess dithizone
and subsequently with 5 mL of distilled water and acidified
Optimization of the analytical protocol and quality assurance tests were carried out using the reference materials (CRM) of fish tissues from the National Research Council-Canada (DORM-2, dogfish muscle sample) and from the International Atomic Energy Agency: IAEA IAEA 350 (tuna fish). Certified reference materials, IAEA-350 and DORM-2 were analyzed in all sample batches. Analytical methylmercury quality was certified through inter-comparison exercises between the National Institute for Minamata Disease (NIMD) and the UFRJ laboratories.
Normalization of the total mercury and methylmercury data
Total mercury and methylmercury concentrations in the Cichla spp. and Geophagus surinamensis muscle were subjected to length normalization, in order to compare their levels between the Balbina and Tucuruí reservoirs, due to the different mean body weights and standard lengths of the fish collected at the various locations (see Table 2).
Statistical Analysis
Statistical analyses were performed using STATISTICA®
7.0 for Windows (StatSoft, Inc. 1984-2004, USA). Data were tested for normal distributions (Shapiro-Wilk’s test) and non-parametric tests were then applied. The analysis of variance was done by Kruskal-Wallis ANOVA followed
by a post-hoc test (Mann-Whitney U-test). The U-test
was used to compare the concentrations of total mercury and methylmercury normalized to a standard length and the percent methylmercury of total mercury in muscle tissue of fish with different feeding habits from the two reservoirs. A linear regression was performed to determine the relationship between the biological parameters (body weight or standard length) and the concentrations of total
mercury and methylmercury in muscle tissue. A p value of
less than 0.05 was chosen to indicate statistical significance. Values are presented as mean ± standard deviation (SD) based on a wet weight basis (wet wt.).
Results and Discussion
Detection limit and validation of the analytical method
The detection limit (LOD) was calculated based on the standard deviation of 20 readings obtained for the analytical blanks and the slopes of the analytical curves (LOD =
3s/slope). For total mercury, its value was: 0.00174 mg L-1.
For 500 mg of wet muscle sample, the detection limit for
total mercury and methylmercury in fish was 0.042 µg g-1
and 0.0005 µg g-1, respectively.
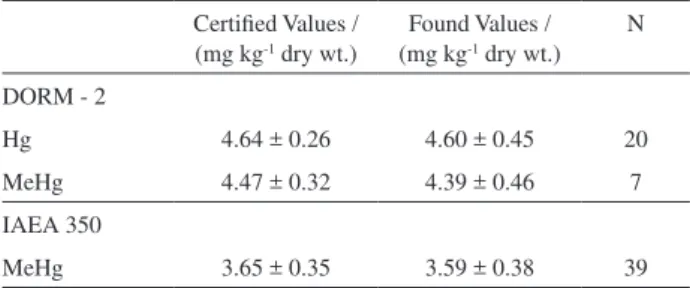
The experimental results for total mercury and methylmercury in the certified reference materials (CRM) from the NRCC (DORM-2) and IAEA (IAEA 350) presented good agreement with the certified values, as presented in Table 3. The standard deviations found for experimental values were low and close to those found for certified values, indicating the high reproducibility of the analytical method (Table 3). The coefficient of variation [(SD × 100) / mean] for each reference sample was lower than 10%, showing that the analytical procedure was satisfactory. According to these results, we can conclude that the analytical method was efficient and reproducible for total mercury and methylmercury determinations in biological tissues, as verified through analysis of the certified reference materials.
Analytical quality for methylmercury was assured by means of inter-laboratory comparison exercises between the National Institute for Minamata Disease (NIMD) and UFRJ laboratories using fish samples from the Balbina reservoir. Methylmercury results for the analysis performed at the two laboratories for 32 fish samples exhibited highly
significant coefficients of correlation (R2 = 0.99). The
gradient of the regression line representing the relationship between analyses in the two laboratories was close to 1
(slope, β = 1.05).
Unfiltered water samples
Mercury concentrations of unfiltered Balbina and Tucuruí waters are low (Table 4). Lago Manso, another newly impounded man-made Brazilian reservoir, also presents low mercury concentration in its water samples
(3.3 ng L−1).6 Generally, total Hg concentrations in surface
waters of the Amazon basin range from 1 to 30 ng L−1,
although higher concentrations may be found immediately downstream of gold mining sites or other Hg pollution
sources as well as with high loads of suspended matter.23
In the region of Petit-Saut hydroelectric reservoirs, French Guiana, close to an area of gold mining activities, total Hg
Table 3. Analytical results for the determination of certified reference
materials (N = number of samples analyzed in this study)
Certified Values / (mg kg-1 dry wt.)
Found Values / (mg kg-1 dry wt.)
N
DORM - 2
Hg 4.64 ± 0.26 4.60 ± 0.45 20
MeHg 4.47 ± 0.32 4.39 ± 0.46 7
IAEA 350
concentrations in unfiltered water samples were higher
(25.4-34.9 ng L-1) as compared to the Downdam station
(2.1-5.4 ng L-1).4 Unfiltered Balbina and Tucuruí water
presented total Hg concentrations similar to those found at the Downdam station of Petit-Saut reservoir.
The Mann Whitney U test analysis demonstrated a
significant difference (Z = –3.18; p = 0.001) for total Hg
concentration between unfiltered water samples from Balbina and Tucuruí reservoirs. Total Hg in unfiltered Tucuruí water samples was approximately 6 times higher than that found in Balbina reservoir.
According to Aula et al.,24 gold mining areas situated
in the region of the Tucuruí reservoir are polluting the
reservoir mainly via the Tocantins River. Tucuruí is formed
by the Tocantins River (4%), the Araguaia River (40%) and
the Itacaiúnas River (5%).25
Fish muscle samples
Significant relationships were found between
log-transformed body weight (W) of fish species, Cichla spp.
and G. surinamensis, and their log-transformed standard
length (L) (p < 0.05; see Table 2).
To evaluate the body weight of Cichla spp. and
G. surinamensis from the two reservoirs (Balbina and Tucuruí), we used the relationships between body weight
and standard length of Cichla spp. and G. surinamensis
(Table 2) to calculate a mass at the overall mean standard length of 275 mm and 161 mm, respectively.
The body weight of approximately 394 g calculated for Cichla spp. (piscivorous fish) of Tucuruí reservoir was
higher than the estimated values of 336 g for fish from the Balbina reservoir. The body weight of approximately
130.4 g and 130.7 g calculated for G. surinamensis
(omnivorous fish) of Balbina and Tucuruí reservoirs did not present a significant difference between them.
The higher body weight found in Cichla spp. from
the Tucuruí reservoir could be because its ecosystem is a more productive ecosystem, mesotrophic, with high phytoplankton densities and also higher nutrients concentrations (C, N, P) than in oligotrophic Balbina
reservoir.20 In the Tucuruí reservoir, the density of
microorganisms in the water column associated with a high accumulation of organic matter results in high
primary production water and more prey items for Cichla.
This genus is opportunistic in terms of prey selection.15 At
the beginning of its life, this genus is planktivorous, then
carnivorous and, in the mature stage, piscivorous. Cichla
spp. capture larger, likely more contaminated prey items
as they grow, i.e. with increasing standard length. In this
study, most of the specimens analyzed were in the sexually
mature stage; as the maturation of Cichla spp. for both sexes
occurs at approximately 200-350 cm. However, studies of diet composition in one location are not necessarily directly applicable to another. Fish feeding behaviour adapts to changes in habitat due to seasonal inundation of the forest. Piscivorous species, which are at the top of aquatic food chains, are a good indicator of mercury contamination in
fish.26 Amongst the data generated as part of the present
study, only 3 specimens (3%) of the samples of Cichla
spp. muscle presented a total mercury concentration higher
than the maximum permissible limit of 1.0 µg g-1 wet wt.
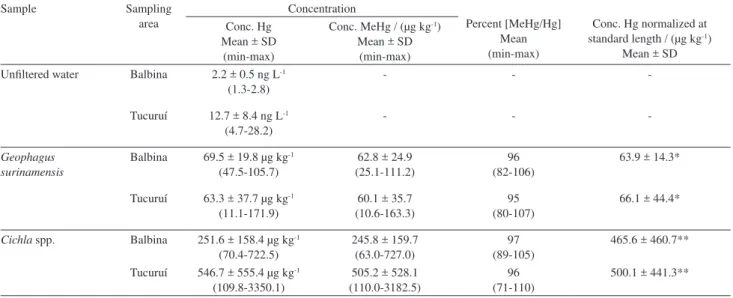
Table 4. Mean and range (min-max) of total mercury (Hg) and methylmercury (MeHg) concentrations (µg g-1 wet wt.), the ratios of methylmercury to
total mercury (MeHg/Hg), the mean total Hg and MeHg concentrations normalized to a standard length in Cichla spp. and Geophagus surinamensi and total Hg in unfiltered water samples from Balbina and Tucuruí reservoirs. (N corresponds to the number of fish specimens collected)
Sample Sampling
area
Concentration
Percent [MeHg/Hg] Mean (min-max)
Conc. Hg normalized at standard length / (µg kg-1)
Mean ± SD Conc. Hg
Mean ± SD (min-max)
Conc. MeHg / (µg kg-1)
Mean ± SD (min-max) Unfiltered water Balbina 2.2 ± 0.5 ng L-1
(1.3-2.8)
- -
-Tucuruí 12.7 ± 8.4 ng L-1
(4.7-28.2)
- -
-Geophagus surinamensis
Balbina 69.5 ± 19.8 µg kg-1
(47.5-105.7)
62.8 ± 24.9 (25.1-111.2)
96 (82-106)
63.9 ± 14.3*
Tucuruí 63.3 ± 37.7 µg kg-1
(11.1-171.9)
60.1 ± 35.7 (10.6-163.3)
95 (80-107)
66.1 ± 44.4*
Cichla spp. Balbina 251.6 ± 158.4 µg kg-1
(70.4-722.5)
245.8 ± 159.7 (63.0-727.0)
97 (89-105)
465.6 ± 460.7**
Tucuruí 546.7 ± 555.4 µg kg-1
(109.8-3350.1)
505.2 ± 528.1 (110.0-3182.5)
96 (71-110)
500.1 ± 441.3**
established for human consumption of predatory fish in
Brazil.27 Meanwhile, 31 fish samples analyzed (22%) had
MeHg concentrations above the maximum limit of 0.5 µg
Hg g-1 wet wt. established for food by the WHO.28 This
does not mean, however, that there is lower risk to human health, as the early signs of the neurotoxic effects that could be related to MeHg exposure from fish consumption have been shown in at least one riverine community in the Tapajós River basin. These signs of neurotoxic effects could be related to methylmercury exposure from fish
consumption.1,29
Range (min-max) and mean concentrations, on a wet weight basis, of total mercury (Hg) and methylmercury (MeHg) and the ratios of MeHg to total Hg (MeHg/Hg) in Cichla spp. and Geophagus surinamensis are presented in Table 4.
Total Hg and MeHg concentrations in the 95 muscle
samples of Cichla spp. ranged from 0.07 to 3.35 µg Hg g-1
wet wt. and from 0.06 to 3.18 µg MeHg g-1 wet wt. Total
Hg and MeHg concentrations in the 130 muscle samples of G. surinamensis ranged from 0.01 to 0.17 µg Hg g-1
wet wt. and from 0.01 to 0.16 µg MeHg g-1 wet wt. In this
study, total Hg and MeHg concentrations found in the
muscle samples of Cichla spp. and G. surinamensis were
of the same order of magnitude as those reported in earlier
studies with Amazonian freshwater fishes from Brazil,2,3,30,31
Suriname32 and French Guiana.4 In addition, recent mercury
data compared with those of 15 years ago from the Tucuruí area showed a reduction in mercury concentrations by a factor of two or three times for piscivorous fish, including
Cichla spp.25
The Kruskal-Wallis ANOVA analysis demonstrated highly significant differences for Hg and MeHg concentrations between the muscle of all fish species (omnivorous and piscivorous) from Balbina (H = 15.4;
p « 0.001) and Tucuruí (H = 138.1; p « 0.001) reservoirs.
The mean total Hg concentration in muscle tissue was higher, and more variable, in the piscivorous fish than in the omnivorous fish (Table 4). Total Hg concentrations
varied widely among the investigated species. Cichla spp.,
which feeds mainly on fish species, presented the highest total Hg value, approximately 9 times and 4 times higher
than those values found in Geophagus surinamensis from
Tucuruí and Balbina reservoirs, respectively. This finding is consistent with earlier observations on the biota of
Amazon Basin.2,4,33,34 According to Dórea and Barbosa,2 a
wide variation in fish mercury bioaccumulation is expected in the complex and biologically dense environment of the Amazon rain forest.
Regarding mercury dietary intake, which can influence mercury uptake in freshwater organisms, there is a marked
difference between the concentrations within fish species. Furthermore, the variability of total Hg in the different fish species is likely to reflect both interspecies dietary differences, with correspondingly different total Hg levels,
and age-related accumulation trends.34
Piscivorous and omnivorous fishes showed similar ratios of methylmercury/total mercury (MeHg/Hg) in muscle tissue, of around 100% in both reservoirs (see Table 4). Total Hg in muscle tissue was found essentially in the form of organic mercury, as MeHg, in agreement with previously reported values for piscivorous and omnivorous
fish of the Brazilian Amazon.3,30,35 According to Watras et
al.,36 methylmercury concentrations at higher trophic levels
reflect an uptake from lower trophic levels; among others, involving such factors as diet and growth. Due to its lengthy persistence and high mobility in the aquatic ecosystem, methylmercury shows a high level of biomagnification in the upper levels of the food chain.
The Mann-Whitney U test demonstrated a highly
significant difference (Z = 86.0; p < 0.001) between the
analyzed MeHg of muscle tissue from the piscivorous and
the omnivorous fish from Tucuruí (Z = 11.8; p « 0.001)
and Balbina reservoirs (Z = 3.9; p « 0.001), respectively.
MeHg increased successively with increasing trophic level, from the omnivorous fish to the piscivorous fish (Table 4). This indicates that biomagnification may be occurring along the Balbina and Tucuruí food chains. This finding is consistent with early observations on the
biota of Amazon Basin.4,30 Biomagnification is defined
as the increasing concentration of a trace element at successively higher trophic levels of a food chain, i.e. when the concentrations in the tissues of one organism exceed
those in its food source.37,38 Biomagnification of MeHg in
aquatic food chains is well known and is evident in repeated observations of the highest concentrations in large, long-lived, upper trophic level animals. The trophic level is of extreme importance among the ecological factors that control
mercury, such as MeHg levels in different fish species.34
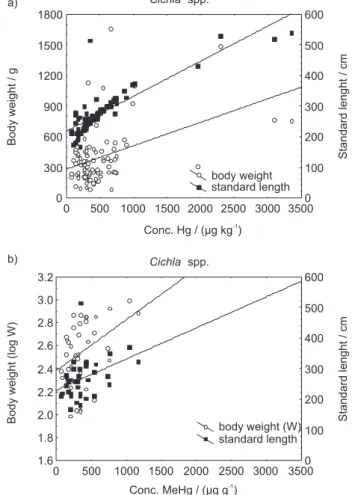
Significant and positive correlations were found
between total Hg and MeHg concentrations in Cichla
spp., a piscivorous fish species, and their body weight (W)
(log-transformed) or standard length (L) (p < 0.05), (see
Table 5, Figure 2). While Hg concentration showed a linear increase with standard length and body weight (see Figure 2a), the concentration of methylmercury exhibited a linear increase with standard length and a body weight (see Figure 2b). Total Hg and MeHg exhibited highly
significant coefficients of correlation (r2 = 0.73 and
r2 = 0.59, respectively) with the standard length of Cichla
spp.; whereas concentrations presented low coefficients
with body weight. The concentration of mercury is best correlated with the fish length, since length does not
decrease with time, while body weight sometimes does.39
The methylmercury concentration at higher trophic levels reflects the uptake at lower trophic levels and other factors
such as diet and growth.36
However, no significant relationships (p » 0.05) were
found between biological characteristics (L and W) of G.
surinamensis, an omnivorous fish species, and muscular total Hg and MeHg (see Table 5).
Total mercury and methylmercury concentrations in the
Cichla spp. muscle were subjected to length normalization in order to compare their levels between Balbina and Tucuruí reservoirs, due to the different mean standard length (L) of the fish sampled in both reservoirs (Table 2).
In this case, we normalized the concentrations of total Hg and MeHg using the regression equations, [Hg] = 6.4L - 1252.2 and [MeHg] = 1.5L - 37.5. These regression equations
presented significant relationships (r2 = 0.73 for Hg and r2 =
0.59 for MeHg, p < 0.0001) between concentrations of total
Hg and MeHg and standard length (L) of the 95 specimens of Cichla spp. The range and mean of length-normalized concentrations of total Hg are summarized in Table 4. Concentrations of total Hg and MeHg at a standard size were
also reported by Sorensen et al.40 and Kehrig et al.3
We normalized the concentrations of total Hg and
MeHg in G. surinamensis using a mean fish length of
161 mm that corresponds to the mean of standard length of the 130 specimens of this omnivorous fish. The mean fish length was used due to no significant difference was found between body weights and standard lengths of this fish species collected at the Balbina and Tucuruí reservoirs. Differences in growth rate between fish populations in this study are a potential explanation for variations in total Hg and MeHg concentrations. Fish growth rates may affect mercury accumulation by changing the balance between the rate of deposition of new tissue and the gut adsorption
efficiencies for both nutrients and MeHg.3
The U test revealed no significant differences between
the Balbina and Tucuruí reservoirs for the normalized
concentrations of total Hg (N = 95; Z = 0.29; p > 0.50)
and MeHg (Z = 0.095; p > 0.50) in Cichla spp. We also
found no significant difference (Z = 0.016; p > 0.50) in the
ratios of MeHg to total Hg between these two reservoirs of Brazilian Amazon.
Table 5. Regression relationships between total mercury (Hg) and methylmercury (MeHg) concentrations (µg g-1 wet wt.) in muscle and body weight or
standard length of the fish species. (N corresponds to the total number of fish specimens collected)
Species N Relation
concentration and W
Relation concentration and L
Cichla spp. 95 [Hg] = 0.8*W + 175.0 r2 = 0.18; p < 0.001
[Hg] = 6.4*L – 1252.1 r2 = 0.73; p < 0.0001
[MeHg] = 350*logW – 517.0 r2 = 0.16; p < 0.02
[MeHg] = 1.5*L – 37.5 r2 = 0.59; p < 0.0001
Geophagus surinamensis 130 [Hg] = -16.4*logW + 98.3 r2 = 0.08; p > 0.10
[Hg] = –31*logL + 132.3 r2 = 0.11; p = 0.05
[MeHg] = –44*logW + 165.0 r2 = 0.06; p > 0.10
[MeHg] = –0.3*L + 118.0 r2 = 0.04; p > 0.10
Figure 2. Relationship between total mercury (a) and methylmercury
Similarly the U test also revealed no significant differences among Balbina and Tucuruí reservoirs for the normalized concentrations of total Hg (N = 130; Z = 0.73;
p > 0.50) and MeHg (Z = -1.57; p > 0.10) in G. surinamensis,
as well as no significant difference (Z = -0.25; p > 0.50) in
the ratios of MeHg to total Hg between both these reservoirs of Brazilian Amazon.
Bioconcentration factor
Mercury in the muscle of fish is mainly the result of bioaccumulation and biomagnification of MeHg along
the aquatic food chain.41 According to Reinfelder et al.,42
the uptake of mercury from the dissolved water phase is a significant pathway for bioaccumulation of contaminants by aquatic organisms that present smaller body size and higher superficial relative area, such as plankton. The increase of the body size of the aquatic organisms, such as fish, decreases the rate of uptake of dissolved mercury from the water; consequently the trophic transfer of mercury becomes the
most efficient pathway for its accumulation.42 Fish assimilate
mercury mainly by ingestion of food, which may vary according to the concentration of mercury in fish prey.
Bioconcentration is defined as the uptake of a chemical by an organism from the abiotic environment resulting in
a higher concentration within the organism.37 In this study,
the bioconcentration factor (BCF) was calculated as the relation between the total Hg concentration in the muscle
samples of Cichla spp. and Geophagus surinamensis and
the total Hg concentration of the unfiltered water samples
from Balbina and Tucuruí reservoirs, i.e. [Hg]fish/ [Hg]water.
BFC was used to compare mercury concentrations in water and fish between Balbina and Tucuruí reservoirs since it could reflect the bioavailability of mercury in both reservoirs. It is known that water chemistry influences the bioaccumulation of mercury by primary producers, phytoplankton at the bottom of the food chain. Plankton ultimately determine the resultant levels in higher trophic
organisms, such as fish.43
The bioconcentration factor observed, relative to the
total Hg concentration in Cichla spp. collected at Balbina
reservoir and its water samples (11.4 × 10⁴) was 4 times
higher than that found for Geophagus surinamensis
(31.6 × 10³) from the same ecosystem. The BCF observed
relating to the total Hg concentration by Cichla spp.
collected at Tucuruí reservoir and its water samples
(4.3 × 10⁴) was approximately 10 times higher than that
found for G. surinamensis (5.0 × 10³) from the same
ecosystem.
The BCF increased successively with increasing trophic
level, from the omnivorous fish (103) to the piscivorous fish
(104). In this study, the piscivorous fish, Cichla spp., was
a fish species that presented the highest tissue mercury concentrations, and is also the highest trophic level fish in both reservoirs. This is in agreement with an earlier study
conducted at Lake Powell, a man made reservoir.44
The BCF relating to the total Hg concentration by
Cichla spp. and G. surinamensis collected at Balbina reservoir were approximately 3 times and 6 times higher than those from Tucuruí reservoir. This may be related to differences between the aquatic environmental conditions of the Balbina and Tucuruí reservoirs.
The aquatic ecosystem of Tucuruí presented a higher process of eutrophication than Balbina reservoir. Tucuruí reservoir is a mesotrophic aquatic environment that presents
macrophytes quite restricted to a few areas.25 Eutrophication
may affect the biogeochemical cycling of mercury in reservoirs, playing an important role in its transport and
immobilization.45 These process changes strongly affect
the chemical forms of mercury that can determine the bioavailability of mercury in water. Fish in eutrophic lakes, however, were often found to contain less mercury than those in oligotrophic lakes. This phenomenon has been explained by the increasing algal biomass in eutrophic systems reducing mercury accumulation at higher trophic levels
through the dilution of mercury in consumed algal cells.45
The aquatic system of Balbina reservoir presents black waters and acid pH (see Table 1) that are rich in natural organic matter. A number of studies have demonstrated that MeHg bioaccumulation is higher in lower pH aquatic
systems,46 such as Balbina reservoir. Natural organic matter
interacts with mercury in several different ways, affecting the transport, transformation and bioavailability of mercury. One of the most important reactions is the formation of extremely strong ionic bonding between mercury and reduced sulphur sites in soil and aquatic organic matter. Strong complexation facilitates the mobility of mercury
from natural and contaminated soils and sediments47
into streams,48 lakes,49 and groundwater.50 This enhanced
mobility results in increased water column concentrations of mercury in otherwise pristine lakes and streams.
In most freshwaters, the predominant form of mercury is ionic mercury in the divalent state (Hg II), whereas in most muscle fish species > 95% of mercury is in the form
of methylmercury (MeHg = CH3Hg+). Thus, conversion
process, with abiotic methylation likely to be important
in organic-rich lakes.51 Once methylmercury is formed,
dissolved organic matter (DOM) facilitates its solubility (thus increasing the water column concentration) and
transport through complexation.52 Apart from the role of
DOM, mercury methylation and bioaccumulation rates in aquatic systems are influenced by a large number of complexes, inter-related environmental variables, such as biological activity, nutrient availability, pH, temperature, redox potential, and inorganic and organic complexing
agents.53 The biological uptake of methylmercury also
appears to be strongly influenced by the concentration and type of DOM present in the ecosystem. While the toxicity and bioaccumulation of most other trace metals are generally reduced by complexation with DOM, mercury
bioavailability can be increased or decreased by DOM.53
Although Tucurui reservoir presented higher mercury concentrations in water than Balbina reservoir, the concentration of mercury found in fish from both reservoirs could be considered similar. Probably, this is related to the process of eutrophication that is occurring in the Tucuruí ecosystem. Eutrophication processes increase the biomass in the Tucuruí ecosystem that may subsequently dilute the mercury concentration and reduce its availability to fish
species.54
Conclusions
Relatively low concentrations of Hg were found in the unfiltered water samples when compared with other man-made reservoirs, mainly those from the Amazon basin. Hg concentrations in water samples varied according to the trophic stage of the aquatic environment and water color of the reservoir. Balbina reservoir, an oligotrophic black water ecosystem, rich in natural dissolved organic matter, presented lower mercury concentrations in water samples than Tucuruí, a mesotrophic clear water ecosystem. The increasing concentration of MeHg at successively higher trophic levels of the food chain of both reservoirs corresponds to a transfer between trophic levels from the
lower trophic level (G. surinamensis) to the predatory
(Cichla spp.), suggesting that MeHg was biomagnified. Hg and MeHg were positively correlated with the piscivorous fish standard length, suggesting that larger and older fish
bioaccumulated more of this element. Neither Cichla spp.
nor G. surinamensis presented significant differences in normalized concentrations between the reservoirs. The Hg bioconcentration factor increased with fish trophic level,
from the omnivorous fish (103) to the piscivorous fish (104).
However, the bioconcentration factors observed in Balbina reservoir were significantly higher than those found in
Tucuruí reservoir. Based on the results presented here, we can conclude that not only different limnological and ecological characteristics but also feeding habits lead to different patterns of accumulation of mercury as methylmercury in the muscle tissue of fish species. The different limnological and ecological characteristics of the reservoirs also influenced the concentrations of total mercury in the water column and, consequently, mercury bioaccumulation and also mercury concentration in fish muscle.
Acknowledgments
The authors would like to thank the Brazilian National Council for Scientific and Technological Development (CNPq) and ELETRONORTE for financial support, as well as for the infrastructure and logistical support provided by ELETRONORTE to carry out the fish collections. The authors also thank an anonymous referee who made significant contributions to the improvement of the manuscript during the evaluation process.
References
1. Dolbec, J.; Mergler, D.; Sousa Passos, C. -J.; Lebel, J.; Int. Arch. Occup. Environ. Health 2000, 73, 195.
2. Dórea, J. G.; Barbosa, A. C.; Biol. Trace Elem. Res.2007, 115,
243.
3. Kehrig, H. A.; Howard, B. M.; Malm, O.; Environ. Pollut. 2008,
154, 68.
4. Boudou, A.; Maury-Brachet, R.; Coquery, M.; Durrieux, G.; Cossa, D.; Environ. Sci. Technol.2005, 39, 2448.
5. Verdon, R.; Brouard, D.; Demers, C.; Lalumiere, R.; Water, Air, Soil Pollut. 1991, 56, 405; Porvari P.; Sci. Total Environ. 1995,
175, 109; Schetagne, R.; Doyon, J. F.; Fournier, J. J.; Sci. Total Environ.2000, 260, 135
6. Tuomola, L.; Niklasson, T.; Castro e Silva, E.; Hylander, L. D.; Sci. Total Environ.2008, 390, 177.
7. Masson, S.; Tremblay, A.; Sci. Total Environ.2003, 304, 377.
8. Fearnside, P. M.; Environ. Manage.2001, 27, 377.
9. Verta, M.; Aqua. Fenn.1984, 14, 215; Wasserman, J. C.; Hacon,
S.; Wasserman, M. A.; Ambio2003, 32, 336.
10. Bodaly, R. A.; Hecky, R. E.; Fudge, R. J. P.; Can. J. Fish. Aquat. Sci. 1984, 41, 682; Rudd, J. W. M.; Harris, R.; Kelly, C. A.; Hecky, R. E.; Ambio1993, 22, 246.
11. Wright, D.A.; Mason, R.P.; Int. J. Environ. Pollut. 2000, 13, 226.
12. Roulet, M.; Lucotte, M.; Saint-Aubina, A.; Trana, S.; Rheault, I.; Farella, N.; Jesus Silvs, E.; Dezemcourt, J.; Souza-Passos, C. J.; Santos Soares, G.; Guimarães, J. R. D.; Mergler, D.; Amorim, M.; Sci. Total Environ.1998, 223, 1; Fadini, P. S.; Jardim, W.
13. Lucotte, M.; Hillarie-Marcel, C.; Mucci, A.; Pichet, P.; Planas, D.; Van Tra, H.; Abstracts of 3rd International Conference on
Mercury as a Global Pollutant, Whistler, British Columbia, Canada, 1994.
14. Roulet, M.; Lucotte, M.; Canuel, R.; Farella, N.; De Freitas Goch, Y. G.; Pacheco Peleja, J. R.; Guimarães, J. R. D.; Mergler, D.; Amorim, M.; Limnol. Oceanogr.2001, 46, 1141.
15. Abelha, M. C. F.; Agostinho, A. A.; Goulart, E.; Acta Sci. Biol. Sci. 2001, 23, 425; Winemiller, K. O.; Taphorn, D. C.; Barbarino-Duque, A.; Copeia 1997, 4, 690.
16. Kullander, S. O.; Ferreira E. J. G.; Ichthyol. Explor. Freshwaters
2006, 17, 289.
17. Lebel, J.; Roulet, M.; Mergler, D.; Lucotte, M., Laribe, F.; Water, Air, Soil Pollut. 1997, 97, 31; Passos, C. J. S.; Mergler,
D.; Lemire, M.; Fillion, M.; Guimarães, J. R. D.; Sci. Total Environ.2007, 373, 68.
18. Kullander, S. O.; Nijssen, H. In The Cichlids of Surinam: Teleostei, Labroidei; Brill, E. J., ed.; Brill Academic Publishers: The Netherlands, Leiden, 1997, p. 256.
19. Cabana, G.; Rasmussen, J. B.; Nature1994, 372, 255.
20. Eletronorte; Relatório Técnico sobre o Programa de Limnologia e Qualidade da Água de Tucuruí, Brasil, 1998, p.42.; Espíndola,
E. L. G.; Matsumura-Tundisi, T.; Reitzler, A. C.; Tundisi, J. G.; Rev. Bras. Biol.2000, 60, 179.
21. Akagi, H.; Nishimura, H. In Advances in Mercury Toxicology; Suzuki, T.; Imura, N.; Clarkson, T. W., eds.; Plenum Press: New York, 1991, session 1.
22. Kehrig, H. A.; Costa, M.; Moreira, I.; Malm, O.; J. Braz. Chem. Soc.2006, 17, 1409.
23. Maurice-Bourgoin, L.; Quiroga, I. In The Ecohydrology of South American Rivers and Wetlands; McClain, M. E., ed.; International Association of Hydrological Sciences: Wallingford, 2002.
24. Aula, I.; Braunschweiler, H.; Malin, I.; Sci. Total Environ.1995,
175, 97.
25. Malm, O.; Palermo, E. F. A.; Santos, H. S. B.; Rebelo, M. F.; Kehrig, H. A.; Oliveira, R. B.; Meire, R. O.; Pinto, F. N.; Moreira, L. A.; Guimarães, J. R. D.; Torres, J. P. M.; Pfeiffer, W. C.; RMZ-M & G2004, 51, 1195.
26. Belger, L.; Forsberg, B. R.; Sci. Total Environ.2006, 367, 452.
27. Brasil; Agência Nacional de Vigilância Sanitária-Portaria nº 685 de 27/08/98, Brasília, Brasil, 1998.
28. WHO; Environmental Health Criteria 101, World Health Organisation: Geneva, 1990.
29. Lebel, J.; Mergler, D.; Branches, F.; Lucotte, M.; Amorim, M.; Larribe, F.; Dolbec, J.; Environ. Res. 1998, 79, 20; Grandjean, P.;
White, R. F.; Nielsen, A.; Cleary, D.; Santos, E. C. O.; Environ. Health Perspect. 1999, 107, 587.
30. Kehrig, H. A.; Malm, O.; Appl. Organomet. Chem.1999, 13, 689. 31. Bastos, W. R.; Almeida, R.; Dórea, J. G.; Barbosa, A. C.;
Ecotoxicology2007, 16, 341.
32. Mol, J. H.; Ramlal, J. S.; Lietar, C.; Verloo, M.; Environ. Res.
2000, 86, 183.
33. Dórea, J. G.; Barbosa, A. C.; Silva, G. S.; Comp. Biochem. Physiol.2006, 142, 275; Hylander, L. D.; Gröhn, J.; Tropp,
M.; Vikström, A.; Wolpher, H.; Castro e Silva, E.; Meili, M.; Oliveira, L. J.; J. Environ. Manage.2006, 81, 155.
34. Sampaio da Silva, D.; Lucotte, M.; Davidson, R.; Environ. Res.
2009, 109, 432.
35. Akagi, H.; Malm, O.; Kinjo, Y.; Harada, H.; Branches, F. J. P.;
Pfeiffer, W. C.; Kato, H.; Sci. Total Environ.1995, 175, 85.
36. Watras, C. J.; Back, R. C.; Halvorsen, S.; Hudson, R. J. M.;
Morrison, K. A.; Wente, S. P.; Sci. Total Environ.1998, 219,
183.
37. Gray, J. S.; Mar. Pollut. Bull.2002, 45, 46.
38. Barwick, M.; Maher, W.; Mar. Environ. Res.2003, 56, 471.
39. Huchabee, J. W.; Elwood, J. W.; Hildebrand, S. C. In The Biogeochemistry of Mercury in the Environment; Niagru, J. O., ed.; Elsevier: Amsterdam, 1979.
40. Sorensen, J. A.; Glass, G. E.; Schmidt, K. W.; Huber, J. H.;
Rapp Jr., G. R.; Environ. Sci. Technol.1990, 24, 1716.
41. Lindqvist, O.; Johnasson, K.; Aastrup, M.; Andersson, A.; Bringmark, L.; Hovsenius, G.; Håkanson, Å.; Meili, M.; Timm, B.; Water, Air, Soil Pollut. 1991, 55, 1.
42. Reinfelder, J. R.; Fisher, N. S.; Luoma, S. N.; Nichols, J. W.; Wang, W-X.; Sci. Total Environ.1998, 219, 117.
43. Mason, R. P.; Laporte, J. -M.; Andres, S.; Arch. Environ. Contam. Toxicol. 2000, 38, 283.
44. Potter, L.; Kidd, D.; Standiford, D.; Environ. Sci. Technol.1975, 9, 41.
45. He, T.; Feng, X.; Guo, Y.; Qiu, G.; Li, Z.; Liang, L.; Lu, J.; Environ. Pollut.2008, 154, 56.
46. Watras, C. J.; Bloom, N.S.; Liminol. Oceanogr. 1992, 37, 1313.
47. Wallschlager, D.; Desai, M. V.; Wilken, R. D.; Water, Air, Soil Pollut. 1996, 90, 507.
48. Mierle, G.; Ingram, R.; Water, Air, Soil Pollut.1991, 56, 349. 49. Driscoll, C. T.; Blette, V.; Yan, C.; Schofield, C. L.; Munson,
R.; Holsapple, J.; Water, Air, Soil Pollut.1995, 80, 499. 50. Krabbenhoft, D. P.; Babiarz, C. L.; Water Resour. Res.1992,
28, 3119.
51. Ullrich, S. M.; Tanton, T. W.; Abdrashitova, S. A.; Crit. Rev. Environ. Sci. Technol. 2001, 31, 241.
52. Miskimmin, B. M.; Bull. Environ. Contam. Toxicol.1991, 47,
743; Hurley, J. P.; Benoit, J. M.; Babiarz, C. L.; Shafer, M. M.; Andren, A. W.; Sullivan, J. R.; Hammond, R.; Webb, D. A.; Environ. Sci. Technol.1995, 29, 1867.
53. Ravichandran, M.; Chemosphere2004, 55, 319.
54. Björnberg, A.; Håkanson, L.; Lundberg, K. A.; Environ. Pollut.
1988, 49, 53.