Article
Printed in Brazil - ©2017 Sociedade Brasileira de Química0103 - 5053 $6.00+0.00*e-mail: [email protected]
Study of Viability of Solid-Phase Microextraction,
in vivo
, in the Extraction of
Microbial Volatile Organic Compounds Associated to the Pigment Production
Process by the
Monascus
Fungus, in Submerged Fermentation
Robson L. Schacker,a Denise E. Moritz,b Miguel S. B. Caro,a Luiz A. S. Madureira,a
Adriana N. Dias,a Josias O. Merib,a Douglas Isfranb and Eduardo Carasek*,a
aDepartamento de Química and bDepartamento de Engenharia Química e Engenharia de Alimentos,
Universidade Federal de Santa Catarina (UFSC), 88040-900 Florianópolis-SC, Brazil
Microbial volatile organic compounds (MVOCs) are present in several production processes in biotechnology. In this study it is evaluated the viability of use of a method involving solid-phase microextraction (SPME), in vivo SPME, in the extraction of MVOCs, associated with the pigment production process by the Monascus fungus. PDMS/Car/DVB (50/30 μm) iber in the headspace mode (HS-SPME) and gas chromatography-mass spectrometry (GC-MS) were used to fermentation broth study. Seventeen compounds were found associated with the presence of the fungus, being the main ones ethanol, 2-methyl-propanol, 3-methyl-butanol, 2-methyl-butanol and 2-phenyl-ethanol. These compounds have maximum concentration of 313.87, 5.51, 2.37, 0.95 and 0.70 mg L−1. The values of biomass and red pigment found for fermentation for ten days
were 4.03 ± 0.21 g L−1 and 3.96 ± 0.17 (UA
480). Regular MVOC productions were observed in
this study, which were useful in the prediction and control of fermentation by Monascus fungus.
Keywords: volatile compoundsin vivo,microbial volatile, Monascus ruber, SPME, submerged fermentation
Introduction
Recent researches have evaluated a number of volatile organic compounds produced by microorganisms called MVOCs in order to understand the relations and interactions of these compounds with the culture units and with other system microorganisms. Some of these organic compounds have inhibited or stimulated the growth of
several other species.1,2
In the current increasing expansion of biotechnology, many promising processes for the production of inputs and reagents use microorganisms, among them the fungi as main producer. Traditionally, Asian countries use
a red pigment produced by Monascus fungi, on solid
medium, through rice fermentation, and this pigment has application in food. Few studies have been done in liquid
medium.3,4 As in any industrial process, the production
of pigment by fungi generates a series of VOCs (volatile organic compounds), forming a peculiar set of aromas which many times remains unknown, being rejected by the exhaustion of reactors along with carbon dioxide from
cellular respiration. There are several methods to analyze volatile compounds, although measurements made in real time need equipments for on-site measures, which not always have the analytical sensitivity desired by the analyst. A viable economic alternative is the use of solid-phase microextraction (SPME) to extract microbial volatile
compounds with higher eficiency, in vivo, when higher
sensitivity and economy is needed.5,6
The SPME has broad application in concentrations of analytes in the gas phase and has its grounding in the principles of gas-liquid separation, or liquid-liquid, being used together with gas chromatography with capillary columns. The SPME instrumentation consists on a iber coated with polydimethylsiloxane, polyacrylate or other polymers, this iber is assembled into a holder that has a needle (like a plunger) to hide or expose the iber. To develop SPME methods it takes several selection and optimization processes, such as iber type selection, study of the extraction profiles, extraction mode selection, analyte adsorption or partition parameters for commercial
adsorbents and new promising materials.7 Recently, the
and lexibility to adapt to several analytes of biochemical
interest, including some associated with metabolome.8
Compounds which are product of biosynthesis, such as alcohols, ketones, esters, and compounds containing sulfur were also successfully studied in living organisms through
this technique.5
In this study it is evaluated the viability of use of a
method involving solid-phase microextraction, in vivo
SPME, in the extraction of MVOCs, associated with the
pigment production process by the Monascus fungus.
The pigment production process continuously generates volatile compounds and some of these may degrade during the fermentation period, so the study of the viability of use of SPME (headspace) is necessary because the technical excellence does not guarantee its application in biotechnological production control due to the constant change in the chemical balance in solution. The evaluated compounds are emitted or produced during the fermentation process and after the end of the process. It was used a benchtop fermenter especially projected for withdrawing fermentation liquid samples in real time, with the best
efficiency in material and biological resources use.3
Some studies use solid-phase microextraction to evaluate volatile organic compounds of biological materials, mainly
targeting the pharmacological and toxicological areas.9,10
Few studies with emphasis on biotechnology and food area are found, where solid-phase microextraction is used to evaluate metabolites during the fermentation process (in line). In this study, it was emphasized the importance of experimental design to obtain greater eficiency with fewer analyzes and less resource consumption, even it being a
low-cost fermentation.11
Experimental
The fungus used in the study was the Monascus ruber
CCT 3802 species, a ilamentous fungus obtained at André Tosello Foundation (São Paulo, Brazil). The cultures are stored under potato dextrose agar (Merck, Kenilworth, USA), in a refrigerator, for four months. After that, the
cultures are renewed.3
Submerged fermentation
The culture medium used for the submerged fermentation was the rice medium, which consists of a
mixture of 20 g L−1 of rice powder, 7 g L−1 of glycine, 2 g L−1
of glucose and distilled water. Before the inoculation of the fungus, a pre-inoculation of 10 days is done, in order to suppress the adaptation phase, in test tubes containing agar with rice powder, glycine and glucose (Sigma-Aldrich,
St. Louis, USA) in the same proportions mentioned above. The inoculation of the microorganism in the liquid medium is performed by transferring 5 mL of the autoclaved liquid medium to the test tube containing the solid medium, sweeping the solid surface with a platinum loop, to detach the mycelia. The tubes are agitated by vortexing for 2 minutes. The liquid is transferred to the fermenter through a silicone hose, without exposing the interior of
the fermenter.12
After the fermentation parameters were set, based in bibliography and test experiments performed with fermentation in Erlenmeyer lask, experiments with the
fermenter were initiated.13 Three fermentations (Ferm.01,
02 and 03) were performed within periods of ive, eight and ten days, respectively, all with the same fermenter and in the same conditions. The fermenter was made of glass (Dist, Florianópolis, Brazil), with a coupling plug at the top for itting hoses and an air outlet directed to a collector cartridge with “XAD-2”. The total volume of the fermenter is
of 1320 cm3, the space conined above the liquid is kept at 1/3
of the total volume for better oxygen transfer, the air supply
is done by a low-power compressor (19.44 ± 0.23 mL min−1),
air iltration is done by two gas scrubbers containing 150 mL
of barium hydroxide solution (4 g L−1) and microbiological
membrane with a 0.22 μm pore (Sartorius, Goettingen, Germany). During fermentation, the temperature is kept at 30 °C and the agitation at 200 rpm.
The procedure of sample collection was done by taking two 2 mL aliquots, through suction with sterile glass syringe, every twelve hours. The two aliquots are mixed to form a composite sample, thus reducing the number of samples and improving homogeneity. All the collected samples are identiied and stored at −10 °C, all controls are performed to keep the homogeneous conditions of fermentation. Every twelve hours the barium hydroxide solution from the gas scrubbers was replaced by another
of the same concentration for better removal of CO2 and
other contaminants from the air.
Preparation of the samples of the fermentation
After the end of the fermentation, the samples of the fermentation liquid, taken in line, were centrifuged and the liquid was separated from the solid material using a pipette. The liquid was subjected to a microiltration with polyvinylidene diluoride (PVDF) membrane ilters with a 0.22 μm pore (Chromail, Düren, Germany), where
an average low rate of 120 ± 25 μL min−1 was adopted.
Tokyo, Japan) and general tests. In particular, part of the end-product of the irst fermentation was used for the experimental design, where all the parameters to evaluate the in vivo samples were deined.
To help with the identiication of compounds, three fractions of the culture medium were used, one (mf1) from the medium before autoclaving, one (mf2) from the medium right after autoclaving and one (mf3) from the medium autoclaved after the same period of fermentation time, kept under the same conditions of the fermented (under agitation, at 30 °C and with aeration) in a 250 mL lask, simulating the fermenter. All the fractions were subjected to centrifugation and iltration, as described above, for the fermentative liquid.
Biomass measures
The biomass, containing amylaceous material, was suspended in 4 mL of water heated to 50 °C, the tube containing the suspended solid was centrifuged for two minutes at 2500 rpm, the centrifuged liquid was decanted. The puriied biomass was subjected to drying for twelve hours at 60 °C, then going to the desiccator where it stayed for 2 hours until the mass was measured through gravimetry. The biomass was measured on a CP2P balance (Sartorius, Goettingen, Germany), with 0.001 mg precision.
23 Full factorial design with 3 center points of the main
compounds
In order to study the variables that inluence the analysis of organic compounds resulting from the fermentation process in the headspace stage, a full factorial design was performed with eleven fractions of 3 mL of the liquid
fermented by Monascus ruber (aliquots of the 5 day
fermentation inal product). The three factors used, pH, extraction temperature (°C) and extraction time (min), the naturals values are: pH (5.6; 6.5; 7.4), extraction temperature (36.1; 45.0; 53.9) and extraction time (39.1; 45.0; 50.9). The software used to analyze the results of
the designs, and posteriorly the in vivo samples, is the
software R,14 a free software with several useful statistical
packages updated by the oficial website.
In vivo SPME analyses
The liquid part, separated from the fermentation broth
whose purpose was to study the MVOCs through in vivo
SPME, had its pH measured and adjusted to 7.1 ± 0.3 with diluted barium hydroxide or hydrochloric acid (Synth, São Paulo, Brazil). Exactly 3 mL of the liquid were transferred
to 22 mL lasks which then followed for a thermostatic bath, being kept at 36.1 °C with magnetic stirring bar at 180 rpm. Smaller headspace volumes were tested (1/5, 1/3 and 1/2) and no signiicant improvement in response were observed. SPME iber was introduced 5 minutes after the thermostatization of the tube, staying for 51 minutes in contact with the headspace stage. The ibers used are a recoating of PDMS/Car/DVB (Supelco, Bellefonte, USA)
being 50/30 μm thick.15 After the extraction time, the iber
was retracted, being exposed again during the injection in the Shimadzu GC-MS QP2010 Plus equipment, according to the conditions given below. Injector in 250 °C, (split 1:10), detector (MS) in 260 °C, carrier gas low (He)
1.0 mL min−1, column J&W DB5-ms. CG oven: 35 °C
(5 min), 5 °C min−1 until 180 °C, 8 °C min−1 until 250 °C
and 4 min in 250 °C.
The identiication of the compounds was performed by comparing the spectra obtained experimentally with
the data from the NIST library (NIST MS Search 2.0;16
updated in 2014; probability of coincidence of 93-98%) and
through bibliography.17,18 The evaluation of the robustness
of the method was performed according to recommendation of the ICH (International Conference on Harmonisation), studying the variations on the fermentative liquid fractions compared to change of columns (J&W DB5-ms and Restek Rtx®-5MS), temperatures, carrier gas low and the
experimental designs.19
Recovery tests for MVOCs extracted from fermentative liquid
In order to evaluate the recovery of the alcohols extracted from the fermentative liquid, mixtures of the standard of ethanol, 2-methyl-propanol, 3-methyl-butanol, 2-methyl-butanol and 2-phenyl-ethanol were used (GC grade standards; Sigma-Aldrich, St. Louis, USA). The standard were used in three different concentrations (1,
10, 20 μg L−1) and introduced on three 3 mL aliquots of
the autoclaved culture medium, diluted in ratio 1:2; pH was adjusted to 7.0 with diluted barium hydroxide. All the aliquots followed the same procedures of preparation, extraction, injection and analysis used for the samples of the fermentation broth. The autoclaved culture medium aliquots were used because they presented better representativity and similarity with the samples of the fermentation broth and for not presenting interfering signals in the total ion chromatograms, in the standard areas.
Results and Discussion
for the most relevant in comparative terms, according to the main objectives of this study.
Experimental design and statistical analysis
For the experimental designs, aliquots of the inal product of fermentation for ive days (Ferm.01) were used as they signiicantly represent the cumulative of all main MVOCs. For the design, it was chosen the ive compounds directly related to the presence of the fungus and produced by the influence of it (ethanol, 2-methyl-propanol, 3-methyl-butanol, 2-methyl-butanol and 2-phenyl-ethanol). The math of the design for the ive compounds mentioned above is quite extensive, it was performed according to the references using software R, only an excerpt for the 2-methyl-propanol compound will be shown as an
example.20 For the 2-methyl-propanol compound, were
used eleven races: eight for the cubic points (−1 and 1) and three replicas at the midpoint (0). The integrated area values, obtained from the total ion chromatograms, were used as responses to design because they represented the amounts of MVOC compounds present in the headspace of the samples of the fermentative liquid.
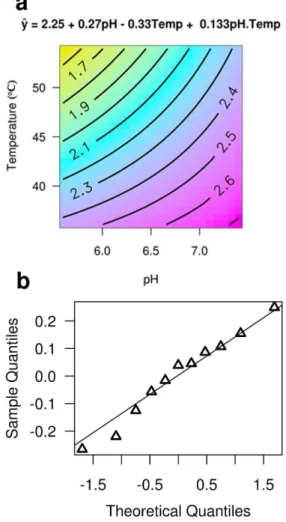
The Figure 1 synthesizes all calculations performed for the 2-methyl-propanol, showing the outlines graph for the statistically signiicant factors (95%), which are the pH and the extraction temperature (a igure containing diagrams
relating temperature versus time and time versus pH is
shown in the Supplementary Information, Figure S1). In order to facilitate the calculation and display, the integrated peak areas, obtained directly from the chromatograms,
were divided by 105 units. Figure 1 also shows the normal
probability plot for the model residue.
The model equation for the coded variables is the following:
Ŷ = 2.25 + 0.27A – 0.33B + 0.13AB (1)
where Ŷ represents the estimated value for the area of the
compound 2-methyl-propanol, which can be related to the total ion chromatograms area used in design, when the levels of the variables pH (A) and extraction temperature (B) vary among −1, 0 and 1, which natural values are: 5.6, 6.5 and 7.4 for pH and 39.1, 45.0 and 50.9 for extraction temperature (°C).
The choice of the signiicant factors was done through testing hypothesis for the level of signiicance of 95%,
the values of t (Student) and Fisher (analysis of variance,
ANOVA) were used to decide for the acceptance of
signiicance (p-value < 0.05). The interaction value of the
pH with the extraction temperature “AB” is not signiicant,
however, the probability value for the Fisher test is of 0.10, this characterizes a non-zero interaction, its value enters the equation to balance the values estimated by the regression equation. The average and the RSD% (relative standard deviation) for the three central point replicas are of
2.21 (105) and 8.99%, respectively. The value of R square
is of 0.87 and the probability value (p-value) of the Fisher
test for lack of it is of 0.70 (> α
0.05); these values show
that the equation can explain 87% of the data variability and has signiicant adjustment. Tests on the residuals of the model show that it is homoscedastic (Breusch-Pagan test), has normal distribution (Shapiro-Wilk, Anderson-Darling and Kolmogorov-Smirnov tests) and are independent
(auto-cross correlation).21,22
are important because they are part of the metabolic pathway
of the alcohols mentioned by Nozzi et al.23 Gathering all
the results, it was possible to conclude that the maximum values for the areas of the metabolic pathway compounds, and ethanol, are obtained when the pH is closer to 7.4, the extraction temperature closer to 36.1 °C and the best time for extraction near to 51.00 minutes. Higher temperatures show a possible interference in the partition and adsorption of the most volatile compounds, as those belonging to the culture media, on the compounds of the metabolic pathway. Therefore, the conditions above were used to analyze all the in vivo samples of all the fermentations, along with the culture media, because they are the best conditions for evaluation of the MVOCs, with the lowest variation possible around the estimated means. Outlines graphs for the 3-methyl-butanol, 2-methyl-butanol and 2-phenyl-ethanol
relating pH versus extraction time, temperature versus pH
and temperature versus extraction time are shown in the
Supplementary Information, Figures S2-S4.
Identification of the compounds VOCs and MVOCs
The three fractions of the culture medium (mf1, mf2 and mf3), mentioned in Preparation of the samples of the fermentation sub-section, were analyzed with the purpose of identifying VOCs belonging to the culture medium only, both before and after fermentation, as the amount and nature of the compounds is not the same after autoclaving and the elapsed time for fermentation. The autoclaving process promotes the breakdown and, the time, degradation and recombination of the compounds of the culture medium under the action of remaining molecules and the characteristic chemical balance. A total of 23 compounds belonging to the culture medium were observed when aggregating all compounds found in the three fractions for each individual fermentation. The coincident compounds found in the sums of the three fractions that represent the culture medium VOCs were identiied as being hexane, ethyl acetate, 3-methyl-butanal, pentanal, toluene, pentanol, hexanal, 2-heptanone, octanal, D-limonene, 2-ethylhexanol, octanol, ethyl heptanoate, nonanal, naphthalene, ethyl caprylate, decanal, undecanal, 2-undecenal, ethyl caprylate, dodecanal, isoamyl benzoate, dodecanol. The identiication of the compounds was performed by comparing the spectra obtained experimentally with the spectra from the database
NIST (NIST MS Search 2.0)16 and SDBS,17 for a probability
of coincidence of 91-98%. Some compounds match those
studied by Ghiasvand et al.24 for the rice using SPME and
a mass spectrometer with light time analyzer.
When analyzed, the samples of the fermented liquid show a total of 42 compounds, including the culture
medium compounds mentioned above. Among the forty-two compounds, 17 of them are not present in the culture medium nor modiied by autoclaving or degraded during the fermentation. These compounds are related directly or indirectly to the presence of the microorganism, either by the presence of enzymes, changes in chemical equilibrium or reactions between secondary products. The distribution of these compounds throughout the different fermentation periods is not exactly the same due to the fact that it is a study in which analytes are produced as a result of
in vivo biochemical structure and its extracellular inluence, this being quite complex. However, it was possible to observe a regular distribution of some compounds, forming different patterns from the culture media compounds. The Table 1 shows the names of the seventeen MVOCs related
to the presence of the Monascus ruber fungus and their
proportions for each of the three fermentations studied, considering the sum of the peak areas for each compound during the total fermentation time. The code refers to the increasing retention time sequence for the compounds and will be used to facilitate discussion.
The probability of coincidence between the spectra of the compounds and the spectra of the database NIST(14) are shown in Table 1, as well as the reference compound number used in the comparison (CAS; chemical abstracts service).
As it can be observed, the cumulative percentage is varied, there are values that do not reach 1%, yet, they are measurable values which are far above the quantiication limit. Naturally, the compounds with the greatest percentage retained are the ones that stay balanced in the fermentation liquid for longer and, because of that, it is possible to distinguish two natural classes of compounds: those that produce accumulations and those that form and dissipate quickly.
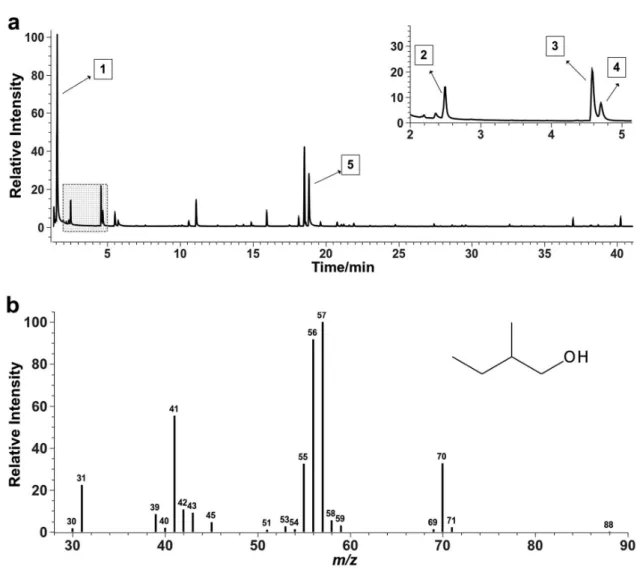
In order to synthesize all the study involved in the MVOCs identification, Figure 2 shows the total ions chromatogram, sampled from the fermentation liquid (headspace), and the mass spectrum of the 2-methyl-butanol compound, obtained experimentally.
Studies of the fragmentations present in the Figure 2b spectrum show that for the 2-methyl-butanol isomer
(C5H10O; CAS: 137-32-6), whose mass is 88.15 g mol−1,
the dehydration mechanism explains the fragment in
m/z 70, the dehydration followed by loss of ethyl radical
(•CH2CH3) explains the fragment in m/z 41 (ion C3H5+) and
the fragment in m/z 57 is explained by the break in alpha
carbon to the oxygen atom, leaving the butyl ion (C4H9+)
Table 1. Names, CAS numbers (% of coincidence), cod and proportions of the MVOCs related to the presence of the Monascus ruber fungus for the three fermentations (cumulative percentage)
Compound CAS (% coincidence) Cod Ferm.01 Ferm.02 Ferm.03
Ethanol 64-17-5 (98) c2 58.9 40.4 46.1
2-Methyl-propanol 78-83-1 (97) c5 7.4 3.4 3.8
3-Methyl-butanol 123-51-3 (96) c8 8.3 7.1 6.7
2-Methyl-butanol 137-32-6 (97) c9 3.0 2.4 3.3
5-Methyl-2-hexanol 111768-09-3 (96) c14 4.0 5.0 2.8
Ethyl caproate 123-66-0 (96) c15 1.6 0.9 0.9
2-Nonanone 821-55-6 (96) c20 0.9 10.9 14.9
2-Nonanol 628-99-9 (96) c22 5.2 13.9 8.4
Phenylethyl alcohol 60-12-8 (98) c24 8.8 13.2 12.0
Diethyl butanedioate 123-25-1 (96) c25 0.7 0.2 0.2
Ethyl laurate 106-33-2 (95) c36 0.1 0.2 0.1
Ethyl 9-tetradecenoate 24880-50-0 (93) c37 0.1 0.1 0.1
Ethyl myristate 124-06-1 (96) c38 0.4 0.8 0.2
Ethyl 9-hexadecenoate 54546-22-4 (93) c39 0.1 0.1 0.1
Ethyl palmitate 628-97-7 (94) c40 0.1 0.1 0.1
Ethyl oleate 111-62-6 (95) c41 0.1 0.1 0.1
Ethyl stearate 111-61-5 (96) c42 0.4 1.1 0.4
Different classes of microbial volatile organic compounds (MVOCs)
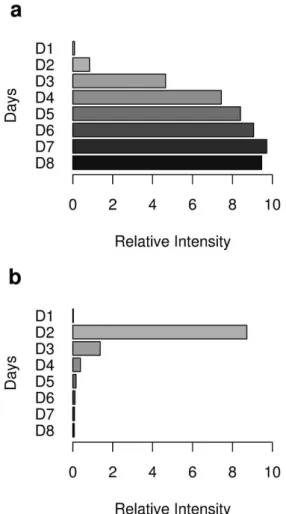
To illustrate these two different classes of compounds (MVOCs), two bar graphs are displayed with the points regarding the fermentation period for the 3-methyl-butanol (Figure 3a) and 2-nonanone (Figure 3b) compounds.
The construction of the graphics was based on the data from the second fermentation (8 days), however, the same proile is observed in the others. Except for the compounds ethanol (c2), 2-methyl-propanol (c5), 3-methyl-butanol (c8), 2-methyl-butanol (c9) and 2-phenyl-ethanol (c24), all the other related to the presence of the fungus (Table 1) present a profile of rapid formation and dissipation, remaining from 2 to 3 days with their highest values, followed by exponential decreasing. The different proiles for these compounds were conirmed using immersed iber, therefore the rapid formation and dissipation is a result of the fermentation process, not of the application of extraction in headspaces.
The compounds forming accumulations throughout the fermentation are: ethanol (c2), 2-methyl-propanol (c5), 3-methyl-butanol (c8), 2-methyl-butanol (c9) and 2-phenyl-ethanol (c24); these are the compounds studied through the designs. For these compounds, due to their regular distribution during fermentation, it is possible to create models or to synthesize the informations from the set of samples through regression study, which may provide important parameters such as experimental error, the variance around the estimated values, in addition to the studies on the residues generated by the differences between actual and set values.
From the alcohols studied by Nozzi et al.,23 four of
them coincide with those found and studied in this work. Since the potential of compounds 2-methyl-propanol (c5), 3-methyl-butanol (c8), 2-methyl-butanol (c9) and 2-phenyl-ethanol (c24) is promising for the study of the relations of synergism and antagonism, in addition to being possible to study them by regression, greater emphasis was given to them, along with ethanol (c2), which comprises the highest
percentage among MVOCs.25
Comparisons between the fermentations
According to the accumulated percentage present in Table 1, it can be observed that the difference between the Ferm.02 and Ferm.03 fermentations, for the ethanol (c2), 2-methyl-propanol (c5), 3-methyl-butanol (c8) and 2-phenyl-ethanol (c24), compounds, are lower than the differences between Ferm.01 and Ferm.03. This happens because the production of ethanol and superior alcohols decreases considerably during the stage of cellular death,
which occurs after eight days.24 The decrease of the amount
of alcohol due to cellular death can be observed in Figure 3a, for the 3-methyl-butanol alcohol, the bar corresponding to the eighth day (D8) is smaller than the bar corresponding to the seventh day (D7), in other words, from eight days on the cellular death increases and the amount of the main alcohols decreases considerably, reaching very low levels in ten days, which is noticeable in the fermentation of ten days (Ferm.03).
Applying the model and obtaining the maximum values for the MVOCs
Taken into consideration that after the period of cellular death, the main alcohols are no longer produced, because live cells are required to produce them, only eight days of the fermentation Ferm.03 were considered for comparisons with the eight days of the fermentation Ferm.02. To evaluate all the values obtained during the eight days of fermentation Ferm.02 and the eight days of Ferm.03, removing the last Figure 3. Bar graphs with the points regarding the fermentation period
two days of the latter as it showed high cellular death, a study of regression of values was conducted, which, in this case, are integrated peak area values directly from the total ion chromatograms (TIC); in order to facilitate graphic representation, the areas were divided by a
hundred thousand (105). The adopted regression model
was the loess (local polynomial regression itting),26 due
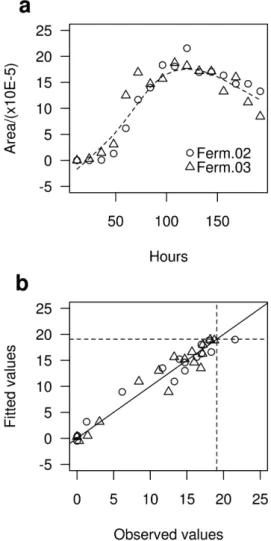
to its higher adjustment to the experimental data, the same kind of model was applied to the ive main alcohols mentioned before, individually. The curves resulting from loess regression have the same proile for all ive alcohols, therefore, only one example was presented with more details for the 2-methyl-butanol (c9) alcohol (Figure 4a). These curves describe the closest natural proile, taking into consideration all the area data obtained with sixteen points (192 hours), corresponding to the 8 day periods studied for the last two fermentations.
The curve given as an example comes from local polynomial regression between two data pairs, the points
of Ferm.02 and Ferm.03, taken every twelve hours for eight days (192 hours). The arguments used to obtain the best adjustment for the values were: span = 0.5, degree = 2, family = gaussian. The span argument refers to the smoothing parameter, or the neighborhood size control, the degree argument refers to the degree of the local polynomial and the family argument refers to the weight function. The loess regression provided an R squared value of 0.945 (94.5%) and a standard regression error (residual standard error) of 1.929 for the 2-methyl-butanol compound, this result was enough to safely estimate a maximum value between two different fermentations (Ferm.02 and Ferm.03), which would not be possible by averaging the two maximum area values (peaks) observed experimentally in each fermentation. Considering the results provided by regression it is possible to see that the conidence interval value for the estimate (± 2 × 1.929) is of 3.858, this value shows a good adjustment for the estimated values because it is higher than the maximum and minimum amounts of residuals (max = 3.565; min = −2.759) that were found for this regression, all other residuals values lie between the maximum (3.565) and the minimum (−2.759). The level of similarity between the observed and estimated values can be seen in Figure 4b, at the intersection of the two dotted lines is the maximum value estimated by regression (19.06), on the continuous line are the values where the residue is zero; many values close to the maximum estimated have low residual value, indicating that the similarity between the estimated and observed values is quite signiicant. All tests for homoscedasticity and normality for residuals were performed in the same way as for models of the experimental design.
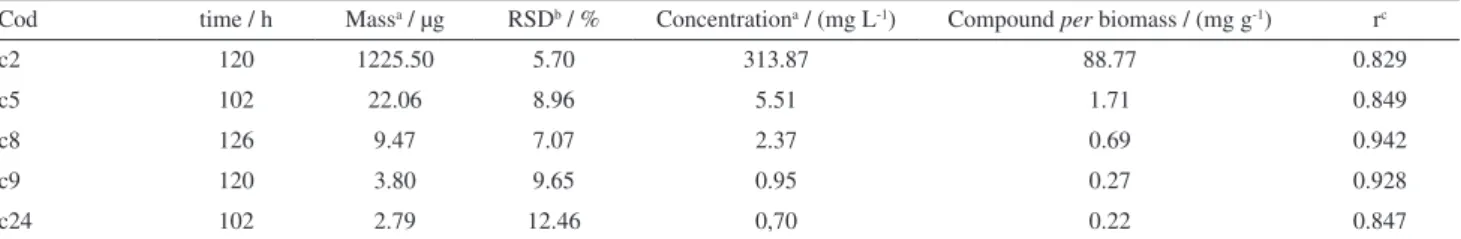
The same procedure used to obtain the maximum value for the 2-methyl-butanol was performed for the other alcohols (MVOCs), the maximum values estimated with loess regression represent the maximum values that can be achieved by the alcohols considering the two fermentations conducted simultaneously. As they have been used in the calculations of the areas of the alcohols, obtained directly from the total ion chromatograms, the maximum estimated values were transformed into concentration values through the use of a calibration curve. The Table 2 below shows maximum values and periods, in hours, to reach them. It
can also be seen the amount values of each compound per
biomass gram, at the same maximum points, and Pearson’s correlation coeficient between the amounts of compound and biomass for the average the fermentation (Ferm.02 and Ferm.03).
Although it is possible to perform regression between biomass and the amount of alcohol, the ANOVA test
provides a continuous p-value (not categorical), it does not
provide an idea of how far the correlation is (the degree); Figure 4. Trend curve from a loessregression, for the 2-methyl-butanol
on the other hand, Pearson’s coeficient shows a ratio of the correlation (between 0 and 1), it is most illustrative in terms of relative force between variables (it shows the degree of the relation), if equal to 1 the relation is completely linear. Citations can be found in the literature regarding force (r > 0.80 strong correlation), showing that Pearson’s coeficient can be more interesting for comparisons.
The maximum values (in area) are obtained from the loess regression using the predict (interpolation) function in software R. The amount value of each compound (in concentration; Table 2) was obtained by interpolation of the maximum values in the calibration curve for the alcohols (ethanol, propanol, 3-methyl-butanol, 2-methyl-butanol and 2-phenyl-ethanol), using the GC standard Sigma-Aldrich (St. Louis, USA), all with R squared upper
0.998. The LOD (μg L−1), LOQ (μg L−1) and range (μg L−1)
of the calibration curve for the alcohols are: 0.53, 0.13, 0.06, 0.05, 0.01; 1.64, 0.40, 0.18, 0.17, 0.03; 20-400, 1-25, 1-25, 0.5-10, 0.5-10 for the alcohols ethanol, 2-methyl-propanol, 3-methyl-butanol, 2-methyl-butanol and 2-phenyl-ethanol, respectively.
The recovery values were quite satisfactory, according to the recovery tests, providing average values of 91.4, 89.9, 89.0, 78.9 and 92.8% for the ethanol, 2-methyl-propanol, 3-methyl-butanol, 2-methyl-butanol and 2-phenyl-ethanol alcohols, respectively. The accuracy of the analysis method (RSD%) were of 13.1, 12.1, 12.6, 10.6 and 9.5%, respectively.
The values for Pearson’s correlation coeficient were
subjected to the t-test (Student), all show significant
values for a signiicance level of 95%. Thus, it is possible to accept that there is a positive correlation between the amount produced by the ive compounds studied with the production of biomass. Therefore, an increase in cell production causes an increase in the amounts of compounds which produce accumulations. The ones that do not produce it, have no direct relationship with biomass, despite being related to the presence of the fungus.
Studies performed by Mejías et al.,27 using SPME,
showed that repeatability for the 2-methyl-propanol and
3-methyl-butanol alcohols provides a RSD% of 12.15 and
9.37%, respectively. Marín et al.28 determined a RSD%
of 11.9, 8.4, 10.2 and 13.7% for the alcohols 2-methyl-propanol, 2-methyl-butanol, 3-methyl-butanol and 2-phenyl-ethanol, respectively, when using SPME. Both studies were performed with vinegar samples and Car-PDMS ibers. In this work, RSD% for ethanol, 2-methyl-propanol, 3-methyl-butanol, 2-methyl-butanol and 2-phenyl-ethanol were of 5.7, 9.0, 7.1, 9.7 and 12.5, respectively, as showed in Table 2. It can be stated that the values found here are close to the values of the two references mentioned and they show the same repeatability; these values are normally expected for SPME extraction of patterns that are between 5 and 15% of RSD% for these alcohols.
Performance of the fermentations
For comparative issues, the amounts of biomass and
red pigment (monascorubramine; C23H27NO4), at the end
of fermentation, were measured according to the methods
employed by Meinicke et al.13 The values obtained
for the last fermentation for these parameters were of
4.03 ± 0.21 g L−1 and 3.96 ± 0.17 UA
480 (optical density
units; 480 nm), respectively. These are satisfactory values for fermentation, considering the type of culture medium low enriched as the rice powder. Similar results for the
relation between pigment (UA480) and biomass were
reported by Meinicke et al.13 in culture mediums that have
more nutrients, which shows the high performance of the
Monascus fungus when in submerged cultivation, even in poor nutrient media.
Conclusions
It is observed that, to estimate the maximum values of all compounds from a fermentation, discrete but continuous actions are required during the process of microbial growth and pigment formation. Several compounds do not form signiicant accumulations during the process and even the ones that remain stable regarding the balance in Table 2. Maximum (μg) and periods values, values of each compound per biomass gram; Pearson’s correlation coeficient between the amounts of compound and biomass (sixteen points)
Cod time / h Massa / μg RSDb / % Concentrationa / (mg L-1) Compound per biomass / (mg g-1) rc
c2 120 1225.50 5.70 313.87 88.77 0.829
c5 102 22.06 8.96 5.51 1.71 0.849
c8 126 9.47 7.07 2.37 0.69 0.942
c9 120 3.80 9.65 0.95 0.27 0.928
c24 102 2.79 12.46 0,70 0.22 0.847
solution require elaborate studies about their distributions or proiles.
The use of a method involving SPME is essential to obtain results with greater reliability when evaluating the
proiles of MVOCs (in vivo) during a fermentation process.
In the case of compounds related to the pathway of alcohols, it was possible to obtain maximum values and experimental errors through the use of SPME combined with the use of regression models which allow to evaluate all the statistical parameters of a data set.
The use of the results found for the MVOCs was of great importance for predicting subsequent fermentations, several changes in the parameters of a fermentation, such as the oxygenation of the fermenter and the changes in the nutrients of the culture medium, can be studied by observing and measuring the MVOCs, without the use of sophisticated sensors and with little waste of the fermentation liquid.
One can also accept a relation of the compounds that produce accumulations with biomass and realize that this is a legitimate relationship, which can be established with the use of SPME in a headspace stage. The performance of the method allowed to obtain models with low values for experimental error, showing that there is similarity between two separate fermentations. It is also clear the importance of experimental design, especially when there are compounds with varying and distinct percentages from each other.
Supplementary Information
Supplementary data are available free of charge at http://jbcs.sbq.org.br as PDF ile.
Acknowledgments
The authors wish to thank the National Council for Scientiic and Technological Development (CNPq) for inancial support (process number 143378/2011-2).
References
1. Gashlan, H. M.; Sci. Res. Essays2009, 4, 69.
2. Venkataramanan, K. P.; Kurniawan, Y.; Boatman, J. J.; Haynes, C. H.; Taconi, K. A.; Martin, L.; Bothun, G. D.; Scholz, C.;
J. Biotechnol.2014, 179, 8.
3. Vendruscolo, F.; Schmidell, W.; Moritz, D. E.; Bühler, R. M. M.; Oliveira, D.; Ninow, J. L.; Biocatal. Agric. Biotechnol. 2016,
5, 179.
4. Sharmila, G.; Nidhi, B.; Muthukumaran, C.; Ind. Crops Prod. 2013, 44, 158.
5. Brunetti, A. E.; Merib, J.; Carasek, E.; Caramão, E. B.; Barbará, J.; Zini, C. A.; Faivovich, J.; J. Chem. Ecol. 2015, 41, 360.
6. Hossian, S. M. Z.; Bojko, B.; Pawliszyn, J.; Anal. Chim. Acta 2013, 776, 41.
7. Dias, A. N.; Simão, V.; Merib, J.; Carasek, E.; Talanta 2015,
134, 409.
8. Cudjoe, E.; Bojko, B.; Lannoy, I.; Saldivia, V.; Pawliszyn, J.;
Angew. Chem., Int. Ed. 2013, 52, 12124.
9. Cheng, M. J.; Wu, M. D.; Yuan, G. F.; Su, Y. S.; Yanai, H.;
Phytochem. Lett. 2012, 5, 567.
10. Lavine, B. K.; Mirjankar, N.; LeBouf, R.; Rossner, A.;
Microchem. J. 2012, 103, 37.
11. Burin, V. M.; Marchand, S.; Revel, G.; Luiz, M. T. B.; Talanta 2013, 117, 87.
12. Vendruscolo, F.; Müller, B. L.; Moritz, D. E.; Oliveira, D.; Schmidell, W.; Ninow, J. L.; Biocatal. Agric. Biotechnol.2013,
2, 278.
13. Meinicke, R. M.; Vendruscolo, F.; Moritz, D. E.; Oliveira, D.; Schmidell, W.; Samohyl, R. W.; Ninow, J. L.; Biocatal. Agric. Biotechnol.2012, 1, 238.
14. R Core Team; R: A Language and Environment for Statistical Computing; R Foundation for Statistical Computing, Vienna, Austria, 2015.
15. Matysik, S.; Herbarth, O.; Mueller, A.; Chemosphere 2009, 76, 114.
16. Stein, S.; Mirokhin, Y.; Tchekhovskoi, D.; Mallard, G.; NIST MS Search 2.0; National Institute of Standards and Technology, Gaithersburg, United States of America, 2008.
17. http://sdbs.db.aist.go.jp, accessed in September 2016. 18. Babushok, V. I.; Trends Anal. Chem. 2015, 69, 98.
19. Paschoal, J. A. R.; Rath, S.; Airoldi, F. P. S.; Reyes, F. G. R.;
Quim. Nova 2008, 31, 1190.
20. Hibbert, D. B.; J. Chromatogr. B 2012, 910, 2.
21. Liu, G. G.; Wu, H.; Li, M.; Gao, C.; Luo, N.; Value Health 2014, 17, 597.
22. Ruxton, G. D.; Wilkinson, D. M.; Neuhäuser, M.; Anim. Behav. 2015, 107, 249.
23. Nozzi, N. E.; Desai, S. H.; Case, A. E.; Atsumi, S.; Metab. Eng. 2014, 25, 174.
24. Ghiasvand, A. R.; Setkova, L.; Pawliszyn, J.; Flavour Fragrance J. 2007, 22, 377.
25. Verginer, M.; Leitner, E.; Berg, G.; J. Agric. Food Chem.2010,
58, 8344.
26. Walsh, J.; Climstein, M.; Heazlewood, I. T.; Burke, S.; Kettunen, J.; Adams, K.; DeBeliso, M.; Int. J. Biol. Med. Sci. 2011, 1, 33. 27. Mejías, R. C.; Marín, R. N.; Moreno, M. V. G.; Barroso, C. G.;
J. Chromatogr. A 2002, 953, 7.
28. Marín, R. N.; Mejías, R. C.; Moreno, M. V. G.; Rowe, F. G.; Barroso, C. G.; J. Chromatogr. A 2002, 967, 261.
Submitted: August 10, 2016