AGE AND GROWTH OF THE KING MACKEREL (SCOMBEROMORUS CAVALLA)
OFF THE NORTHEASTERN COAST OF BRAZIL
Marcelo Francisco de Nóbrega1,2 and Rosangela Paula Lessa1, 2
1
Universidade Federal Rural de Pernambuco – Departamento de Pesca Laboratório de Dinâmica de Populações Marinhas (DIMAR)
(Av. Prof. Dom Manuel Medeiros s/n, Dois Irmãos, 52171-900 Recife, PE, Brasil) e-mail: [email protected]
2
Universidade Federal de Pernambuco - Departamento de Zoologia Programa de Pós-graduação em Biologia Animal
(Av. Prof. Moraes Rego, 1235, Cidade Universitária, 50670-420 Recife, PE, Brasil)
A
BSTRACTAge and growth of the king mackerel (Scomberomorus cavalla) were estimated for northeastern Brazil. A total of 405 sagittal otoliths from 140 males (24.4-112 cm), 73 females (28-114.8 cm) and 193 specimens of unknown sex (11.5-121 cm) were examined. Marginal increment analysis indicated an annual pattern for growth band deposition. The age classes ranged from 1 to 15 years. Length ranged from 11.5 to 121 cm. The Schnute model indicated that the von Bertalanffy growth model demonstrated the best adjustment, with p=1/b, and was therefore used for estimating growth. Back-calculated curves had smaller variances,giving the following estimated growth parameters for males:
L∞= 116.8 cm, K = 0.190, t0 = 0.377; and females: L∞= 132.7 cm, K = 0.159 and t0 = 0.387. In order to
compare the curves for males and females, the overlapping of 95% confidence intervals was performed for the parameters generated from the von Bertalanffy non-linear least square method. Specimens between 3 and 8 years of age represented 82.2% (n=5,783) of the catch composition, characterizing the species as a catchable stock in the region.
R
ESUMOA idade e o crescimento da King mackerel (Scomberomorus cavalla) foram estimados na região nordeste do Brasil. Foram analisados 405 otólitos sagita, sendo 140 machos (24,4-112 cm), 73 fêmeas (28-114,8 cm) e 193 exemplares com sexo indeterminado (11,5-121 cm). A análise do incremento marginal indicou um padrão anual na deposição das bandas de crescimento. As classes de idade variaram entre 1 e 15 anos e os comprimentos de 11,5 a 121 cm. O modelo de Schnute indicou que o melhor ajuste é apresentado pelo modelo de von Bertalanffy com p=1/b, sendo, então, utilizado para as estimativas de crescimento. As curvas retrocalculadas apresentaram as menores variâncias e os parâmetros de crescimento foram estimados para machos: L∞ = 116,8 cm, K = 0,190, t0 = 0,37;
para fêmeas: L∞= 132,7 cm, K = 0,159 e t0 = 0,387. Para comparação das curvas de machos e fêmeas,
foram construídas regiões de confiança de 95% para os parâmetros gerados pelo método de mínimos quadrados não linear de von Bertalanffy. Exemplares entre 3 e 8 anos representaram 82,2% (n=5,783) da composição das capturas, caracterizando assim, o estoque capturável da espécie na região.
Descriptors: Scomberomorus cavalla; King mackerel; Age and growth. Descritores: Scomberomorus cavalla; cavala; Idade e crescimento.
I
NTRODUCTIONIn a recent sampling program of landings from artisanal fisheries in northeastern Brazil, the king mackerel (Scomberomorus cavalla, Cuvier, 1829) accounted for 8.6% of the total recorded weight (LESSA, 2006), representing the fourth largest regional fishing resource in terms of economic importance (NÓBREGA; LESSA, 2007). The species occurs from the Atlantic coast of Massachusetts (USA) down to Rio de Janeiro (Brazil) (COLLETE; NAUEN, 1983), living in the epipelagic zone, mainly over the continental shelf.
From 1950 to 2004 (Fig. 1), catches of S.
cavalla in its area of distribution rose from 4,743 t to
(FINUCANE et al., 1986; COLLINS et al., 1989; Gold et al., 2002).
The economic importance of the king mackerel in its area of distribution has led to a large number of studies onits growth, the identification of stock units (BEAUMARIAGE, 1973: XIMENES et al., 1978; JOHNSON et al., 1983; MANOOCH et al. 1987; COLLINS et al., 1989; STURM; SALTER,
1990; ARREGUÍN-SÁNCHEZ et al., 1995;
DEVRIES; GRIMES, 1997; DEVRIES et al., 2002), reproduction (IVO, 1972; BEAUMARIAGE, 1973; GESTEIRA; MESQUITA, 1976; FINUCANE et al., 1986; STURM; SALTER, 1990), mortality rates and exploitation status (FONTELES-FILHO, 1988; JOHNSON et al., 1983; AGUILAR-SALAZAR, 1991; ARREGUÍN-SANCHEZ et al., 1995; LESSA et al., 2004).
In northeastern Brazil, S. cavalla is exploited especially by the artisanal fleet, betweenthe20 and 200 m isobaths, catches undertaken with surface lines predominating (90.8%) and, in a lesser proportion, those with gillnets (9.2%), with the largest volumes being landed between January and April (LESSA, 2006). Lessa et al. (2004) assessed the exploitation status of the stock and estimated a mean annual biomass of 12,742 t for a mean yield of 3,307 t/year, indicating that, despite being underexploited, the stock is near its maximal exploitation limit.
Age determination by means of growth bands is the most valuable means of obtaining the information used in virtual analyses of populations and catch curves (HILBORN; WALTERS, 1992). These estimates permit the adoption of management policies
and promote sustainable stock exploitation
(LONGHURST; PAULY, 1987). The growth
parameters of a species may present different values in distinct parts of its area of occurrence (SPARRE; VENEMA, 1997).
The production of a fish stock (discounting immigration and emigration) is a mixture of the recruitment of new specimens to the population and individual growth. Thus, there is a large volume of literature that addresses individual growth in the ecology of fisheries (HADDON, 2001). Regarding this literature, a number of models involve growth curve estimates based on age and length data, such as the Putter, von Bertalanffy, Richards, Gompertz, logistic, linear, quadratic and exponential models RICKER, 1975). Besides this diversity of models, others, such as those proposed by Walford (1946), Fabens (1965) and Allen (1966), are generally used to estimate von Bertalanffy growth parameters (SCHNUTE, 1981).
In the present study, we use the Schnute growth model (1981) to estimate four parameters, the parametric properties of which allowthe systematic selection ofan appropriate growth model for data on the age (readings of rings in whole otoliths) and size of
S. cavalla specimens caught off northeastern Brazil.
Through the model indicated as the most appropriate, we establish growth curves (for separate and combined sexes) and the age structure of the species, thereby contributing essential information (growth parameters) for future assessments of exploitation levels and sustainable catch rates for this important fishery resource in the region.
Fig. 1. Weight of S. cavalla landed between 1950 and 2004 throughout entire area of distribution and off northeastern Brazil between 1976 and 2004.
0 2000 4000 6000 8000 10000 12000 14000 16000 18000
1950 1953 1956 1959 1962 1965 1968 1971 1974 1977 1980 1983 1986 1989 1992 1995 1998 2001 2004
Year
C
a
tc
h
(
t)
All Countries
M
ATERIALS ANDM
ETHODS SamplingOn the basis of daily samplings, the length (FL, cm) and weight (TW, g) of 7,019 specimens of S.
cavalla caught with hand-lines and nets by the
artisanal fleet, between January 1998 and April 2001, and landed in northeastern Brazil, were recorded. The fishing areas had depths of 4 to 216 m (mean=63.2 m; SD=31.5 m), with the distance from shore ranging from 1.37 to 68.65 Km (mean=22.2 Km; SD=14.6 Km) (Fig. 2). Inthe monthly samplings, otoliths were collected from 481 specimens; gonads were analyzed for the determination of gender.
Age determination
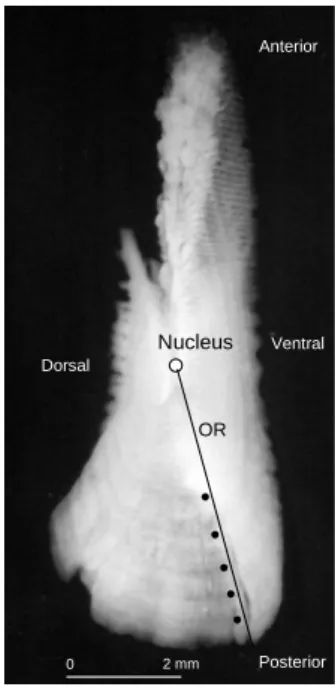
The right otolith of each pair was examined whole in vegetable oil on a black background under transmitted light. Otoliths were classified into age groups based on the number of translucent bands. Distances from the nucleus to the edge (otolith radius - OR) and between translucent bands were measured (Fig. 3) with a stereoscopic microscope equipped with ocular micrometer at 10x magnification (1 micrometer unit = 1 mm). The otoliths were examined by two
different readers with no previous knowledge of the individual’s size or the other reading. Inter-examiner agreement on the age of whole otoliths was calculated using the average percentage error (1) described by Beamish and Fournier (1981). Marginal increment analysis was performed to determine the periodicity of growth band formation, using the equation (2) proposed by Cadvallader (1978):
(
)
∑
∑
−= 1 1 Xij XjXj .100
R N
APE (1)
in which N = the number of fish aged; R = the number of readings;
ij
X = the mean age of th
j fish at the
th
i reading; and
j
X = the mean age calculated for the
th
j fish, and
100 . 1 − − = − n n n r r r OR
PMI (2)
in which, OR = otolith radius; rn = distance between
otolith nucleus and the last band; and rn-1 = distance
between otolith nucleus and the penultimate band.
# # # # # # # # # # # # # # # # # # # ## # # # # # # # # # # # # # # # # # # # # # # # # # # # # # # # # # # # # # # # ## # # # # # # # # # # # # # # # # # # # # # # # # # # # # ## # # # # # # # # ### ## # # # # # # # # # ##### # # # # # # # # # # # # ## # # # # # # # # # # # # # # # # # # # # # # # # # # # # # # # # # # # # # # # ### ## # # # # # # # # # # # # ## ## # # # # # # # # # # # # # # # # # # # # # # # # # # # ### # # # # # # # # # # # ## # # # # # # ## # # ## # # # # # # # # # # # # # # # # # # # # # # # # # # # # # # # # # # # # # # # # # # # # # # # # # # # # # # # # # # # # # # # # # # # # # # # # # # # # # # # ## # # # # # ## # # # # # # # # # # # # # # ## # # # # # # # # # # ## # # # # # # # # # # # # #### # # # ## # # # # # # # # # # # # # # # # ## # # # # # ## # # # # # # # # # # # # # # # # # # # # # # # # # # # # # # # # # # # # # # # # # # # ## # # # # # # # # # ### # # # ## # # # # # # # #### # # # # # # # ## # # # # # # # # # # # ## # # # # # # # # # # ## # # ### # # # # # ### ## # # # # ###### # # # Fortaleza Recife Maceió Arembepe Camocim Caiçara do Norte Baia Formosa Tamandaré Rio Grande do Norte Pernambuco Alagoas Ceará Bahia # N E W S 13° 13° 12° 12° 11° 11° 10° 10° 9° 9° 8° 8° 7° 7° 6° 6° 5° 5° 4° 4° 3° 3° 2° 2° 44° 44° 43° 43° 42° 42° 41° 41° 40° 40° 39° 39° 38° 38° 37° 37° 36° 36° 35° 35° 34° 34° 33° 33°
Fig. 3. Characteristics of whole otoliths from king mackerel observed under transmitted light for age determination. Male specimen, five years of age, measuring 63 cm FL (OR = otolith radius; = translucent bands).
To determine whether the periodicity of the bands reveals a similar pattern between adults and juveniles, marginal increment analysis was made separately for groups with 1 to 4 bands (juveniles) and 5 to 15 bands (adults), using the maturity scale proposed by Gesteira and Mesquita (1976). Marginal increment analyses for juveniles and adults were tested with one-way fixed-effects analysis of variance (α=0.05). Tukey´s studentized range (HSD) test was used for a posteriori comparisons (α=0.05).
Backcalculation
Linear and multiplicative correlations between OR and FL were calculated for males, females and combined sexes, determining the adjustment to normal distribution compared by analysis of variance. The residual dispersion diagram, determination coefficient and F value (Fisher) were used to find the regression model best adjusted to the data. Analysis of covariance (α=0.05) was applied to compare correlations between the OR and FL of males and females.
Measurements of the distance between the otolith nucleus and the lastband were back-calculated using the Monastyrsky equation (3) for the body proportionality hypothesis (BPH) (FRANCIS, 1990).
Mean backcalculated and observed lengths were compared and subsequently tested by analysis of covariance (α=0.05) in order to determine whether there were differences between these two methods as well as to validate the growth marks in the otoliths.
(
)
cb c i
i S S L
L = / . (3)
in which Li = the back-calculated length at last age; Si
= otolith radius at the time of the last band; Sc = the
otolith radius at capture; Lc = the length at capture; and
b = the slope coefficient of the relationship between
OR and FL (multiplicative relationship for combined sexes).
Estimation of Growth Parameters
In order to determine which growth model had the best adjustment to lengths and ages of males, females and combined sexes, the growth equation formulated by Schnute (1981) was employed, using the nonlinear least squares methods (4). Relative growth rates z1 and z2 were also calculated (5 and 6), in
accordance with the same author.
(
)
( )( )
b a
t a b b b t
e e y y y L
/ 1
1 2
1 2 1
1
1 1
− − − +
= −−τ−−ττ (4)
b a
a
a b b
y
a
e
e
e
b
y
y
z
1 1
2 1
).
/
)
((
).
/
)
((
1 2
1
τ τ
τ
− −
−
−
−
=
(5)b a
a
a b b
y a e e
e b y y z
2 1
2 2
). / ) ((
). / ) ((
1 2
2
τ τ
τ
− −
−
− −
= (6)
in which Lt ispredicted length at age t;
τ
1 = firstspecified age;
2
τ
= second specified age; a = constant relative rate of relative growth rate; b = incremental relative rate of relative growth rate; y1= size at ageτ
1,2
y = size at age
τ
2; z1 = relative growth rate at age1
τ
; z2 = relative growth rate at ageτ
2.Growth parameters were also calculated for separate and combined sexes, using the von Bertalanffy equation, with p=1/b (7), with individual observed lengths and back-calculated lengths to the last band of each specimen (Francis, 1990). The method with the best adjustment to the data (direct and back-calculated) was chosen based on the comparison of variances and adjustments of the residuals to normal distribution.
Nucleus
OR
0 2 mm Posterior
Ventral Anterior
Dorsal
Nucleus
OR
0 2 mm Posterior
Ventral Anterior
( )
(
ktt)
bt L e
L 1 − −0 1/
∞ −
=
(7)
in which Lt ispredicted length at age t; L∞ = mean
asymptotic fork length; K = growth rate constant; t0 =
the age when length is theoretically zero; b = incremental relative rate of relative growth rate.
Data Analysis
Growth parameters for back-calculated lengths of males and females were compared by the overlapping of 95% confidence intervals, using the bi-dimensional normal distribution model described by Kimura (1980) and Cerrato (1990). In order to compare estimated growth parameters of males and females, Hotelling’s T2 test (CERRATO, 1990) was applied (8) and its graphic representation was demonstrated using overlapping 95% confidence intervals for differences between the vectors of parameters L∞ and K.
= ∞
K L
female
θ and
= ∞
K L
male
θ (8)
male female θ
θ
δ= − H0:δ=0 H1=δ≠0
The
φ
parameter (PAULY; MUNRO,1984) – which expresses growth performance and allows the determination of how environmental and latitudinal differences cause changes in growth rates (K) and, consequently, changes in asymptotic length (L∞) for a given species – was estimated (9) for the growth parameters (von Bertalanffy) established in the present study for males, females and combined sexes. The estimated parameters within the same area and other areas of S. cavalla distribution were then compared. The adjustment to normal distribution of the frequencies of the
φ
parameter for the differentareas of occurrences was tested using the Kolmogorov-Smirnov test (α=0.05).
∞
+
=log10K 2log10L
φ
(9)A distribution of age structure for the entire sample was established. The inverted von Bertalanffy growth curve was used to estimate the longevity of S.
cavalla in northeastern Brazil.
R
ESULTS Length FrequencyLength ranged from 11.5 to 136 cm FL for the entire sample (n=7,019) (mean=73.8 cm; SD=18.13 cm). The smallest specimens occurred in February, April, June and August, whereas the largest occurred in August and September (Fig. 4). Female and male lengths ranged from 28 to 127 cm (mean=63.9 cm; SD=23.9 cm) and 24.4 to 126 cm (mean=66.9 cm; SD=21.18), respectively. There was no significant difference between males and females regarding length (ANOVA; P=0.28) (Fig. 5).
Age Determination
A total of 84.2% (n=405) of the collected otoliths (n=481) were used for the growth study, as 76 otoliths were broken and not suitable for measurements or band counts. Of the 405 otoliths used, 140 were male (24.4-112 cm), 73 female (28-114.8 cm) and 193 specimens were of undetermined sex (11.5-121 cm).
The number of translucent bands in the otoliths ranged from 1 to 15, with size estimates ranging from 11.5 to 121 cm FL. The average percentage error between the two readers ranged from 0% to 15.9% on 1 to 15 bands, with an APE of 8.96% for the entire sample.
Fig. 5. Frequency distribution of male and female lengths of king mackerel off northeastern Brazil
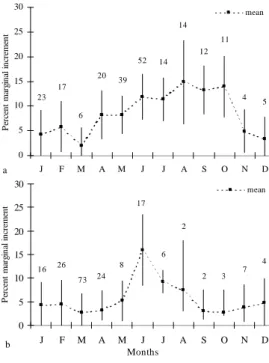
The relative marginal increment for the juvenile group had the smallest values from November to March (Fig. 6a), suggesting the formation of translucent bands in this period. There was a significant difference in mean increments throughout the year (P<0.05) and the post-hoc test indicated significant differences in November, December, January, February and March in relation to the other months. Marginal increment for the adult group had the smallest values between September and April (Fig. 6b), also with significant differences in monthly means (P<0.05); the post-hoc test demonstrated that the monthly means of June, July and August were statistically different from those of the remaining months. Based on these results, an annual pattern extending from September to April was considered for the deposition of growth bands in the region.
Backcalculation
Correlations between OR and FL
demonstrated the best adjustments to the
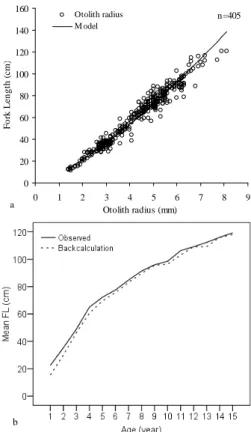
multiplicative regression model (Table 1 - Fig. 7a). There were no significant gender differences in OR and FL correlations (ANCOVA; P=0.10). Mean observed and backcalculated lengths for the ages exhibited similarities (Fig. 7b), with no significant differences (ANCOVA; P=0.13). These findings indicate that the bands interpreted on the otoliths may be used to estimate growth and establish the age structure of the S. cavalla caught off northeastern Brazil.
Fig. 6. Relative marginal increment with minimal, maximal and mean values (+ standard error) for young specimens (a) and adults (b) of S. cavalla off northeastern Brazil.
Table 1. Linear and multiplicative relationship between otolith radius (OR) and fork length (FL) for sexes both separately and combined, tested through ANOVA.
Sex Model Relationship n F P r2
Female Linear FL=17.604OR-16.312 73 1,121 P<0.01 0.940
Male Linear FL=17.755OR-15.945 140 2,921 P<0.01 0.954
Combined Linear FL=17.688OR-15.442 405 10,744 P<0.01 0.964 Female Multiplicative FL=8.8329OR1.2923 73 1,222 P<0.01 0.945
Male Multiplicative FL=8.7813OR1.3086 140 3,437 P<0.01 0.961
Combined Multiplicative FL=8.3421OR1.3434 405 13,181 P<0.01 0.970 0
2 4 6 8 10 12 14
20 30 40 50 60 70 80 90 100 110 120 130
Fork lenth (cm)
F
re
q
u
e
n
c
y
(
%
)
Male n = 714 Female n = 225
0 5 10 15 20 25 30
J F M A M J J A S O N D
P
er
ce
n
t
m
ar
gi
n
al
i
n
cr
em
en
t
mean
23 17
6 20
39 52 14
14
12 11
4 5
a
0 5 10 15 20 25 30
J F M A M J J A S O N D
Months
P
er
ce
n
t
m
ar
gi
n
al
i
n
cr
em
en
t
mean
16 26 73 24
8 17
6 2
2 3 7 4
Fig. 7. Relationship between OR and FL (combined sexes) showing adjusted multiplicative model (a); mean observed and backcalculated lengths (b) for S. cavala at different catch ages (combined sexes).
Growth Parameters
Absolute ages were calculated taking January as the month when the species changes its age.
The growth model proposed by Schnute (1981) estimated values of a > 0 and b > 1 for separated and combined sexes in the northeastern region (Table 2), which indicates that the most suitable model for describing the growth of the species is that of von Bertalanffy, specialized with p=1/b. Moreover, growth rates (z1, z2) for τ1 and τ2 exhibited wide variation, indicating an extremely high increase in the ages established for τ1 and very low increase for older specimens (τ2), with a being an estimate of relative constant growth rate (Table 2).
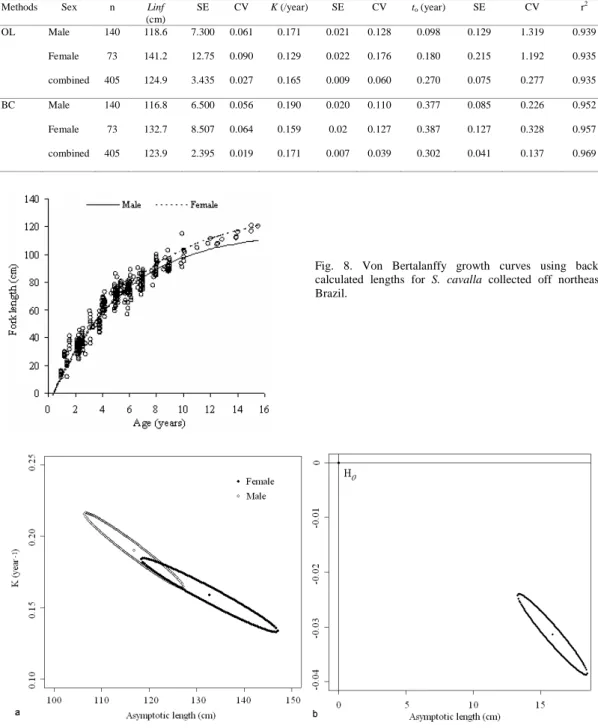
Growth curves established for combined and separate sexes demonstrate that the estimates generated for back-calculated lengths obtained higher determination coefficients, lower variances and better adjustments of the residuals to normal distribution, whether using the Schnute model (Table 2) or the von Bertalanffy equation (Table 3).Thelatter method was, therefore, used to describe the growth of S. cavalla in northeastern Brazil. Growth parameters estimated for males (Table 3) indicated a higher growth rate compared to females and exhibited a smaller L∞(Fig.
8), whereas females had a higher L∞ (Table 3).
Data Analysis
The overlapping of confidence intervals for males and females indicate no significant differences between these curves (Fig. 9a). These confidence intervals provide a measure for the variability of estimated parameters through the von Bertalanffy nonlinear least squares method, generating the following estimates of intervals for females: L∞ (118.33 - 147.06 cm) - K (0.133 - 0.183 year-1) and for males: L∞ (106.39 - 127.20 cm) - K (0.164 - 0.215 year-1).
Table 2. Growth parameters calculated from observed lengths (OL) and back-calculated (BC) lengths, using Schnute model (1981). τ1 = first specified age; τ2 = second specified age; a = constant relative rate of relative growth rate; b = incremental relative rate of relative growth rate; y1 = size at age τ1, y2 = size at age τ2; z1 = relative growth rate at age τ1; z2 = relative
growth rate at age τ2 (S – variance, r2 - coefficient of determination).
Methods Sex n y1 y2 a b τ1 τ2 z1 z2 S r2
OL Male 140 20.04 107.55 0.143 1.020 1.25 13.9 1.243 0.037 26.64 0.939 Female 73 32.9 118.37 0.170 0.993 2.25 13.9 0.872 0.034 41.35 0.924 combined 405 15.37 115.69 0.139 1.018 1 15.5 2.316 0.040 31.61 0.949 BC Male 140 12.27 104.32 0.170 1.022 1 13 2.926 0.043 23.03 0.953 Female 73 26.5 111.16 0.115 1.038 2 13 0.355 0.023 24.84 0.957 combined 405 13.02 109.3 0.151 1.026 1 15 3.123 0.043 21.03 0.970
0 20 40 60 80 100 120 140 160
0 1 2 3 4 5 6 7 8 9
Otolith radius (mm)
F
o
rk
L
e
n
g
th
(
c
m
)
Otolith radius M odel
n=405
a
Table 3. Von Bertalanffy growth parameters calculated from observed lengths (OL) and back-calculated (BC) lengths of king mackerel collected off northeastern Brazil (SE -standard error; CV - coefficient of variation; r2 - coefficient of determination).
Methods Sex n Linf
(cm)
SE CV K (/year) SE CV to (year) SE CV r2
OL Male 140 118.6 7.300 0.061 0.171 0.021 0.128 0.098 0.129 1.319 0.939
Female 73 141.2 12.75 0.090 0.129 0.022 0.176 0.180 0.215 1.192 0.935
combined 405 124.9 3.435 0.027 0.165 0.009 0.060 0.270 0.075 0.277 0.935
BC Male 140 116.8 6.500 0.056 0.190 0.020 0.110 0.377 0.085 0.226 0.952
Female 73 132.7 8.507 0.064 0.159 0.02 0.127 0.387 0.127 0.328 0.957
combined 405 123.9 2.395 0.019 0.171 0.007 0.039 0.302 0.041 0.137 0.969
Fig. 9. Cross sections of approximate 95% confidence regions around least squares estimates (L∞, K) for growth parameters of males and females: (a) 95% confidence intervals calculated by the difference between the vectors of the growth parameters (L∞, K) (T2 of Hotelling) for females and males, (b) of S. cavalla off northeastern Brazil.
On the other hand, Hotteling’s T2 test and 95% confidence intervals calculated for differences between the vectors of the growth parameters (L∞, K)
of females and males demonstrated significant differences (T2 = 455.74; F = 226.79; d.f = 3.03;
P<0.001) for growth between sexes. The test result is
showngraphically in Figure 9b, in which the point H0
(δ=0) stands out from the constructed confidence intervals(δ≠0).
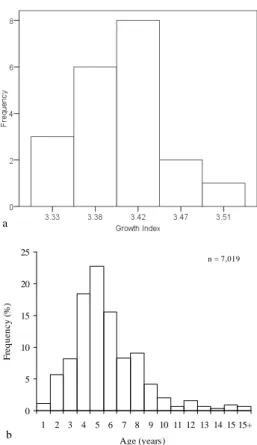
The distribution of the φ parameter had similar values over the whole area of occurrence (Table 4), revealing a similar growth pattern throughout the distribution of S. cavalla (mean=3.423; SD= 0.043) and normal distribution (Kolmogorov Smirnov-P=0.592) (Fig. 10a).
Using the age-length key for all the specimens analyzed in the growth study (n=405), the age structure for the entire sample was calculated, of the total of which specimens between 3 and 8 years of age represented 82.2% (Fig. 10b). According to the estimated parameters for separate sexes, females and
males have an approximate longevity of 32 and 26 years, respectively.
D
ISCUSSIONWhole otoliths of S. cavalla were used in the present study, as they offered good visibility of the bands (Fig. 3) and an acceptable average percent error (8.96%) between readings (CAMPANA, 2001). This APE reflects a moderately high level of precision in otolith readings and indicates that the aging protocol adopted is replicable. According to Campana and Jones (1992), measures of percent agreement vary substantially both among species and among ages within a species. Beamish and Fournier (1981) state that 95% agreement to within one year between two age readers of the Pacific cod (Gadus macrocephalus) constitutes poor precision, given the few classes in the fishery, but 95% agreement within five years would constitute good precision for the spiny dogfish (Squalus acanthias), given its sixty-year longevity.
Table 4. Parameters of von Bertalanffy growth equation for king mackerel (S. cavalla). L∞ in fork length;
φ
’ growth index of performance from Pauly and Munro (1984); M=males; F=females; B=both sexes combined.Area L∞ K(/year) to(year)
φ
’ Sex SourceNE Brazil 116 0.180 0.22 3.38 M Nomura and Rodríguez, 1967
137 0.150 0.13 3.45 F
141.2 0.140 0.14 3.45 B
NE Brazil 113.3 0.229 1.5 3.47 M Ximenes et al., 1978
131.7 0.164 2 3.45 F
124.9 0.185 1.8 3.46 B
Florida (USA) 111 0.208 1.48 3.41 M Manooch et al., 1987
142 0.136 1.98 3.44 F
148 0.115 2.36 3.40 B
Trinidad 112.3 0.180 -1.79 3.36 M Sturm and Salter, 1990
140.1 0.150 -1.52 3.47 F
Atlantic ocean (USA) 96.4 0.262 -1.98 3.39 M DeVries and Grimes, 1997
126.7 0.145 -3.15 3.37 F
E. Gulf of Mexico 102.6 0.247 -1.84 3.41 M
137.8 0.172 -1.83 3.51 F
W. Gulf of Mexico 102.8 0.203 -2.74 3.33 M
134.1 0.150 -2.69 3.43 F
NE Brazil 116.8 0.190 0.37 3.41 M this study
132.7 0.159 0.38 3.45 F
Fig. 10. Frequency distribution of growth index (
φ
) calculated for king mackerel growth parameters in different areas of the species distribution (a). Age composition for king mackerel (S. cavalla) collected off northeastern Brazil.Whole otoliths have been used by a large number of authors (NOMURA; RODRIGUES, 1967; BEAUMARIAGE, 1973; JOHNSON et al., 1983; MANOOCH et al., 1987; COLLINS et al., 1989) to estimate the age of Scomberomorus species due to the ease in the reading of growth bands (MANOOCH et al., 1987). High average percentage errors and low matching between band readings in sectioned otoliths have been found for S. queenslandicus and S. munroi off the east coast of Australia (BEGG; SELLIN, 1998). Likewise, low matching between readings of whole and sectioned otoliths, with a tendency toward overestimating age using sectioned otoliths, have been reported for the king mackerel (S. cavalla) off the Atlantic coast of the USA (Collins et al., 1989).
In the monthly marginal increment analysis, juveniles and adults exhibited similarities related to the period of the year when the smallest distances from the last growth band to the otolith edge were recorded. However, a shorter period was observed in juveniles, which may be related mainly to the endogenous control of growth band formation
(LONGHURST; PAULY, 1987). An extensive period of growth band formation was found in adults, suggesting that there may also be a strong influence of reproduction activity, promoting a redirection of energy to gonad maturity and reproduction, with a consequent reduction in somatic growth and possibly leading to the formation of translucent bands. In northeastern Brazil, S. cavalla exhibits full spawning, which is more intense between September and March (FONTELES-FILHO, 1988), coinciding with the period of smaller marginal increments, as observed in the otoliths of adult specimens in the present study.
Ximenes et al. (1978) found similar results in northeastern Brazil, with reductions in the translucent margins occurring in the otoliths from December to March, corresponding to the period of intense reproduction (GESTEIRA; MESQUITA, 1976). In Trinidad, bands are formed from November to February (STURM; SALTER, 1990), matching the period of reproductive activity (September to March). Similarly, in the northern hemisphere, translucent
bands are formed from April to June
(BEAUMARIAGE, 1973; JOHNSON et al., 1983; MANOOCH et al., 1987), when the reproduction season begins (FINUCANE et al., 1986). Thus, the reproduction process may be related to the formation of growth bands in S. cavalla.
The reasonable adjustment between the OR and FL resulting from the multiplicative model (Table 1- Figure 7a) and the similarity between the mean observed and backcalculated lengths (Fig. 7b) confirm the presupposition of proportionality between otolith size and length of the specimens (CARLANDER, 1981). Furthermore, the satisfactory adjustment of the backcalculated method to the data must be particularly attributed to the identification of the regression model that best described the relationship between the OR and FL, with the subsequent use of the Monastyrsky model suggested by Francis (1990). Backcalculation is widely used to validate marks interpreted on otoliths from species of Scomberomorus for age determination (NOMURA; RODRIGUES, 1967; XIMENES et al., 1978; COLLINS et al., 1989; STURM; SALTER, 1990; SCHMIDT et al., 1993).
No significant difference in growth was observed between sexes using visual analyses with overlapping between confidence intervals. However, this methodology is not characterized by a formal hypothesis test and does not give a P value. It is therefore conservative in demonstrating significant differences (BEALE, 1960; CERRATO, 1990). Despite these limitations, 95% confidence intervals provided a measurement for the variability of estimated growth parameters using the von Bertalanffy nonlinear least squares methods.
Hotelling’s T2 hypothesis test indicated a significant difference in growth for males and females, 0
5 10 15 20 25
1 2 3 4 5 6 7 8 9 10 11 12 13 14 15 15+ Age (years)
F
re
q
u
e
n
c
y
(
%
)
n = 7,019
and was the most accurate in the present study. Differences in growth pattern between sexes is typical of Scomberomorus species (BEAUMARIAGE, 1973; POWELL, 1975; STURM, 1978; JOHNSON et al., 1983; FABLE et al., 1987; MCPHERSON, 1992; BEGG; SELLIN, 1998), with females reaching larger sizes (L∞) than males.
The Schnute growth model was used to examine which model achieved the best adjustment to
S. cavalla growth in northeastern Brazil. According to
the values obtained for parameters a and b, the specialized von Bertalanffy model is the best model for describing the growth of the species in the region. The Schnute model employed in the present study was motivated by a concise biological principle and the four parameters nearly always have stable statistical estimates with reasonable biological interpretations (SCHNUTE, 1981).
The growth index (φ) values estimated in the present study correspond precisely to the means of the observed frequencies for the parameters reported for different areas of distribution of the species (Table 4 - Figure 10a) taking into consideration the estimate generated for combined sexes. According to Longhurst and Pauly (1987), there is a close relationship between the surface areas of the gills of a fish, its capacity to absorb oxygen, its size, longevity and growth parameters; environmental and latitudinal differences may also affect the growth of fish.
The stock structure of the king mackerel has frequently been the target of a variety of studies in the Gulf of Mexico and along the southeastern coast of the USA. Johnson et al. (1994) found differences in the stocks in the eastern and western Gulf of Mexico based on enzymatic electrophoresis. More recently, Gold et al. (2002) concluded that allele variations are consistent with the hypothesis of two highly distinguished stocks in Florida, separated by the peninsula. DeVries and Grimes (1997) found differences in growth for the king mackerel on the eastern side of the Gulf of Mexico and the Atlantic Ocean (USA). Analyses of otolith shapes in specimens from the Atlantic coast of the USA and the eastern Gulf of Mexico were efficient in classifying individuals from both locations; 99.8% of the species landed in southeastern Florida in winter originated from the Atlantic stock, compared to just 0.2% from the eastern Gulf of Mexico (DEVRIES et al., 2002).
Differences in growth between sexes indicate that males have faster growth until approximately five years of age. Beginning at six years of age, females have larger sizes for the same age (Fig. 8). According to Gesteira and Mesquita (1976), this species is ready for reproduction at 63 cm FL off the coast of the state of Ceará, Brazil (4.5 years for males; 4.4 years for females). At ages of first sexual maturity, females begin to have larges sizes
than males for the same age and reach larger asymptotic sizes (Table 3-Figure 8). Off the coast of Ceará, greater growth rates for females beginning in the adult phase stem from their greater voracity – as determined though studies on feeding habits (FONTELES-FILHO, 1988) –which may explain the inversion in growth rates found in the present study beginning in the adult phase.
The accentuated growth rate of males in relation to females at early ages is also verified by the
1
z
parameters estimated from the younger agesτ
1 by the Schnute model, which resulted in considerably higher values for males using both the direct and backcalculated methods (Table 2). This accelerated growth may be related to a greater proportion of males in relation to females (Fig. 5) in catches of S. cavalla in northeastern Brazil, as males would be more rapidly recruited to areas and fishing gear than females. This characteristic is a positive factor for the maintenance of the S. cavalla stock in northeastern Brazil, as the preservation of females is more important to the reproduction of the species than the preservation of males (NIKOLSKY, 1978; HELFMAN et al., 1997).The growth parameters and characteristics estimated in the present study and the age structure for
S. cavalla caught by the artisanal fleet in northeastern
Brazil represent an important contribution to our knowledge of the species. The present study updates essential information for assessing the stock of this important resource, for which the last growth studies in the region were carried out approximately thirty years ago (XIMENES et al., 1978). Likewise, studies on the age structure, reproduction, stock composition and exploitation levels of S. cavalla in northeastern Brazil should also be undertaken permanently in order to promote sustainable catches and the maintenance of this important fishery resource.
A
CKNOWLEDGEMENTSR
EFERENCESAGUILAR-SALAZAR, F. A.; SALAS-MÁRQUEZ, S. ; CABRERA-VÁZQUEZ,M. A.;MARTÍNEZ-AGUILAR, J. D. Crecimiento y mortalidad del carito
Scomberomorus cavalla en la zona de la costa norte de la
Península de Yucatán. Ciencia Pesq., v. 8, p. 71-82, 1991.
ALLEN, K. R. A method of fitting growth curves of the von Bertalanffy type to observed data. J. Fish. Res.Bd Can., v. 23, p. 163-179, 1966.
ARREGUÍN-SÁNCHEZ, F.; CABRERA, M. A.; AGUILAR, F. A. Population dynamics of the king (Scomberomorus cavalla) of the Campeche Bank, Mexico. Sci. mar., v. 59, n. 3-4, p. 637-645, 1995. BEAMISH, R. J.; FOURNIER, D. A. A method for
comparing the precision of a set of age determinations.
Can. J. Fish. aquatic. Sci., v. 38, p. 982-983, 1981.
BEAUMARIAGE, D. S. Age, growth and reproduction of King mackerel, Scomberomorus cavalla, in Florida.
Fla.mar.Res.Publ., St. Petersburg, n. 1, p. 1-45, 36 figs,
1973.
BEALE, E. M. L. Confidence regions in non-linear estimation. J. R. statist. Soc., B, v. 22, n. 1, p. 41-88, 1960.
BEGG, G.A.; SELLIN, M. J. Age and growth of school mackerel (Scomberomorus queenslandicus) and spotted mackerel (S. munroi) in Queensland east-coast waters with implications for stock structure. Mar. Freshwat.
Res., v. 49, p. 109-120, 1998.
CARLANDER, K. D. Caution on the use of the regression method of back-calculating lengths from scale measurements. Fisheries, v. 6 , n. 1, p. 2-4, 1981. CADVALLADER, P. L. Age, growth and condition of
common river galaxias, Galaxias vulgaris Stolkell, in the Glentni river, Canterbury, New Zealand. Fish. Res.
Bull., N.Z., v. 17, p. 15-20, 1978.
CAMPANA, S. E. Accuracy, precision and quality control in age determination, including a review of the use and abuse of age validation methods. J. Fish Biol. v. 59, p. 197-242, 2001.
CAMPANA, S. E.; JONES, C. M. Análisis of otolith microstructure data. In: STEVENSON, D. K.; CAMPANA, S. E. (Ed.). Otolith microstructure examination and analysis. Can. spec. Publ. Fish. aquat.
Sci., v. 117:, 26 p., 1992.
CERRATO, R. M. Interpretable statistical test for growth comparisons using parameters in the von Bertalanffy equation. Can. J. Fish. aquat. Sci., v. 47, p. 1416-1426, 1990.
COLLETE, B. B.; NAUEN, C. E. Scombrids of the world. An annotated and illustrated catalog of tunas, mackerels, bonitos and related species known to date. Fao Species
Catalog, v. 2.2. Fao Fish. Synop., v. 137 p., 1983.
COLLINS, M. R.; SCHMIDT, D. J. ; WALTZ, C. W.; PICKNEY, J. L. Age and growth of king mackerel,
Scomberomorus cavalla, from the Atlantic coast of the
United States. Fish. Bull., v. 87, p. 49-61, 1989. DEVRIES, A. D.; GRIMES, B. C. Spatial and temporal
variation in age and growth of King mackerel,
Scomberomorus cavalla. Fish. Bull., v. 95, p. 694-708,
1997.
DEVRIES, A. D.; GRIMES, C. B.; PRAGER, M. H. Using otolith shape analysis to distinguish eastern Gulf of Mexico and Atlantic Ocean stocks of King mackerel.
Fish. Res., v. 57, p. 51-62, 2002.
FAO. FAO nominal catches of Scomberomorus cavalla. 2007. <http://www.fishbase.org>. Access 03/20/ 2009. FABENS, A. J. Properties and fitting of the von Bertalanffy
growth curve. Growth, v. 29, p. 265-289, 1965. FABLE, W. A.; JOHNSON, A. G. ; BARGER, L. E. Age
and growth of Spanish mackerel, Scomberomorus
maculatus, from Florida and Gulf of Mexico. Fish. Bull.,
v. 85, p. 777-783, 1987.
FINUCANE, J. H.; COLLINS, L. A.; BRUSHER, H. A. SALOMAN, C. S. Reproductive biology of King mackerel, Scomberomorus cavalla, from the southeastern United States. Fish.Bull., v. 84:, p. 841-850, 1986. FONTELES-FILHO, A. A. Sinopse de informações sobre a
cavala, Scomberomorus cavalla (Cuvier) e a serra,
Scomberomorus brasiliensis Collette, Russo &
Zavala-Camin (Pisces: Scombridae), no estado do Ceará, Brasil.
Arq. Ciênc. Mar., v. 27, p. 21-48, 1988.
FRANCIS, R. I. C. C. Back-calculation of fish lengths: a critical review. J. Fish Biol., v. 36, p. 883-902, 1990. GESTEIRA, V. C. T.; MESQUITA, L. L. Época de
reprodução, tamanho e idade na primeira desova da cavala e da serra, na costa do estado do Ceará (Brasil).
Arq. Ciên. Mar, v. 16, n. 2, p. 83-86, 1976.
GOLD, J. R.; PAK, E. ; DEVRIES, A. D. Population structure of King mackerel (Scomberomorus cavalla) around peninsular Florida, as revealead by microsatelite DNA. Fish. Bull., v. 100, p. 491-509, 2002.
GRIFFITHS, R. C. The Tuna fishery of Venezuela with notes on other scombroids of potential commercial value. In: UNDP/SF/FAO. Fish. Res. Dev. Proj. 45. Caracas, Venezuela, 1971. p. 95-109.
HADDON, M. Modelling and quantitative methods in
fisheries. London: Chapman & Hall., 2001. 406 p.
HELFMAN, G. S.; COLLETE, B. B. ; FACEY, D.E. The
diversity of fishes. Malden: Blackwell Publishing, 1997.
528 p.
HILBORN, P.; WALTERS, C. J. Quantitative fisheries
stock assessment: Choice, dynamics and uncertainty.
New York: Chapman and Hall, 1992. chapter 13, p. 411-433.
IBAMA. Boletim Estatístico da Pesca Marítima Estuarina (ESTATPESCA) do Nordeste do Brasil. Tamandaré,
PE: Centro de Pesquisa e Extensão Pesqueira do Nordeste, 1990. 129 p.
IBAMA. Boletim Estatístico da Pesca Marítima Estuarina (ESTATPESCA) do Nordeste do Brasil. Tamandrá,
PE: Centro de Pesquisa e Extensão Pesqueira do Nordeste – CEPENE, 1991. 138 p.
IBAMA. Boletim Estatístico da Pesca Marítima e Estuarina (ESTATPESCA) do Nordeste do Brasil.
Tamandaré, PE: Centro de Pesquisa e Extensão Pesqueira do Nordeste – CEPENE, 1992. 132 p. IBAMA. Boletim Estatístico da Pesca Marítima e
Estuarina (ESTATPESCA) do Nordeste do Brasil.
Tamandaré, PE: Centro de Pesquisa e Extensão Pesqueira do Nordeste – CEPENE, 1993. 137 p. IBAMA. Boletim Estatístico da Pesca Marítima e
Estuarina (ESTATPESCA) do Nordeste do Brasil.
IBAMA. Boletim Estatístico da Pesca Marítima e Estuarina (ESTATPESCA) do Nordeste do Brasil.
Tamandaré, PE: Centro de Pesquisa e Extensão Pesqueira do Nordeste – CEPENE, 1995. 134 p. IBAMA. Boletim Estatístico da Pesca Marítima e
Estuarina (ESTATPESCA) do Nordeste do Brasil.
Centro de Pesquisa e Extensão Pesqueira do Nordeste, 1996. 139 p.
IBAMA. Boletim Estatístico da Pesca Marítima e Estuarina (ESTATPESCA) do Nordeste do Brasil.
Centro de Pesquisa e Extensão Pesqueira do Nordeste – CEPENE, 1997. 133 p.
IBAMA. Boletim Estatístico da Pesca Marítima e Estuarina (ESTATPESCA) do Nordeste do Brasil.
Tamandaré, PE: Centro de Pesquisa e Extensão Pesqueira do Nordeste – CEPENE, 1998. 136 p. IBAMA. Boletim Estatístico da Pesca Marítima e
Estuarina (ESTATPESCA) do Nordeste do Brasil.
Tamandaré, PE: Centro de Pesquisa e Extensão Pesqueira do Nordeste – CEPENE, 1999. 136 p. IBAMA. Boletim Estatístico da Pesca Marítima e
Estuarina (ESTATPESCA) do Nordeste do Brasil.
Tamandaré, PE: Centro de Pesquisa e Extensão Pesqueira do Nordeste do Brasil – CEPENE, 2000. 138 p.
IBAMA. Boletim Estatístico da Pesca Marítima e Estuarina (ESTATPESCA) do Nordeste do Brasil.
Tamandaré, PE: Centro de Pesquisa e Extensão Pesqueira do Nordeste do Brasil – CEPENE, 2001. 138 p.
IBAMA. Boletim Estatístico da Pesca Marítima e
Estuarina (ESTATPESCA) do Nordeste do Brasil.
Tamandaré, PE: Centro de Pesquisa e Extensão Pesqueira do Nordeste do Brasil – CEPENE, 2002. 136 p.
IBAMA. Estatística da Pesca, Brasil. Grandes Regiões e Unidades da Federação. Brasília, DF: 2003. 98 p.
IBAMA.Estatística da Pesca, Brasil. Grandes Regiões e Unidades da Federação. Brasília, DF: 2004. 98 p.
IBGE. Estatística de Pesca 1980 a 1989 - Brasil - Grandes
Regiões - Unidades da Federação. v. 1; 2. Brasília,
DF: 1989. 253 p.
IVO, C. T. C. Época de desova e idade na primeira maturação sexual da cavala, Scomberomorus cavalla (Cuvier), no estado do Ceará. Arq.Ciênc.Mar., v. 14, n. 2, p. 27-2, 1972.
JOHNSON, A. G.; FABLE, W. A. ; WILLIANS, M. L.; BARGER, L. E. Age, growth, and mortality of king mackerel, Scomberomorus cavalla, in the Gulf of Mexico. Fish. Bull., v. 81, p. 97-106, 1983.
JOHNSON, A. G.; FABLE JR., W. A.; GRIMES, C. B. ; TRENT, W. L.; PEREZ, W. E. Evidence for distinct stocks of King mackerel, Scomberomorus Fish. Bull., v. 92, p. 91-101, 1994.
KIMURA, D. K. Likelihood methods for the von Bertalanffy growth curve. Fish.Bull., v. 77, p. 765-766, 1980. LESSA, R. P. Recursos Pesqueiros da Região Nordeste. In:
MINISTÉRIO DO MEIO AMBIENTE. Programa
REVIZEE: Avaliação do potencial sustentável de
recursos vivos na zona econômica exclusiva. Relatório
Executivo. Brasília, DF: MMA, Secretaria de Qualidade
Ambiental, 2006. 280 p.
LESSA, R. P.; NÓBREGA, M. F.; BEZERRA, JR., J. L. Dinâmica de populações e avaliação de estoques de recursos pesqueiros na Região Nordeste. Programa de
avaliação do potencial sustentável de recursos vivos na zona econômica Exclusiva (REVIZEE). Recife, PE:
Subcomitê Regional Nordeste (Score-NE), 2004.
Relatório Síntese. 274 p.
LONGHURST, A. R.; PAULY, D. Ecology of Tropical
Oceans. San Diego: Academic Press, 1987. 407 p.
MANOOCH, C.S.; NAUGHTON, S. P.; GRIMES, C. B.; TRENT, L. Age and growth of king mackerel ,
Scomberomorus cavalla from the US Gullf of Mexico. Mar. Fish. Rev., v. 49, p. 102-108, 1987.
MCPHERSON, G. R. Age and growth of narrow-barred Spanish mackerel (Scomberomorus commerson Lacépède,1880) in northeastern Queensland waters.
Aust. J. mar. Freshw. Res., v. 43, p. 1269-1282, 1992.
NÓBREGA, M. F.; LESSA, R. P. Descrição e composição das capturas da frota pesqueira artesanal da região nordeste do Brasil Arq. Ciên. Mar., v. 40, n. 2, p. 64 – 74, 2007.
NIKOLSKY, G. V. The ecology of fishes. London: Academic Press,1978. 351 p.
NOMURA, H.; RODRIGUES, M. S. S. Biological notes on King mackerel, Scomberomorus cavalla (Cuvier), from northeastern Brazil. Arq.Est.Biol.Mar., v. 7, n. 1, p. 79-85, 1967.
PAULY, D.; MUNRO, J. L. Once more on the comparison of growth in fish and invertebrates. ICLARM Fishbyte, v. 2, n.1, p. 21, 1984.
POWELL, D. Age, growth, and reproduction in Florida stocks of Spanish mackerel, Scomberomorus maculatus.
Fla mar. Res. Publs, v. 5, 21 p., 1975.
RICKER, W. E. Computation and interpretation of biological statistics of fish populations. Bull. Fish. Res. Bd Can., v. 191, 382 p., 1975.
SCHMIDT, D. J.; COLLINS, M. R. ; WYANSKI, D. M. Age, growth, maturity, and spawning of Spanish mackerel, Scomberomorus maculatus (Mitchill), from the Atlantic Coast of the southeastern United States.
Fish. Bull., v. 91, p. 526-533, 1993.
SCHNUTE, J. A versatile growth model with statistically stable parameters. Can. J. Fish. aquat. Sci., v. 38, p. 1128-1140, 1981.
SPARRE, P.; VENEMA, S. C. Introduction to tropical fish
stock assessment. Rome: FAO, 1997. 404 p.
STURM, M. G. Aspects of the biology of Scomberomorus maculates (Mitchill) in Trinidad. J. Fish Biol., v. 13, p. 155-72, 1978.
STURM, M. G.; SALTER, P. Age, growth and reproduction of king mackerel Scomberomorus cavalla (Cuvier) in Trinidad waters. Fish. Bull., v. 88, p. 361-70, 1990. SUDEPE. Estatística da Pesca. Produção: 1971 a 1979.
Brasília, DF: Ministério da Agricultura, 1979. 186 p. WALFORD, L. A. A new graphic method of describing the
growth of animals. Biol.Bull., v. 90, p. 141-147, 1946. XIMENES, M. O. C.; MENEZES, M. F.; A. A.
FONTELES-FILHO. Idade e crescimento da cavala,
Scomberomorus cavalla no Estado do Ceará. (Brasil) Arq. Ciên. Mar, v. 18, n. 1/2, p. 73-81, 1978.