Article
J. Braz. Chem. Soc., Vol. 26, No. 8, 1674-1683, 2015. Printed in Brazil - ©2015 Sociedade Brasileira de Química 0103 - 5053 $6.00+0.00
A
*e-mail: [email protected]
Simultaneous Determination of Environmental Contaminants with Different
Volatilities in Tap Water Samples Using a New Approach to Single-Drop
Microextraction Procedure
Josias Merib, Adriana N. Dias, Vanessa Simão and Eduardo Carasek*
Departamento de Química, Universidade Federal de Santa Catarina, 88040-900 Florianópolis-SC, Brazil
A new single-drop microextraction approach is proposed for the extraction of compounds with a wide range of volatilities from tap water samples with separation/detection by gas chromatography-mass spectrometry. This new microextraction mode is called direct immersion-headspace-single drop microextraction (DI-HS-SDME). Trihalomethanes (THMs), hydrocarbons with low molecular weight (benzene, ethyl benzene and xylenes) and polycyclic aromatic hydrocarbons (PAHs) were the model compounds. Ten milliliters of tap water samples and drop volume of 1.5 µL of 1-octanol were used. The optimal condition for DI-HS-SDME mode was 80 min of total extraction time (48 min at 40 °C in DI-SDME mode and 32 min at 12 °C in HS-SDME mode) and the addition of 1.2 g of NaCl. The analytical figures of merit were evaluated, the limits of detection ranged from 0.03 µg L-1 for o-xylene and ethyl benzene to 6 µg L-1 for THMs. The proposed method represents
a promising alternative for the analysis of aqueous matrices which contain compounds with very different ranges of volatility.
Keywords: environmental contaminants, THM, PAH, microextraction
Introduction
Sample preparation is a crucial part of chemical/ biological analysis and can be considered an important step of the analytical process. The main objectives associated with sample preparation are the removal of potential interferents, analyte preconcentration and the possibility of derivatization of the analytes into a more detectable form can also be achieved.1 For organic trace analysis,
this step mainly comprises extractions, which serve to isolate compounds of interest from the sample matrix. The concentration of target compounds is enhanced (sample enrichment) and the presence of matrix components is reduced (sample cleanup).2 Several methods have been
developed to perform efficient sample preparation prior to chromatographic analysis. Firstly, the so-called classical sample preparation methods were developed, notably liquid-liquid extraction (LLE) and solid-liquid extraction (SLE). These sample preparation methods have high extraction capacity; however, some disadvantages are associated with these techniques, such as the use of large amounts of toxic solvents, which is particularly negative
regarding environmental concerns in almost all activities. In some cases, using these classical techniques long extraction times are often required.
Due to these factors, sample preparation techniques which allow efficient extraction with low solvent consumption are welcome. In this regard, miniaturized sample preparation techniques have been developed. One of the most widespread of these techniques is the solid-phase microextraction (SPME), developed by Arthur and Pawliszyn,3 and introduced in 1990. Years later, the
liquid-phase microextraction (LPME) was introduced to the scientific community.4-6 One variant of LPME consists
with the SDME are the simplicity of application, low cost and high extraction and cleanup capacity.9 SDME
also has a wide range of applicability and has been used for determination of several types of analytes including pesticides,10-16 organic acids,17,18 phenols,19-21 aldehydes,22
haloacetic acids,23 amines,24 amino acids,25 sulfonamides,26
and metallic species such as Cd,27 Sb,28 CrVI,29 and Se.30 One
of the disadvantages of using the SDME technique, mainly in the direct immersion mode, is the possibility of losses of solvent microdrop during the microextraction procedure. In addition, biological samples, such as plasma, may emulsify substantial amounts of organic solvents, and this may even enhance the instability problem.31
The extraction mode in both SPME and SDME techniques is selected due to characteristics of analyte/ matrix. In general, for aqueous samples containing analytes with low volatility, such as polycyclic aromatic hydrocarbons (PAHs),32 the DI mode presents higher
efficiency. However, to analyze samples containing more volatile compounds, such as trihalomethanes (THMs)33 or
benzene, toluene, ethyl benzene, and xylene (BTEX),6 the
HS mode generally provides higher extraction efficiency. The compounds known as PAHs and BTEX are among the most carcinogenic, mutagenic and toxic found in aquatic systems. There are several sources of these compounds in the environment, the main one being associated with spills involving the release of petroleum products like gasoline, diesel fuel, and lubricants, among others.34,35
Trihalomethanes are compounds which can be formed by the reaction of chlorine with naturally occurring organic matters, principally humic acid and fulvic acid. This chlorine is applied to drinking water in order to deactivate microorganisms and/or to ensure the residual concentrations in drinking water distribution systems. THMs are all considered to be possible carcinogens and, therefore, human exposure to such compounds should be minimized.36
For samples containing different classes of compounds with a wide range of volatilities, the choice of only one microextraction mode (HS or DI) can decrease substantially the extraction efficiency for some compounds. Therefore, it is very complicated the achievement of efficient extractions for all compounds (volatiles and less volatiles) in samples containing analytes with huge differences in their volatilities/polarities.
In studies involving SPME, a new microextraction approach using both modes (DI-HS) in the same extraction procedure has been investigated. Using this approach, excellent results were reached for the extraction of compounds with a wide range of volatilities,35,37 leading to
the achievement of an extraction condition which allowed
good extraction capacity for all analytes (volatiles and less volatiles) studied. According to the best of our knowledge, the DI-HS mode used in the SDME procedure has not been previously reported. Therefore, the aim of this research was to propose an efficient single-drop microextraction approach for aqueous samples containing environmental contaminants with large differences in their volatilities, using both DI and HS modes (DI-HS-SDME) sequentially implemented in the same microextraction procedure. In this study, concentrations of THMs, benzene, ethyl benzene,
o-, m-, p-xylene and PAHs in tap water samples (collected in Florianópolis, Santa Catarina State, Brazil) were determined. Multivariate optimizations were performed to determine the ideal extraction conditions for each mode. In addition, a comparison between the extraction efficiencies for the HS, DI and DI-HS modes was carried out.
Experimental
Instrumentation
A Shimadzu gas chromatograph (GC) equipped with a mass spectrometry (MS) detector (Kyoto, Japan) GC-MS QP-2010 Plus and chromatographic column Restek Rtx®-5MS (30 m × 0.25 mm × 0.25 µm) obtained
from Restek Corporation (Bellefonte, PA, USA) were used in this study. The oven temperature program was: 40 °C (held for 10 min), 20 °C min-1 to 80 °C and 6 °C min-1 to
300 °C (held for 3 min). The injector temperature was 260 °C, the temperatures of the ion source and the interface were 270 and 260 °C, respectively. Ultra-pure helium was used as the carrier gas with a flow of 1 mL min-1. The
injection was performed in the split mode at a ratio of 1:10 and the mass spectrometer was operated in electron impact (EI) ion source mode at 70 eV. The analysis in selected ion monitoring (SIM) mode was carried out using the following m/z ratios for the quantification: chloroform (83), bromodichloromethane (83), dibromochloromethane (129), bromoform (173), benzene (78), ethyl benzene (91),
p-, m-xylene (91), o-xylene (91), acenaphthylene (152), fluorene (166), phenanthrene (178), anthracene (178), pyrene (202), benzo(a)anthracene (228) and chrysene (228).
Materials
microsyringe 1700 series (Hamilton, Reno, NV, USA) was employed to perform the single-drop microextractions.
Reagents and solutions
Sodium chloride P.A. (Vetec, Rio de Janeiro, Brazil), extraction solvents 1-octanol, toluene and n-hexane (Vetec), ultra-purified water (Mega Purity, Billerica, MA, USA), standard solutions of polycyclic aromatic hydrocarbons in acetone containing acenaphthylene, fluorene, phenanthrene, anthracene, benzo(a)anthracene, chrysene and pyrene (Supelco) at a concentration of 500 µg mL-1 were used in this study. Also, THM standard
solutions containing chloroform, bromodichloromethane, dibromochloromethane and bromoform at a concentration of 200 µg mL-1 in methanol (Supelco) were employed. A
standard solution containing benzene, ethyl benzene, o-, p-, m-xylene at a concentration of 2000 µg mL-1 in methanol
(Supelco) was also used.
Sample collection
Tap water samples were collected directly from the laboratory at the Department of Chemistry, Federal University of Santa Catarina, located in the city of Florianópolis, Santa Catarina State, Brazil, and analyzed immediately after collection.
Selection of extraction solvent and drop volume for SDME procedure
In the procedure for the selection of the extraction solvent the following organic solvents were investigated: hexane, toluene and 1-octanol. Aqueous solutions containing 200 µg L-1 of all analytes were submitted to
microextractions with 1.0 µL of each solvent. The HS and DI modes were used to verify the solvent which presented the best extraction performance. The stability of the microdrop using extraction time of 40 min and extraction temperature of 20, 30 and 45 °C was evaluated. Ten milliliters of ultra-pure water were used for all microextraction procedures.
After choosing the extraction solvent, the microdrop volume was optimized using 0.5, 1.0, 1.5 and 2.0 µL, also 10 mL of ultra-pure water were employed. In this optimization procedure, the extraction conditions for the HS mode were a temperature of 20 °C and extraction time of 20 min; for the DI mode the extraction conditions were 40 °C and 30 min of extraction. For this both optimizations, the geometric mean for all analytes was used as response and the microextractions were performed in triplicate.
Single-drop microextraction apparatus
SDME procedures were performed in three modes (HS, DI and DI-HS) using 10 mL of water sample. For the conventional HS and DI modes only one thermostatic bath was used with the temperature adjusted according to desired extraction conditions. In this procedure, after reaching the required extraction time, the 1-octanol microdrop was withdrawn into the needle of the syringe and transferred to the gas chromatograph injector. Magnetic stirrers were used to perform the microextractions; in the direct immersion mode a stirring rate of 250 rpm was employed; in regard to headspace extractions a rate of 700 rpm was used.
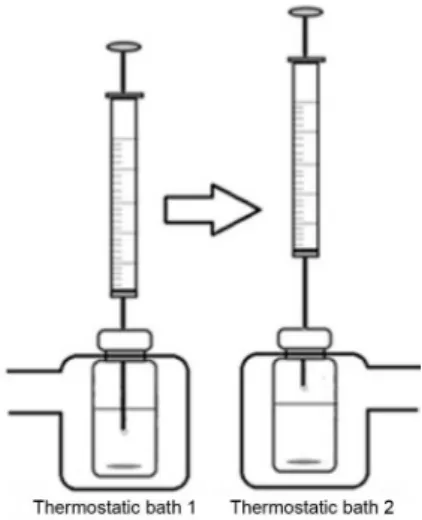
For the DI-HS approach, two thermostatic baths were placed side by side to facilitate the transfer of the vial containing the aqueous sample and the microsyringe needle. The scheme of the apparatus used for the DI-HS-SDME procedure is shown in Figure 1.
Firstly, the microextraction in DI mode was performed in the thermostatic bath 1. After the extraction time, a 1.5 µL microdrop of 1-octanol was withdrawn and the vial containing the sample and the microsyringe needle was transferred to the thermostatic bath 2 (at lower temperature). After this, the organic solvent microdrop was exposed again, however at this time, in the sample headspace. After the extraction time, the 1-octanol microdrop was withdrawn into the needle and the solvent content was injected into the gas chromatograph injector.
Multivariate optimizations
of interest was considered, the SDME procedure was performed using 1.5 µL of 1-octanol and ultra-pure water was used in all optimization steps. Aqueous solutions containing 20 µg L-1 of each analyte were employed.
Three central composite designs were performed for the construction of the response surfaces in each optimization, using the software Statistica 8.0 (STATSOFT, Tulsa, OK, USA), 17 experiments were carried out in each case with triplicate in the central point. The following optimizations were performed: (i)optimization of extraction conditions for HS-SDME mode: firstly, the optimization to obtain the ideal extraction conditions for the HS-SDME mode was performed. The variables studied were the extraction time (10-60 min), extraction temperature (10-60 °C) and the mass of sodium chloride added (0-3.6 g); (ii)optimization of the extraction conditions for DI-SDME mode: optimization was also performed to achieve the ideal extraction conditions for the DI-SDME mode, with the following variables: extraction time (26-94 min), extraction temperature (28-62 °C) and the mass of sodium chloride added (0-3.6 g); (iii)optimization of extraction conditions for DI-HS-SDME mode: using the optimized temperatures obtained with the previous optimizations (DI-SDME and HS-SDME) a new central composite design was carried out to verify the ideal conditions for the extraction using the DI-HS-SDME mode. The variables studied were the total extraction time (26-94 min), percentage of the total time in which the extraction was performed in the HS-SDME mode (0-100%) and the mass of sodium chloride added (0-3.6 g).
Comparison among the different extraction modes
A comparison among the extraction efficiencies obtained for the three modes (DI-SDME, HS-SDME and DI-HS-SDME) was performed. For this purpose, extractions using an aqueous solution containing 20 µg L-1 of each
analyte were carried out. The extractions were performed applying the following conditions: (i) DI-SDME: extraction time of 48 min at 40 °C with 0.2 g of NaCl; (ii) HS-SDME: extraction time of 32 min at 15 °C with 3.0 g of NaCl; (iii) DI-HS-SDME: extraction time of 48 min at 40 °C in the DI mode, followed by 32 min at 15 °C in the HS mode; NaCl mass of 1.2 g.
Analytical parameters of merit and analysis of real samples
The analytical parameters of merit, such as the linearity (R2), linear range, precision (relative standard deviation,
RSD), accuracy (recovery tests), limits of detection (LOD) and quantification (LOQ) were determined. To obtain the calibration curve, the method involving standard additions
into the tap water samples obtained from our laboratory was employed. The tap water samples were spiked with different concentrations of each analyte. For all trihalomethanes analyzed in this work, concentrations of 20.0, 30.0, 70.0, 100 and 200 µg L-1 were used. The following concentrations
were used for the calibration curves regarding the other compounds; benzene: 0.3, 0.5, 1.0, 5.0 and 10 µg L-1; ethyl
benzene: 0.1, 0.5, 1.0, 5.0 and 10 µg L-1; p-, m-xylene: 0.5,
1.0, 3.0, 5.0 and 10 µg L-1; o-xylene: 0.1, 0.5, 1.0, 2.0 and
5.0 µg L-1. Concerning PAHs the concentrations were as
follows. For fluorene, chrysene and pyrene: 1.0, 2.0, 7.5, 10 and 15 µg L-1; for phenanthrene and anthracene: 0.5,
1.0, 2.0, 3.0 and 10 µg L-1; for acenaphthylene: 2.0, 4.0,
7.5, 10 and 15 µg L-1 and for benzo(a)anthracene: 0.5, 2.0,
7.5, 10 and 15 µg L-1.
The first point of the calibration curve for each analyte was used as the LOQ; the value achieved for LOQ was divided by 3.3 and the LOD was obtained. Similar procedure for the calculation of LOD and LOQ was employed previously.39,40
To assess the accuracy, the recovery percentages of the analytes in samples previously spiked with known concentrations of the compounds were determined. In addition, the tap water samples without any spiking were analyzed and the content of the compounds studied was determined using the DI-HS-SDME approach.
Results and Discussion
Single-drop microextraction: choice of extraction solvent and drop volume
The extraction solvent and microdrop volume are considered very important factors to be optimized in a single-drop microextraction procedure. The solvent microdrop must not suffer dissolution or evaporation, in general, nonpolar and low volatility solvents are used.41
Firstly, the solvent which provided the best extraction efficiency for all analytes was selected and in this regard
n-hexane, toluene and 1-octanol were tested.
which can easily accommodate analyte molecules of low polarity, and the presence of hydroxyl groups, which may be important for stabilizing polar functional groups present in the molecule.41
Regarding the 1-octanol microdrop volume employed in this study, the 1.5 µL drop showed better stability and extraction efficiency in comparison with the 0.5, 1.0 and 2.0 µL drops. The use of a 2.0 µL drop led to stability problems, mainly in direct-immersion mode; in this case, the drop became unstable and was often lost in some microextractions. The 0.5 and 1.0 µL drops did not show stability problems but lower extraction efficiencies were achieved if compared to the 1.5 and 2.0 µL drops. Therefore, a solvent drop volume of 1.5 µL of 1-octanol was used to fulfill this study.
Optimization steps
Optimization of HS-SDME mode
The HS-SDME mode was optimized using a central composite design to determine the ideal extraction conditions in this mode. In this case, the extraction of the compounds with lower volatilities (PAHs with higher molecular mass) was greatly inhibited in the HS mode due to their characteristics being very different if compared to those of more volatile compounds (THMs, benzene, ethyl benzene and xylenes).
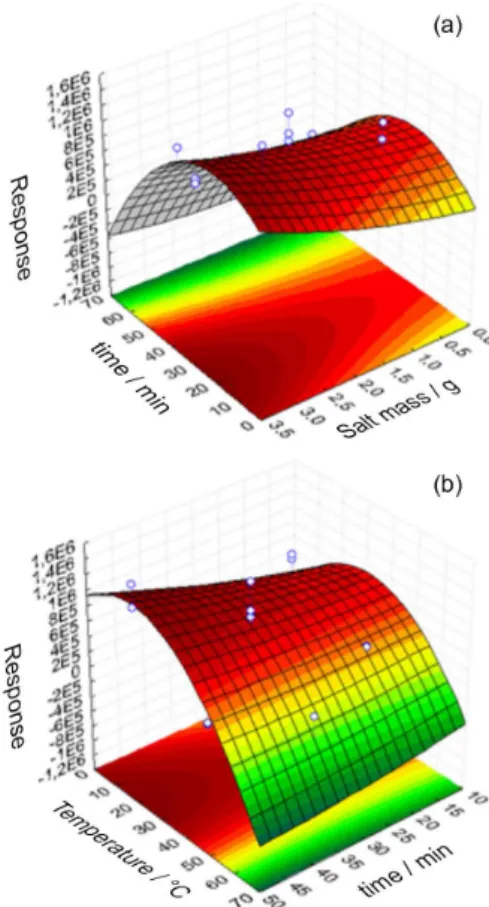
Therefore, because of this great difference of extraction efficiency among the different classes of compounds studied in this work, an alternative mode to SDME is welcome. For this aim, the analytes were divided in two groups and the geometric means of the chromatographic peak areas for the first group (THMs, benzene, ethyl benzene and xylenes), which has higher extraction efficiencies in the HS-SDME mode, were used to build response surfaces in order to determine the ideal extraction conditions for this extraction mode. Figure 2 shows the response surfaces obtained for the variables extraction time, extraction temperature and salt mass, considering only the geometric means of chromatographic peak areas obtained for more volatile compounds (THMs, benzene, ethyl benzene and xylenes) in the HS-SDME mode. The geometric mean was used to minimize the influence of large chromatographic peak areas corresponding to one or more compounds.
According to the response surfaces and considering only the more volatile compounds, higher chromatographic peak areas for the HS mode were found using extraction time of 35 min or higher, extraction temperature around 15 °C and NaCl mass of 3.2 g.
As discussed in previous sections, due to different behavior of the analytes, mainly regarding the volatility, the
extraction temperature is an important factor to enhance the analytical response. Therefore, the optimized temperature achieved in the HS-SDME mode (15 °C) was also applied to DI-HS-SDME approach.
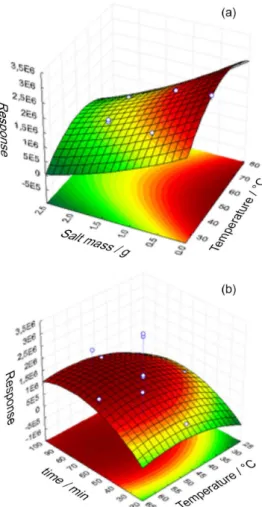
Optimization of DI-SDME mode
Using another central composite design, the experimental conditions for the DI-SDME mode were also optimized. The data used as the response were the geometric means of the chromatographic peak areas for the studied compounds.
variable extraction temperature (40 °C) was used for the DI-HS-SDME procedure.
Optimization of DI-HS-SDME mode
The extraction conditions to DI-HS-SDME mode were also optimized. In the optimization step, the variables total extraction time, percentage of time in headspace mode and NaCl mass added into the aqueous samples were studied. The temperatures used for the direct-immersion (40 °C) and headspace (15 °C) modes were previously optimized as described above.
To determine the ideal extraction conditions for DI-HS-SDME the geometric means of the peak areas of all studied compounds were selected. Therefore, in this case, compromise conditions for all studied compounds (THM, benzene, ethyl benzene, xylenes and PAHs) were proposed. The response surfaces obtained for all analytes are shown in Figure 4.
According to the response surfaces obtained in Figure 4, it can be observed that 80 min of total extraction time with 40% of this total time (32 min) in the HS mode provided the
highest extraction efficiency. Regarding the NaCl, a mass of 1.2 g represented the ideal extraction conditions for all analytes. These values were used as optimized extraction conditions for DI-HS-SDME mode and for determination of the analytical parameters of merit.
Comparison among the SDME modes
The extraction efficiencies of the three single-drop microextraction modes (DI, HS and DI-HS-SDME) were investigated in this study. The optimized experimental conditions for each mode, as previously described, were used. A bar graph showing the normalized chromatographic peak areas corresponding to each analyte is shown in Figure 5.
This bar graph shows the efficiencies of the single-drop microextraction modes for each compound analyzed in this study. As expected, the HS mode presented the best extraction efficiency for more volatile analytes such as THMs and benzene, ethyl benzene and xylenes; this mode also presented higher extraction efficiency for Figure 3. Response surfaces obtained for DI-SDME mode, considering
only the chromatographic peak areas of the less volatile compounds (PAHs).
acenaphthylene. However, for less volatile compounds the HS mode was not so efficient, and for PAH compounds heavier than pyrene (compound number 13 in Figure 5) no chromatographic peak area was achieved in this mode. Regarding the DI mode, it can be observed that this approach allowed higher values for the chromatographic peak areas for the heavier compounds (PAHs); however, for lighter compounds (THMs, benzene, ethyl benzene and xylenes) this mode presented lower extraction efficiencies. Considering the different extraction capacities of each mode, the DI-HS-SDME mode emerges as an interesting alternative for samples which contain classes of compounds with a wide range of volatilities. It can be observed in the bar graph (Figure 5) that the new approach can be applied
to all of the different classes of compounds with good extraction efficiency observed, particularly for benzene, ethyl benzene, xylenes and the lighter PAHs.
According to this comparison, the application of DI mode presented poor analytical responses for the extraction efficiency of volatile compounds; on the other hand, lower analytical responses were achieved for the heavier compounds with the application of only the HS mode. Therefore, this new approach, combining DI and HS sequentially in the same microextraction procedure (DI-HS-SDME), offers the important advantage of achieving “compromise conditions” for analytes with different behaviors. This factor emerges as a good alternative to samples containing several classes of analytes with different volatilities, and at same time, this approach allowed the determination of all studied compounds in a single microextraction procedure.
Analytical parameters of merit for the DI-HS-SDME mode
The analytical parameters of merit mentioned in the experimental section were evaluated. Also, recovery tests on tap water samples spiked with known concentrations of each analyte were performed, considering the lower and higher level of the calibration curve. All microextraction procedures were performed in triplicate and the arithmetic mean of the chromatographic peak area was used as response. The analytical parameters of merit obtained using the new DI-HS-SDME mode is shown in Table 1. Figure 5. Extraction efficiencies for all compounds analyzed in HS,
DI and DI-HS modes: (1) chloroform; (2) bromodichloromethane; (3) dibromochloromethane; (4) bromoform; (5) benzene; (6) ethyl benzene; (7) p-, m-xylene; (8) o-xylene; (9) acenaphthylene; (10) fluorene; (11) phenanthrene; (12) anthracene; (13) pyrene; (14) benzo(a)anthracene; and (15) chrysene.
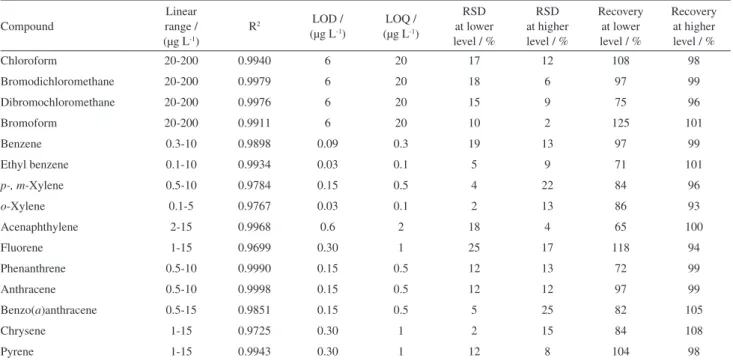
Table 1. Analytical parameters of merit obtained using the new DI-HS-SDME approach
Compound
Linear range / (µg L-1)
R2 LOD /
(µg L-1)
LOQ / (µg L-1)
RSD at lower level / %
RSD at higher level / %
Recovery at lower level / %
Recovery at higher level / %
Chloroform 20-200 0.9940 6 20 17 12 108 98
Bromodichloromethane 20-200 0.9979 6 20 18 6 97 99
Dibromochloromethane 20-200 0.9976 6 20 15 9 75 96
Bromoform 20-200 0.9911 6 20 10 2 125 101
Benzene 0.3-10 0.9898 0.09 0.3 19 13 97 99
Ethyl benzene 0.1-10 0.9934 0.03 0.1 5 9 71 101
p-, m-Xylene 0.5-10 0.9784 0.15 0.5 4 22 84 96
o-Xylene 0.1-5 0.9767 0.03 0.1 2 13 86 93
Acenaphthylene 2-15 0.9968 0.6 2 18 4 65 100
Fluorene 1-15 0.9699 0.30 1 25 17 118 94
Phenanthrene 0.5-10 0.9990 0.15 0.5 12 13 72 99
Anthracene 0.5-10 0.9998 0.15 0.5 12 12 97 99
Benzo(a)anthracene 0.5-15 0.9851 0.15 0.5 5 25 82 105
Chrysene 1-15 0.9725 0.30 1 2 15 84 108
Pyrene 1-15 0.9943 0.30 1 12 8 104 98
LOD: Limit of detection; LOQ: limit of quantification; RSD: relative standard deviation. Lower levels: THM, 20 µg L-1; benzene, ethyl benzene and
As can be observed in Table 1, acceptable analytical parameters of merit for the extraction of THM, benzene, ethyl benzene, xylenes and PAHs from the tap water samples using the proposed DI-HS-SDME mode were obtained. The RSD varied from 2 to 25% and the recovery for spiked samples from 65 to 125%. The linear range obtained for the THMs varied from 20 to 200 µg L-1 and
the limits of detection achieved were 6 µg L-1 for the
four compounds of this class studied, with R2 varying
from 0.9911 to 0.9979. These results are similar to those obtained by Maia et al.,42 who determined these compounds
in swimming pool samples by SPME-GC with electron capture detection (ECD). With regard to the benzene, ethyl benzene and xylenes, the linear range obtained varied from 0.1 to 10 µg L-1 with R2 values in the range of 0.9767 to
0.9972 and limits of detection of 0.03 to 0.15 µg L-1. For
the PAHs the linear range was between 0.5 and 15 µg L-1
with R2 varying from 0.9699 to 0.9998 and the limit of
detection from 0.30 to 0.60 µg L-1. The results obtained
with the proposed DI-HS-SDME procedure for these two classes of compounds are similar to those obtained by Bianchin et al.35 for the determination of BTEX and PAHs
in aqueous samples by SPME/GC-MS.
Both SPME and SDME sample preparation techniques are considered efficient and offer reduced environmental impact compared with classical sample preparation methods. However, the SPME technique, if compared to SDME, is associated with higher analysis costs. In addition to the extraction efficiency, low cost analysis is an important and desirable characteristic to make the analytical method suitable and widespread. Therefore, the proposed mode presented in this work (DI-HS-SDME) is highlighted because of its very low analysis costs and the good results obtained for the determination of environmental contaminants with wide range of volatilities in one single chromatographic determination.
Analysis of real samples
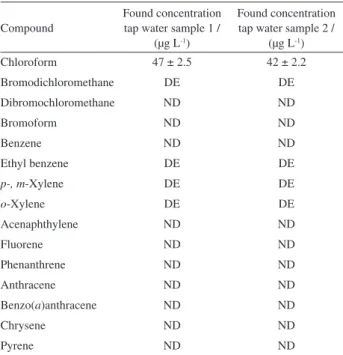
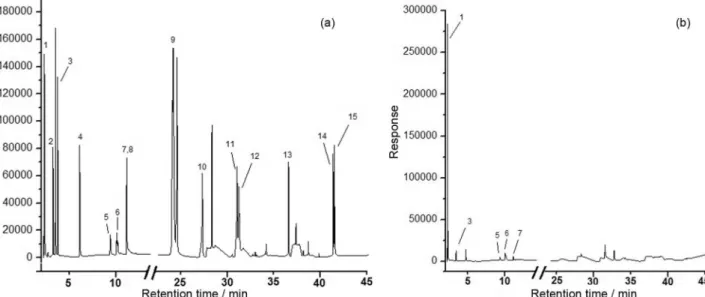
Tap water samples collected directly from our laboratory were analyzed applying the DI-HS-SDME approach and Table 2 shows the results obtained. A chromatogram obtained from tap water sample spiked with 20 µg L-1 for THM, 5 µg L-1 for benzene, ethyl benzene
and xylenes and 10 µg L-1 for PAH is shown in Figure 6a.
Also, a chromatogram obtained for real tap water samples (without spiking) is shown in Figure 6b.
As can be seen in Table 2, some contaminants were found in tap water samples submitted to DI-HS-SDME procedure and chloroform presented the highest concentrations. In both samples, concentrations around 40 µg L-1 were obtained for
this THM. The presence of this compound can be explained by the use of chemical treatment with free chlorine in order to inactivate some pathogenic microorganisms in water. Free chlorine can react with organic matter present in the water and generate compounds such as THMs. Another THM (bromodichloromethane) was also found in the analyzed samples, however, at concentrations below the LOQ. The United States Environmental Protection Agency (US EPA) and the European Union (EU) have set limits of 80 and 100 µg L-1, respectively, for the sum of chloroform,
bromodichloromethane, dibromochloromethane and bromoform compounds in drinking water.43
Ethyl benzene, o-, m-, p-xylene were also detected. These compounds are also characterized as environmental contaminants and thus the US EPA has established maximum contaminant levels (MCLs) for benzene (5 µg L-1), ethyl
benzene (700 µg L-1) and xylenes (10,000 µg L-1) in drinking
water. An MCL value of 1.0 µg L-1 for benzene in drinking
water has been established by European legislation.44,45
In the studied tap water samples benzene, ethyl benzene and xylenes levels were below the LOQ. According to the regulatory agencies and to the contaminant levels found using the DI-HS-SDME approach, the levels of the THMs, benzene, ethyl benzene and xylenes in these tap water samples are below the established MCLs. For some PAH such as anthracene, the EU46 established maximum allowed
concentration of 0.1 µg L-1. However, in the analysis of these
real samples the studied PAH were not detected. Table 2. Results obtained for the analysis of the tap water samples
Compound
Found concentration tap water sample 1 /
(µg L-1)
Found concentration tap water sample 2 /
(µg L-1)
Chloroform 47 ± 2.5 42 ± 2.2
Bromodichloromethane DE DE
Dibromochloromethane ND ND
Bromoform ND ND
Benzene ND ND
Ethyl benzene DE DE
p-, m-Xylene DE DE
o-Xylene DE DE
Acenaphthylene ND ND
Fluorene ND ND
Phenanthrene ND ND
Anthracene ND ND
Benzo(a)anthracene ND ND
Chrysene ND ND
Pyrene ND ND
Conclusions
The new approach to single-drop microextraction using direct-immersion and headspace extraction in the same microextraction procedure showed good performance for determination of environmental contaminants in water samples. This approach allowed the analysis of compounds with a wide range of volatilities in a single assay. According to the multivariate optimization, this procedure allowed to achieve a “compromise condition” for the extraction of all analytes. This extraction technique represents an excellent alternative to the traditional single-drop microextraction procedure, combining efficient extraction, low analysis costs and environmentally friendly characteristics. The comparison among the microextraction modes showed that DI-HS-SDME presented capacity of extraction of all analytes in a single assay with relatively good analytical responses if compared to DI and HS used separately. Despite the use of one additional experimental step, this proposed approach has an interesting extraction capacity and it can be explored on multiresidual analysis of different contaminants from aqueous samples, taking into account that several multiresidual methods explore analytes with completely different behavior regarding their volatility.
Acknowledgments
The authors are grateful to the Brazilian Government Agency Conselho Nacional de Desenvolvimento Científico e Tecnológico (CNPq) for the financial support which made this research possible.
References
1. Wen, Y. Y.; Chen, L.; Li, J. H.; Liu, D. Y.; Chen, L. X.; TrAC, Trends Anal. Chem.2014, 59, 26.
2. Psillakis, E.; Kalogerakis, N.; TrAC, Trends Anal. Chem.2003,
22, 565.
3. Arthur, C. L.; Pawliszyn, J.; Anal. Chem.1990, 62, 2145. 4. Jeannot, M. A.; Cantwell, F. F.; Anal. Chem.1996, 68, 2236. 5. Liu, H. H.; Dasgupta, P. K.; Anal. Chem.1996, 68, 1817. 6. He, Y.; Lee, H. K.; Anal. Chem.1997, 69, 4634.
7. Martendal, E.; Budziak, D.; Carasek, E.; J. Chromatogr. A2007,
1148, 131.
8. Xiao, Q.; Yu, C. H.; Xing, J.; Hu, B.; J. Chromatogr. A2006,
1125, 133.
9. Jeannot, M. A.; Przyjazny, A.; Kokosa, J. M.; J. Chromatogr. A
2010, 1217, 2326.
10. Zhao, E.; Han, L.; Jiang, S.; Wang, Q.; Zhou, Z.; J. Chromatogr. A
2006, 1114, 269.
11. Amvrazi, E. G.; Tsiropoulos, N. G.; J. Chromatogr. A2009,
1216, 2789.
12. Pinheiro, A. d. S.; da Rocha, G. O.; de Andrade, J. B.;
Microchem. J.2011, 99, 303.
13. dos Anjos, J. P.; de Andrade, J. B.; Microchem. J.2014, 112, 119.
14. Pinheiro, A. d. S.; de Andrade, J. B.; Talanta2009, 79, 1354.
15. Carlos, E. A.; Alves, R. D.; de Queiroz, M. E. L. R.; Neves, A. A.; J. Braz. Chem. Soc.2013, 24, 1217.
16. Soares, C. E. S.; Neves, A. A.; de Queiroz, M. E. L. R.; Oliveira, A. F.; Costa, A. I. G.; Assis, R. C.; Andrade, C. E. O.; J. Braz. Chem. Soc.2014, 25, 2016.
Figure 6. Chromatograms obtained by GC-MS-SIM from tap water samples. (a) Chromatogram obtained from tap water sample spiked with 20 µg L-1 of
THM, 5 µg L-1 for benzene, ethyl benzene and xylenes; and 10 µg L-1 of PAH. (b) Chromatogram obtained from real tap water sample (without spiking).
17. Sha, Y.; Meng, J.; Zhang, Y.; Deng, C.; Wu, D.; J. Sep. Sci.2010,
33, 212.
18. Saraji, M.; Mousavinia, F.; J. Sep. Sci.2006, 29, 1223. 19. Saraji, M.; Bakhshi, M.; J. Chromatogr. A2005, 1098, 30. 20. Zhao, F.-Q.; Li, J.; Zeng, B.-Z.; J. Sep. Sci.2008, 31, 3045. 21. Rincon, A. A.; Pino, V.; Ayala, J. H.; Afonso, A. M.; Talanta
2011, 85, 1265.
22. Deng, C.; Yao, N.; Li, N.; Zhang, X.; J. Sep. Sci.2005, 28, 2301. 23. Saraji, M.; Bidgoli, A. A. H.; J. Chromatogr. A2009, 1216,
1059.
24. Sha, Y.; Meng, J.; Lin, H.; Deng, C.; Liu, B.; J. Sep. Sci.2010,
33, 1283.
25. Fiamegos, Y.; Nanos, C.; Stalikas, C.; J. Chromatogr. B: Anal. Technol. Biomed. Life Sci. 2004, 813, 89.
26. Gao, L.; Zou, J.; Liu, H.; Zeng, J.; Wang, Y.; Chen, X.; J. Sep. Sci.2013, 36, 1298.
27. Fan, Z.; Zhou, W.; Spectrochim. Acta, Part B2006, 61, 870. 28. Fan, Z.; Anal. Chim. Acta2007, 585, 300.
29. Pena, F.; Lavilla, I.; Bendicho, C.; Spectrochim. Acta, Part B
2008, 63, 498.
30. Fragueiro, S.; Lavilla, I.; Bendicho, C.; Talanta2006, 68, 1096. 31. Pawliszyn, J.; Pedersen-Bjergaard, S.; J. Chromatogr. Sci.2006,
44, 291.
32. Hou, L.; Lee, H. K.; J. Chromatogr. A2002, 976, 377. 33. Aguilera-Herrador, E.; Lucena, R.; Cardenas, S.; Valcarcel, M.;
J. Chromatogr. A2008, 1209, 76.
34. El Nemr, A.; Abd-Allah, A. M. A.; Chemosphere2003, 52, 1711.
35. Bianchin, J. N.; Nardini, G.; Merib, J.; Dias, A. N.; Martendal, E.; Carasek, E.; J. Chromatogr. A2012, 1233, 22. 36. Cho, D. H.; Kong, S. H.; Oh, S. G.; Water Res.2003, 37, 402. 37. Merib, J.; Simao, V.; Dias, A. N.; Carasek, E.; J. Chromatogr.
A2013, 1321, 30.
38. Jain, A.; Verma, K. K.; Anal. Chim. Acta2011, 706, 37. 39. Dias, A. N.; Simao, V.; Merib, J.; Carasek, E.; Talanta2015,
134, 409.
40. Dias, A. N.; Simao, V.; Merib, J.; Carasek, E.; Anal. Chim. Acta
2013, 772, 33.
41. Kokosa, J. M.; Przyjazny, A.; Jeannot, M. A.; Solvent Microextraction: Theory and Practice; John Wiley & Sons: Hoboken, 2009.
42. Maia, R.; Correia, M.; Pereira, I. M. B.; Beleza, V. M.;
Microchem. J.2014, 112, 164.
43. Rodriguez-Cabo, T.; Ramil, M.; Rodriguez, I.; Cela, R.; Talanta
2012, 99, 846.
44. Li, Q. L.; Ma, X. X.; Yuan, D. X.; Chen, J. S.; J. Chromatogr. A
2010, 1217, 2191.
45. Nollet, L. M. L.; Chromatographic Analysis of the Environment; Taylor & Francis: Boca Raton, 2006.
46. European Commission (EC); Proposal for a Directive of the European Parliament and of the Council Amending Directives
2000/60/EC and 2008/105/EC as Regards Priority Substances
in the Field of Water Policy, (COM(2011) 876 final, 2011/0429
(COD)); EC: Brussels, 2012.
Submitted: April 10, 2015