Article
Printed in Brazil - ©2016 Sociedade Brasileira de Química0103 - 5053 $6.00+0.00A
*e-mail: [email protected]
Application of a Quantitative HPLC-ESI-MS/MS Method for Flavonoids in
Different Vegetables Matrices
Bruno Perlatti,*,a João B. Fernandes,a Maria F. G. F. Silva,a Jorge A. Ardila,b Renato L. Carneiro,b Bruno H. S. Souza,c Eduardo N. Costa,c Wellington I. Eduardo,c
Arlindo L. Boiça Juniorc and Moacir R. Forima
aLaboratório de Produtos Naturais and bGrupo de Quimiometria Aplicada, Departamento de
Química, Universidade Federal de São Carlos, Rod. Washington Luiz km 235, 676, 13565-905 São Carlos-SP, Brazil
cDepartamento de Fitossanidade, Faculdade de Ciências Agrárias e Veterinárias, Universidade
Estadual Paulista (FCAV/UNESP), Via de Acesso Prof. Paulo Donato Castellane s/n, 14849-900 Jaboticabal-SP, Brazil
Plant flavonoids have been increasingly studied for its importance in plant metabolism, inter-species interactions and human health-promoting effects. Each botanical inter-species has a distinct flavonoid profile, and as such, this work aimed to develop and apply a high-performance liquid chromatography coupled to electrospray ionization tandem mass spectrometry (HPLC-ESI-MS/MS) method to quantify specific flavonoids in different plants and parts. Six flavonoids (isoquercitrin, quercetin, naringin, naringenin, hesperidin and rutin), two isoflavonoids (daidzin and daidzein) and one coumarin (umbelliferone) were targeted. Calibration curves showed good correlations (R2 > 0.994) and limits of quantification (≤ 500 ng mL-1). The method was applied for detection of analytes in common bean seeds (Phaseolus vulgaris), soybean leaves (Glycine max), and sour orange (Citrus aurantium), sweet orange (Citrus sinensis), and Tahiti lime (Citrus latifolia) flavedo
after ultrasound assisted acidic hydroalcoholic extraction. The method was tuned for quick and efficient extraction. Principal component analysis was helpful for the discrimination of matrices based on their flavonoid profiles.
Keywords: flavonoid, HPLC-ESI-MS/MS, quantitative analysis
Introduction
Unlike animals, which have many different defense mechanisms such as oral communication, gesturing, fight or flight responses, intra- and inter-species interactions, etc., plants often rely on their extensive repertoire of biochemical reactions to live, survive, grow, and reproduce within the environment. In doing so, chemical compounds are constantly transformed and interconverted by plants in order to supply themselves with energy and materials to construct their own tissues and to carry out intra- and inter-specific communications with the environment. Plants depend on their secondary metabolisms to serve as defense signaling mechanisms against herbivore and microorganism attack and to regulate physiological functions, allelopathic
behavior, and reproduction.1,2 Plant communications are
mostly carried out through specific secondary metabolites such as alkaloids, terpenes, and polyphenols. This latter class of compounds has been demonstrated to act as mediators of plant growth by regulating features such as modulation, fertility, differentiation, photosynthesis, cell growth regulation, and responses to biotic and abiotic
stress.3,4
Polyphenols are highly oxygenated molecules that constitute a wide range of plant secondary metabolites. Among the different classes of polyoxygenated phytochemicals, flavonoids are one of the most widespread;
comprising over 8,000 structures.5 This class of molecules
enzymatic inhibition, antimicrobial, anti-inflammatory,
phytoestrogenic, and neuroprotective properties.5-8 As a
result, the quantitative monitoring of these compounds may be of great interest for studies regarding compositional variation among distinct species and/or genotypes, and also could be applied in quality control programs of plant-derived materials.
Several different chromatographic and electrophoretic approaches have been used to promote the separation
of flavonoids.9 These techniques have been applied for
the critical evaluation of flavonoids in a wide range of
matrices encompassing in natura edible parts of plants,
commercial products and biological fluid.10-13 Because of
the characteristics of these samples (polar, non-volatile, good ionization), high-performance liquid chromatography coupled to electrospray ionization tandem mass spectrometry (HPLC-ESI-MS/MS) has shown great promise due to its high reliability, unmatched reproducibility, and high
sample throughput.14-16 Using such methodology, a specific
polyphenolic profile for samples based on the existence, and quantity of each individual components could be used for confirmation of the sample source and discrimination among
closely related matrices.17,18
Thus, the aim of this work was to develop and apply
a quantitative HPLC-ESI-MS/MS method to detect and quantify selected flavonoids in different botanical matrices, and to use this quantitative information along with chemometrics to develop a tool of matrices identification based on their polyphenol profiles.
Experimental
Solvents and standards
Acetonitrile (ACN) and methanol (MeOH) (mass spectrometry-MS grade) were purchased from J. T. Baker (Phillipsburg, NJ, USA). Analytical grade acetic acid (99.99%) and hydrochloridric acid (HCl) were purchased from Sigma-Aldrich (St. Louis, MO, USA). Ultrapure water was obtained in-house using a Milli-Q system (0.05 µS; Millipore Corporation, Watford, UK). Umbelliferone (7-hydroxycoumarin), daidzein, daidzin
(daidzein-7-O-glucoside), hesperidin (hesperitin 7-O-rutinoside),
naringenin, naringin (naringenin-7-O-neohesperidoside),
quercetin, isoquercitrin (quercetin-3-O-glucoside), and
rutin (quercetin-3-O-rutinoside) standards were purchased
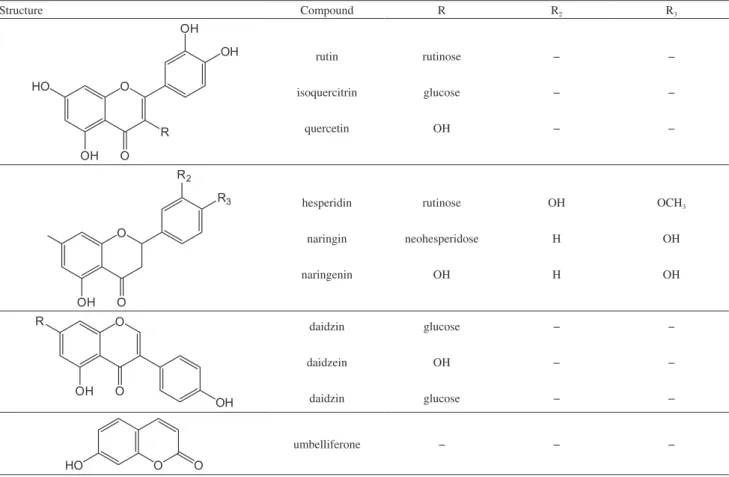
from Sigma-Aldrich (St. Louis, MO, USA). The structures of selected polyphenols are shown in Table 1.
Table 1. Selected polyphenols used in this study
Structure Compound R R2 R3
O HO
OH O R
OH OH
rutin
isoquercitrin
quercetin
rutinose
glucose
OH
−
−
−
−
−
−
O
R3 R2
O OH
hesperidin
naringin
naringenin
rutinose
neohesperidose
OH
OH
H
H
OCH3
OH
OH
O
R
OH O
OH
daidzin
daidzein
daidzin
glucose
OH
glucose
−
−
−
−
−
−
O
HO O
Vegetable samples
Samples were taken from the following different plant species and different plant structures. Soybean (Glycine max) leaves from 10 varieties (BR16, BRSGO
8360, BRS Valiosa RR, DM 339, Dowling, IAC 100, IGRA RA 516 RR, IGRA RA 626 RR, PI 227688, and PI 274454) were cultivated in greenhouse conditions using eutrophic dusky red latosols with irrigation through dripping whenever necessary. Before analysis, the soybean leaves were washed with a solution of demineralized water and 0.05% neutral detergent. Subsequently, they were washed four times with only demineralized water. Three different
varieties of citrus [sour orange (Citrus aurantium), sweet
orange (Citrus sinensis), and Tahiti lime (Citrus latifolia)]
were purchased from a local supermarket and peeled with a knife, taking extreme care to avoid cutting the albedo in order to use only the flavedo in the extraction. Common bean (Phaseolus vulgaris) seeds from 43 different genotypes were
kindly provided by Campinas Agronomic Institute (IAC). The common bean seeds and soybean leaves were dried in oven at 40 °C for 48 h and reduced to low grain size with a knife mill (Thomas Wiley Mill, model Te 650, Swedesboro, NJ, EUA). Flavedos from the three citrus species were dried at 40 ºC for 48 h and ground to fine powders (80 mesh) with an analytical mill (A10, IKA, Wilmington, NC, US). All samples were stored in an ultrafreezer at −80 ºC until use.
Extraction method of polyphenols
The extraction method used for common bean seeds and soybean leaves were as follows. Samples (0.5 g) were weighed and transferred into 15 mL Falcon tubes (Corning, NY, US). For the extraction procedure, samples were left in
an ultrasound bath for 60 min in 10 mL of MeOH/0.5 mol L-1
HCl (80:20 v/v) solution. The temperature of the water bath increased linearly from 25 ºC to 40 ºC over the course of the extraction. The solvent was removed by centrifugation (30 min, 4 ºC, 20.800 × g; 5810R, Eppendorf, Hamburg, Germany); the extraction was then repeated once more, and then the extraction solvent from both steps were combined for each sample.
The ground powder of citrus flavedo was weighed (1.0 g) and transferred to a 50 mL Falcon tube. 20 mL of methanol was added and the sample was left in an ultrasound bath for 30 minutes. After centrifugation (30 min, 4 ºC, 20.800 × g) and collection of the supernatant 10 mL of methanol was added and the sample was left in ultrasound for 15 min. After centrifugation, both supernatants were combined and stored. This procedure was repeated for all citrus samples.
The combined extracts of each sample were evaporated to dryness, resuspended in 5 mL of MS-grade methanol, filtered through a 0.22 µm microporous regenerated cellulose membrane filter (Macherey-Nagel, Düren, Germany), and diluted using HPLC solvents A and B to achieve the same composition of the initial HPLC method prior to injection, to match solvent strength. All extraction procedures were performed in triplicate for statistical analysis.
HPLC-ESI-MS/MS setup
HPLC analyses were carried out using an Agilent 1200 Series (Agilent Technologies, Santa Clara, CA, USA) with a degasser (G1322A), quaternary pump (G1311A), autosampler (G1367B), thermostated column compartment (G1316A), and diode array detector (G1316A). An Alltech
Prevail C18 (150 mm × 2.1 mm internal diameter-i.d., 3 µm
particle size; Deerfield, IL, USA) column was used. The mobile phase consisted of 0.5% acetic acid in deionized water (v/v; solvent A) and 0.5% acetic acid in acetonitrile (v/v; solvent B). All analyses were performed in gradient elution mode starting with 75:25 (A:B % ratio) for 6.0 min followed by sloping to 90% B in 0.5 min, which was maintained for another 13.5 min; the total run time was
20 min. The flow rate of the mobile phase was 250 µL min-1,
the sample injection volume was 5 µL, and the column oven temperature was 35 ºC.
After separation, the HPLC flow was directed to the MS inlet after 1:10 splitting. MS and MS/MS analyses were performed on an API™ 2000 (AB/MDS Sciex, Framingham, MA, USA) with a Turbo Ion Spray electrospray ionization source operating in negative
mode (ESI−). Nitrogen was used as the carrier, heater, and
collision gases. The software Analyst v.1.5.2 (AB/MDS Sciex, Framingham, MA, USA) was used to control the equipment for data acquisition and analysis.
All analytes were evaluated by selected reaction monitoring (SRM) after choosing appropriate precursor and product ions through Q1 Full Scan and Product Ion
(MS2) analyses. Analyte-dependent parameters for MS and
MS/MS were optimized for each analyte individually by
direct infusion of a 10.0 µg mL-1 solution in H
2O:ACN (1:1)
using a syringe pump, with flow of 10 µL min-1.
Source-dependent parameters were optimized by flow injection analysis (FIA) of a solution containing all analytes, each
at a concentration of 1.00 µg mL-1.
Quantitative method parameters
following guidelines proposed by International Conference
on Harmonisation (ICH).19 Primary stock solutions of
each flavonoid in MS-grade methanol were prepared in
nominal concentrations of 10.00 mg mL-1 by weighing
10.00 ± 0.10 mg of flavonoid and diluting to nominal volumes of 1.000 mL in a volumetric flask. The stock solutions were diluted in a volumetric flask to obtain a standard working solution containing all components at
concentrations of 100.0 µg mL-1 in H
2O:MeOH (9:1 v/v).
The solutions used to construct the analytical calibration curve were prepared by diluting the working solution to
0.500, 1.00, 5.00, 10.0, 20.0, 30.0, 40.0, and 50.0 µg mL-1
with 10% MeOH in water. All solutions were prepared in triplicate from freshly prepared working solutions. The linear work range was determined from the least squares linear regression model obtained by plotting the integrated area of the SRM chromatogram peak of each flavonoid against their nominal concentrations. Linearity was assessed by means of the goodness of fit of the linear model through the coefficient
of determination (R2) and further confirmed by testing the
null hypothesis for the correlation and the intercept using analysis of variance (ANOVA). Limits of quantification (LOQ) and limits of detection (LOD) were estimated for each analyte from the regression analysis using the standard
deviation of the intercept and the slope.20
Specificity was evaluated by comparing the chromatograms of each analyte regarding the appearance of co-eluting peaks with the same selected transition and retention times. Accuracy and precision were determined at three different concentrations for each analyte (1.20, 25.0 and
45.0 µg mL-1) to cover the entire range of linearity. Samples
were prepared in quintuplicate on three nonconsecutive
days (n= 3), and accuracy was evaluated by the percentage
of bias from the values obtained the using calibration curve compared to the nominal values. Precision was assessed by the standard deviation (SD) of intra- and inter-day analysis. Recovery was carried out by adding 10 mL of working solution with nominal concentrations of 1.20
and 40.0 µg mL-1 in order to encompass the two ends
of the linear work range directly to the matrix (0.5 g of common bean and soybean or 1.0 g of citrus flavedo). After doping, the samples were homogenized and dried at 45 ºC. Subsequently, they were submitted to the same extraction process described previously. Recovery was calculated after subtracting the mean value of the area of each analyte obtained for the same matrix without doping. The matrix effect was evaluated by comparing the area produced by a solution containing all analytes in solvent with those produced by the extracted analytes in matrix.
Robustness was evaluated by applying controlled small variations to method parameters and observing the changes
in area and retention time derived from these experimental modifications. Concentration of organic modifier, oven temperature and flow rate were used as parameters, and each one was evaluated in a lower and higher level compared to original method parameter, with triplicate injections for each level.
Principal component analysis
The original data (concentration of polyphenols) were preprocessed by autoscaling. Principal component analysis (PCA) was performed using Matlab 2011a (Mathworks, Natick, MA, USA) to construct a matrix consisting of 91 samples and 7 variables (flavonoids). The concentrations of two compounds (umbelliferone and naringenin) were below LOD in all samples, so these compounds were not included in the chemometric analyses.
Results and Discussion
Development of the method
The method was established, developed, and optimized to allow simple analysis of flavonoids in botanical matrices with reduced analytic time and cost. Several chromatographic parameters, such as peak symmetry, number of theoretical plates, and retention factor, were considered. The use of short columns with smaller particle sizes allowed the chromatographic elution of all nine standards in less than 15 min; for comparison, normal
HPLC analyses usually require 40-60 min runs.21
In order to obtain high sensitivity and selectivity in MS, analyte ionization must be optimized. As such, each molecule was analyzed by full scan experiments, with all analytes showing highest ion intensity when experiments were carried out in negative mode using a relatively low declustering potential (DP = −75 V) and a high focusing potential (FP = −350 V), along with an ion spray voltage of −4500 V. Source gases were set to 40 to 50 psi for GS1 and GS2 respectively, and the source temperature was adjusted
to 350 ºC. Furthermore, product ion experiments (MS2)
for each analyte indicated optimal values for collision-associated dissociation gas (CAD) and collision energy (CE) (4 psi and −50 V, respectively) for all analytes.
reactions at the C rings of the aglycones daidzein,
quercetin, and naringenin.22 The only exceptions are the
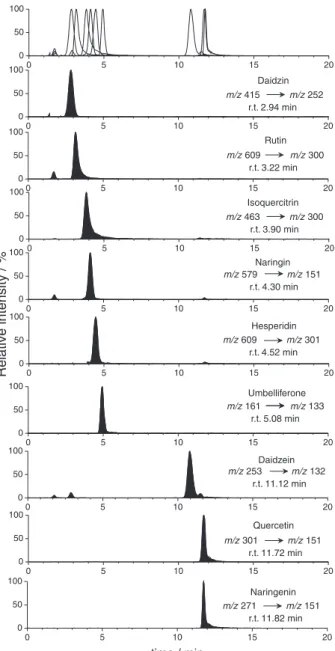
glycosylated flavonoid naringin, where the fragment formed through retrocyclization is more intense than the one derived from loss of glycine, and the coumarin umbelliferone, where the most prominent fragmentation under experimental conditions was the loss of CO. An example of a full chromatogram obtained from a standard sample with the separation of each analyte based on SRM selectivity and fragmentation is given in Figure 1.
Quantitative method parameters
Analytical figures of merit were assessed in order to evaluate the method. Regarding matrix effects, samples of
same concentration in solvent and blank matrix showed equivalent retention time and area, indicating that the method does not suffer from interfering matrix effects due to the co-elution of the analytes or other impurities. Linearity was determined by fitting the data using the least-squares method (Figure S1) and observing the
coefficient of determination (R2) for each analyte along
with single-factor ANOVA (Table 2).
The R2 values were ≥ 0.994 for all analytes, indicating
a good linear relationship between the total variance in the data. Linearity was also evaluated by means of ANOVA, which indicated that slope P-values were < 0.05, and intercept P-values were > 0.05 (Table S1). The small slope P-values indicates a strong relationship between each pair of y and x values in the regression equations. The larger intercept P-values indicate that the intercept is not
statistically different from zero.23 The slopes of calibration
curves were significantly different from zero (≥ 1.14 × 10⁻²⁵,
P-value < 0.05), verifying the high sensitivity of the method. The LOQ values of all analytes were lower than
0.500 µg mL-1, which was the first point in all the calibration
curves. The relative standard deviation (RSDs) for the analyses of the analytes at this concentration, which is
equivalent to 10.0 mg kg-1 of analyte in the samples, were
below 2.0%. High calibration sensitivity was achieved using the SRM technique; all analytes also showed an analytical signal of at least 3.3 times higher than the instrument noise
for concentrations of 0.250 µg mL-1.
The intra- and inter-day precisions and accuracy were assessed using the data from two quality controls analyzed over a 3-day period (n = 15 for each evaluated concentration). The results were expressed as RSD percentage for three different concentrations (1.20, 25.0 and
45.0 µg mL-1). The precision values for all analytes ranged
from 1.35% to 4.21%, and the accuracy values ranged from 93.7% to 102.8%, indicating that the developed method is reproducible and accurate.
Moreover, two different concentrations of each analyte were added to each matrix before the extraction steps. The analyses of spiked samples with concentrations of
1.20 µg mL-1 showed a higher variation in recovery, which
ranged from 83.1% (isoquercitrin; common beans) to 107.3% (rutin; soybean). The recoveries for the solution
with a concentration of 40.0 µg mL-1 ranged between
86.1% (naringin; citrus) and 103.1% (rutin; soybean). Recovery analyses were needed since there was not matrix free of selected analytes or deuterated standards readily available.
Robustness analyses were carried out by applying small variations in the concentration of acetic acid in both mobile phases (0.444% and 0.556%; nominal value 0.500%),
0 5 10 15 20
0 50 100
0 5 10 15 20
0 50
1000 5 10 15 20
0 50
1000 5 10 15 20
0 50 100
0 5 10 15 20
0 50
1000 5 10 15 20
0 50
100 0 5 10 15 20
0 50
100 0 5 10 15 20
0 50
1000 5 10 15 20
0 50
1000 5 10 15 20
0 50 100
time / min
Naringenin m/z 271 m/z 151
r.t. 11.82 min Daidzein m/z 253 m/z 132
r.t. 11.12 min
Quercetin m/z 301 m/z 151
r.t. 11.72 min Umbelliferone m/z 161 m/z 133
r.t. 5.08 min
R e la ti v e intensit y / % Hesperidin m/z 609 m/z 301
r.t. 4.52 min Naringin m/z 579 m/z 151
r.t. 4.30 min m/z 609 m/z 300
r.t. 3.22 min
Isoquercitrin m/z 463 m/z 300
r.t. 3.90 min Daidzin m/z 415 m/z 252
r.t. 2.94 min
Rutin
column oven temperature (33 ºC and 37 ºC; original value
35 ºC) and mobile phase flow rate (230 µL min-1 and
270 µL min-1; original value 250 µL min-1). Regarding
retentions time, variations from 0.0% (naringin; oven temperature and flow rate) to 7.2% (isoquercitrin; flow rate) were observed, showing that the method can support small fluctuations without big discrepancies in retention time. For peak area, isoflavones daidzin and daidzein have shown to be the least robust analytes, showing 22.6-32% variation in peak area when conditions changed, while for the other seven analytes variations of 2.7% (naringinin; oven temperature) to 11.4% (isoquercitrin; flow rate) were observed, indicating that isoflavones are more sensitive to changes in method parameters and care should be taken regarding HPLC-MS method when those analytes are present. Table S2 shows the data for robustness.
After defining the HPLC-ESI-MS/MS method and assessing its analytical figures of merit, the analytical method could be applied for the identification and quantification of the analytes in the samples.
Quantitative analyses of samples
The developed extraction method was tuned for the extraction of polyphenolic compounds based on
reports in the literature.16,24 This method produced quick,
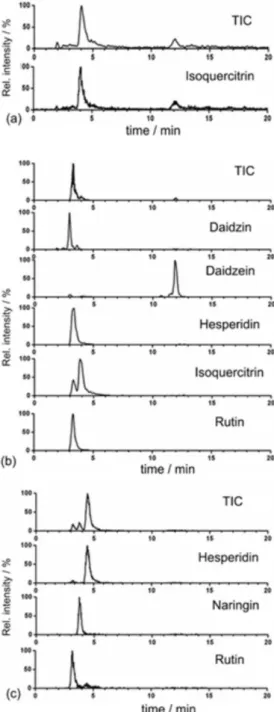
reproducible, and efficient results with good recoveries. The mobile phase dilution step prior to injection was included to decrease the sample solvent strength and improve the interaction between the analytes and the stationary phase. In total, 44 common bean, 38 soybean, and 9 citrus samples were analyzed (Table 3). A representative chromatogram for each matrix is displayed in Figure 2.
In P. vulgaris, only isoquercitrin was quantitatively
detected in all samples, while quercetin was quantitatively detected in only 4 samples and was found to be below the LOQ in the 12 other samples. These results are in agreement with previous studies that evaluated the polyphenol compositions of different varieties of common beans and indicated the presence of polyphenolic constituents other
than the ones evaluated in this work.21,25 This discrepancy
Table 2. Analytical and statistical parameters obtained with the developed quantitative HPLC-ESI-MS/MS method for selected analytes
Analyte Regression equation R2a LOQb / (ng mL-1) LODc / (ng mL-1) P-value (ANOVA)d
Daidzin y = 2313.3x + 880.1 0.996 0.362 0.120 1.11 × 10⁻²⁷
Rutin y = 16245.9x + 6073.2 0.999 0.155 0.051 8.83 × 10-36
Quercetin y = 11766.0x + 3171.8 0.999 0.137 0.045 5.62 × 10-37
Naringin y = 14172.6x + 7501.7 0.999 0.178 0.059 1.91 × 10⁻³⁴
Hesperidin y = 6410.3x + 1803.4 0.999 0.213 0.070 9.90 × 10⁻³³
Umbelliferone y = 422.3x + 322.2 0.994 0.448 0.148 1.14 × 10⁻²⁵
Daidzein y = 8131.0x + 7449.6 0.996 0.183 0.060 3.34 × 10⁻³⁴
Isoquercitrin y = 57537.6x + 1528.7 0.999 0.214 0.071 1.03 ×10⁻³²
Naringenin y = 7926.0x + 6721.4 0.999 0.137 0.045 6.04 × 10⁻²³
aR2 = coefficient of determination; bLOQ = limit of quantification; cLOD = limit of detection; dANOVA = analysis of variance.
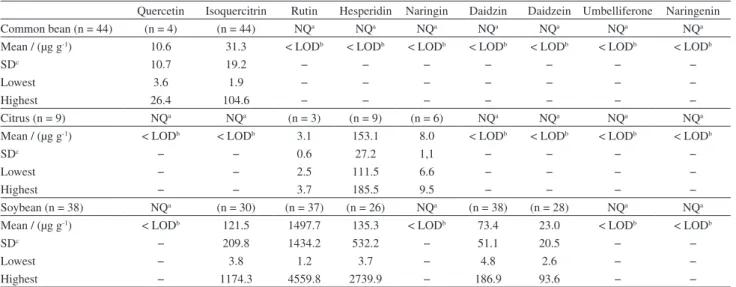
Table 3. Description of data obtained for samples using the proposed method
Quercetin Isoquercitrin Rutin Hesperidin Naringin Daidzin Daidzein Umbelliferone Naringenin
Common bean (n = 44) (n = 4) (n = 44) NQa NQa NQa NQa NQa NQa NQa
Mean / (µg g-1) 10.6 31.3 < LODb < LODb < LODb < LODb < LODb < LODb < LODb
SDc 10.7 19.2 − − − − − − −
Lowest 3.6 1.9 − − − − − − −
Highest 26.4 104.6 − − − − − − −
Citrus (n = 9) NQa NQa (n = 3) (n = 9) (n = 6) NQa NQa NQa NQa
Mean / (µg g-1) < LODb < LODb 3.1 153.1 8.0 < LODb < LODb < LODb < LODb
SDc − − 0.6 27.2 1,1 − − − −
Lowest − − 2.5 111.5 6.6 − − − −
Highest − − 3.7 185.5 9.5 − − − −
Soybean (n = 38) NQa (n = 30) (n = 37) (n = 26) NQa (n = 38) (n = 28) NQa NQa Mean / (µg g-1) < LODb 121.5 1497.7 135.3 < LODb 73.4 23.0 < LODb < LODb
SDc − 209.8 1434.2 532.2 − 51.1 20.5 − −
Lowest − 3.8 1.2 3.7 − 4.8 2.6 − −
Highest − 1174.3 4559.8 2739.9 − 186.9 93.6 − −
in the quantitative analyses of quercetin among different samples of the same matrix shows the importance of the analytical method used in the quality control of nutraceutical foods.
The variation in flavonoid content among samples of the same species was smallest for citrus. Hespedirin was predominant in all samples and detected at the same
concentration in all three species (153.1 ± 27.2 mg kg-1).
Naringin was not found in sweet orange, but was quantified
in sour orange and Tahiti lime. Previous reports indicated that naringin can be used as a biomarker to evaluate the adulteration of sweet orange products by other citrus
species,26 which was confirmed in this work. Rutin was
quantified only in Tahiti lime, which is also in agreement with literature data on the compositions of different citrus varieties; rutin has also been proposed as a cultivar-specific
biomarker for adulteration assays.24,27
Soybean samples were the most diverse in terms of flavonoid composition; discrepancies in the concentrations of isoquercitrin, rutin, hesperidin, daidzin, and daidzein were found among different varieties. Previous reports have indicated that soybean varieties have different flavonoid
compositions that could even be used to group cultivars;28
these reports are corroborated by the findings described above, as the samples obtained from different varieties exhibited remarkable differences in phenotypic traits and susceptibility to herbivores. Variations of over three orders of magnitude were observed in the isoquercitrin, rutin, and hesperidin contents of different soybean varieties, although the presence or absence of the components was generally constant. The identifications of daidzin and daidzein
isoflavones has been widely reported in the literature,29 and
flavonoids such as rutin, hesperidin, and quercetin have also
been identified.30 However, to the best of our knowledge,
this is the first report of cultivars containing high quantities of isoquercitrin. These compounds identified in soybean might be involved in important regional intra- and inter-species interactions such as environmental adaptation, herbivore defense, and plant-pathogen interaction.
As the presence or absence of specific polyphenols within the same species is not considerably different, a polyphenol concentration profile might be employed as an indicator of the analyzed matrix. Thus, the results of this study show the importance of the quality control program during the development and control processes of nutraceutical foods, in which the analyses of polyphenol profiles can be used for qualitative identification in the
certification programs of botanical materials.31
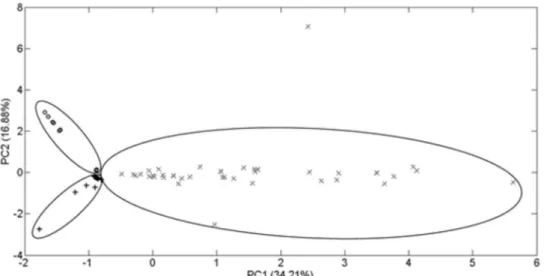
PCA was performed in order to show the clustering of the obtained data for all samples, and a matrix was developed for the quick identification of each botanical material. The data for a total of 91 samples and 7 variables were used to build the matrix. The PCA results and the scores graph are displayed in Figure 3.
The results of the PCA demonstrated that it is possible to separate clusters for each species if a sufficient number of analytes can be quantified. This could be carried out by observing that even though samples from the same species vary in quantity, they are grouped within the same cluster, indicating that the compositions are similar, regardless of Figure 2. Representative total ion chromatogram (TIC) and extracted ion
Figure 3. Score plot PC1 × PC2 using the concentration of polyphenols determined by the quantitative method. ○ Common beans (P. vulgaris); + citrus
flavedo (Citrus spp.); × leaves of soybeans (G. max).
Figure 4. Loading plot for PC1 against PC2: (1) quercetin; (2) isoquercitrin; (3) rutin; (4) hesperidin; (5) naringin; (6) daidzin; (7) daidzein.
concentration. This is especially interesting when developing fail-proof methods for matrix characterization. When only one analyte was detected, the samples became too close to the center, making classification difficult. This highlighted that even though the developed technique has promising applications, there is a need for further improvement; specifically, the number of detected molecules should be increased to better discriminate unknown samples.
Plotting the loadings of PC1 × PC2 enables the contribution of each variable in the clustering process to be determined. The biggest contributions to separation in
PC1 come from rutin, daidzin, and daidzein (3, 6, and 7 in
Figure 4, respectively), which were absent or present at low concentrations in common beans and citrus flavedo but found in higher concentrations in soybean samples. Hesperidin
and naringin (4 and 5, respectively), which were present at
high concentration in citrus flavedo samples, contributed positively to separation for PC2. The negative component
of PC2 is related to the increase in the concentrations of
quercetin and isoquercitrin (1 and 2, respectively), which
were found mainly in the common bean samples.
Conclusions
A HPLC-ESI-MS/MS method was developed to qualify nine different polyphenols in different botanical matrices in a single run. This method was evaluated for
the analysis of P. vulgaris, Citrus spp.,and G. max, which
species were also determined. Moreover, PCA showed that by increasing the number of targeted biomolecules, careful discrimination between samples could be obtained. The database obtained from LC-SRM analysis, which was used to process the PCA results, could cluster the samples according to the species to which they belong. This method can be easily applied in monitoring and quality control programs. Therefore, the combined HPLC-MS and PCA techniques, together with a more comprehensive set of flavonoids, could be an efficient and reliable tool to identify unknown plant samples as well as a high-throughput method for screening natural products for quality control.
Supplementary Information
Supplementary data are available free of charge at http://jbcs.sbq.org.br as PDF file.
Acknowledgements
We would like to thank the CNPq (National Council of Technological and Scientific Development, 477051/2012-0; 301427/2012-7), FAPESP (São Paulo Research Foundation 2011/11860-5), INCT-Biorational Control of Plague Insects, FAPESP (São Paulo Research Foundation), and CAPES (Coordination for the Improvement of Higher Level of Education Personnel) for support during several different projects.
References
1. Bais, H. P.; Weir, T. L.; Perry, L. G.; Gilroy, S.; Vivanco, J. M.;
Annu. Rev. Plant Biol.2006, 57,233.
2. Dixon, R. A.; Pasinetti, G. M.; Plant Physiol.2010, 154, 453.
3. Snyder, B. A.; Nicholson, R. L.; Science1990, 248, 1637. 4. Bais, H. P.; Vepachedu, R.; Gilroy, S.; Callaway, R. M.; Vivanco,
J. M.; Science2003, 301, 1377.
5. Quideau, S.; Deffieux, D.; Douat-Casassus, C.; Pouységu, L.;
Angew. Chem., Int. Ed. 2011, 50, 586.
6. Hollman, P. C. H.; Katan, M. B.; Food Chem. Toxicol. 1999, 37, 937.
7. Wootton-Beard, P. C.; Ryan, L.; Food Res. Int. 2011, 44, 3135.
8. Hwang, S.-L.; Shih, P.-H.; Yen, G.-C.; J. Agric. Food Chem.
2012, 60, 877.
9. Ignat, I.; Volf, I.; Popa, V. I.; Food Chem. 2011, 126, 1821. 10. Obmann, A.; Purevsuren, S.; Zehl, M.; Kletter, C.; Reznicek,
G.; Narantuya, S.; Glasl, S.; Phytochem. Anal.2011, 23, 254. 11. Zucolotto, S. M.; Fagundes, C.; Reginatto, F. H.; Ramos, F. A.;
Castellanos, L.; Duque, C.; Schenkel, E. P.; Phytochem. Anal.
2011, 23, 232.
12. Álvarez-Ospina, H.; Cruz, I. R.; Duarte, G.; Bye, R.; Mata, R.;
Phytochem. Anal. 2012, 24, 248.
13. Lebel, P.; Gagnon, J.; Furtos, A.; Waldron, K. C.; J. Chromatogr. A2014, 1343, 143.
14. Cuyckens, F.; Claeys, M.; J. Mass Spectrom. 2004, 39, 1. 15. Steinmann, D.; Ganzera, M.; J. Pharm. Biomed. Anal. 2011,
55, 744.
16. Khoddami, A.; Wilkes, M. A.; Roberts, T. H.; Molecules2013, 18, 2328.
17. Fulcrand, H.; Mané, C.; Preys, S.; Mazerolles, G.; Bouchut, C.; Mazauric, J.-P.; Souquet, J.-M.; Meudec, E.; Li, Y.; Cole, R. B.; Cheynier, V.; Phytochemistry2008, 69, 3131.
18. Saurina, J.; TrAC, Trends Anal. Chem.2010, 29, 234. 19. International Conference on Harmonisation of Technical
Requirements for Registration of Pharmaceuticals for Human Use (ICH); Validation of Analytical Procedures: Text and MethodologiesQ2(R1);2005, http://www.ich.org/fileadmin/ Public_Web_Site/ICH_Products/Guidelines/Quality/Q2_R1/ Step4/Q2_R1__Guideline.pdf accessed in October 2015. 20. Rodríguez-Solana, R.; Salgado, J. M.; Domínguez, J. M.;
Cortés-Diéguez, S.; Phytochem. Anal.2014, 26, 61.
21. Lin, L.-Z.; Harnly, J. M.; Pastor-Corrales, M. S.; Luthria, D. L.; Food Chem.2008, 107, 399.
22. Kang, J. G.; Hick, L. A.; Price, W. E.; Rapid Commun. Mass Spectrom.2007, 21, 857.
23. Perlatti, B.; da Silva, M. F. G. F.; Fernandes, J. B.; Forim, M. R.;
Bioresour. Technol.2012, 124, 37.
24. Londoño-Londoño, J.; de Lima, V. R.; Lara, O.; Gil, A.; Pasa, T. B. C.; Arango, G. J.; Pineda, J. R. R.; Food Chem.2010, 119, 81.
25. Abu-Reidah, I. M.; Arráez-Román, D.; Lozano-Sánchez, J.; Segura-Carretero, A.; Fernández-Gutiérrez, A.; Phytochem. Anal.2013, 24, 105.
26. Bilbao, M. L. M.; Andrés-Lacueva, C.; Jáuregui, O.; Lamuela-Raventós, R. M.; Food Chem. 2007, 101, 1742.
27. Wang, Y.-C.; Chuang, Y.-C.; Hsu, H.-W.; Food Chem.2008, 106, 277.
28. Lin, H.; Rao, J.; Shi, J.; Hu, C.; Cheng, F.; Wilson, Z. A.; Zhang, D.; Quan, S.; J. Integr. Plant Biol.2014, 56, 826. 29. Rodríguez-Roque, M. J.; Rojas-Graü, M. A.; Elez-Martínez,
P.; Martín-Belloso, O.; Food Chem.2013, 136, 206. 30. Alu’datt, M. H.; Rababah, T.; Ereifej, K.; Alli, I.; Food Chem.
2013, 139, 93.
31. Martí, R.; Valcárcel, M.; Herrero-Martínez, J. M.; Cebolla-Cornejo, J.; Roselló, S.; Food Chem.2015, 169, 169.
Submitted:May 19, 2015
Published online: October 21, 2015