0103 - 5053 $6.00+0.00
* e-mail: [email protected]
Theoretical Studies of Concentrated Aqueous Urea Solutions Using Computacional
Monte Carlo Simulation
Celso A. Bertran*a, José J. V. Cirinob and Luiz C. G. Freitasc
a
Instituto de Química, Universidade Estadual de Campinas, CP 6154, 13083-970, Campinas - SP, Brazil
b
Departamento de Física – ICE, Universidade Federal de Juiz de Fora, 36036-330, Juiz de Fora - MG, Brazil
c
Departamento de Química, Universidade Federal de São Carlos, CP 676, 13565-905, São Carlos - SP, Brazil
Simulações de Monte Carlo foram realizadas para soluções aquosas concentradas de uréia nas concentrações de 4, 5, 6, 7 e 8 mol L-1 no ensemble NpT a 298 K e 1 atm. As superfícies de energia potencial foram representadas pela soma dos potenciais clássicos de Coulomb e de Lennard-Jones, nos quais a aditividade de pares foi considerada. Nas simulações a água foi descrita pelo modelo TIP4P e a uréia por dois modelos: o modelo OPLS planar e um modelo no qual a molécula de uréia não é totalmente planar. Os resultados das simulações para os dois modelos mostraram que a uréia não causa perturbações significativas na estrutura da água, na faixa de concentrações estudadas. No entanto, foi observada diminuição do número médio de ligações de hidrogênio entre as moléculas de água. Para as soluções mais concentradas os resultados obtidos com o modelo OPLS sugerem a formação de dímeros de uréia. Observou-se similaridade entre alguns dos resultados das simulações obtidos com os modelos: OPLS planar e não-planar da uréia , nas mesmas concentrações e condições.
Monte Carlo simulations were carried out for concentrated aqueous urea solutions at 4, 5, 6, 7 and 8 mol L-1 in the NpT ensemble at 298 K and 1 atm. The potential energy surfaces were represented by the sum of Coulomb and Lennard-Jones potentials in which pair-wise additivity was considered. Water was described by the TIP4P model, while urea was described by the OPLS planar model and also by a proposed non-planar model. The simulation results for both urea models showed that urea does not induce any significant changes in the structure of water over all the concentrations studied. However, it was noted that the number of hydrogen bonds between the water molecules decrease as the concentration increases. The simulation results of the OPLS planar model suggest the formation of urea dimers in the more concentrated solutions. The simulations with the non-planar model showed several features similar to those of the OPLS planar model.
Keywords: urea, Monte Carlo, liquid simulation
Introduction
Urea is a substance that has been studied for many years due to its important physico-chemical properties, especially in concentrated aqueous solutions. Properties such as protein denaturation,1 solubility enhancement of
hydrocarbons in water,2 inhibition of micellar aggregation3
and formation of quasi-ideal solutions with water4 have
been associated with urea in aqueous solution. Recently, urea was reported to play an important role in the homogeneity of some ceramic materials prepared by sol-gel routes.5-7
Various experimental studies of aqueous urea solutions were published in the last 30 years, trying to establish a model for urea’s action in terms of urea-water interactions, but until now, the published results are not in agreement. Frank and Franks,8 for instance, pointed out that the
hydrogen bonds between water molecules are destroyed. Infrared studies9 showed an increase in the intensity of the
O-H stretching band, which also suggests a weakening of the hydrogen bonds between water molecules as a result of urea addition. On the other hand, Stokes4 affirmed that
the water structure is essentially unchanged and that urea molecules can form dimers in solution. Raman studies10
did not show any evidence of urea dimers in dilute solutions. More recently, Hoccart and Turrell11 published
concluded that urea does not form dimers in solution, even in more concentrated solutions. They also suggested that the water structure is a result of dipole-dipole interactions instead of hydrogen bonds.
In the field of computational chemistry the theoretical studies of Kuharski and Rossky,12 Nakanishi,13 Tanaka et al.,14 Cobos et al.15 and Åstrand et al.16 showed no influence
of urea on the structure of water. These authors suggested that urea was able to enter the structure of water causing little perturbation.
In the present work, Monte Carlo statistical simulations were used to investigate the thermodynamics and structure of aqueous urea solutions over a wide range of concen-trations. Two urea molecular geometries were used: a planar one derived from crystallographic determinations on solid urea, and the another one, slightly non planar, as predicted by ab initio calculations.
Computational Details
Intermolecular potential function
The potential energy between two molecules a and b
is described by the sum of the Coulomb and Lennard-Jones potentials,
$
"
Hij GiGj Hij ij ij Hij ij Hij
- = + e s - s (1)
å
å
= b j ij a iab - H
- (2)
where rij is the distance between site i on molecule a and
site j on molecule b, and qk is the partial point charges of the sites. The parameters
ij and ij for non-diagonal
interactions were obtained by the same combining rules used by Duffy et al.: 17
ij = (ij) 1/2 and
ij = (ij)
1/2 (3)
Models for urea
Two different models for urea molecules were used in this work. The geometry of the first model was obtained from published crystallographic data18 and for the other
model, the ab initio geometry was calculated at the MP2/ MC-311G(d,p) level.19 While the crystallographic data
show an essentially planar structure for urea, the ab initio calculation predicts a non-planar structure.19
The Lennard-Jones parameters and partial point charges for the planar urea OPLS model were obtained from the work of Duffy et al.17 For the non-planar model, the same
Lennard-Jones parameters were used and the point charges were obtained from ab initio calculation with the CHELPG20 procedure. Both models are summarized in
Table 1. For water molecules the TIP4P model21 was used.
Monte Carlo Simulations
Thermodynamics and structural properties of con-centrated aqueous urea solutions were determined with the use of the Diadorim22 program, which employs a
Metropolis Monte Carlo method. Periodic boundary conditions in the NpT ensemble were adopted at 298 K and 1 atm and the minimal image convention was used. Cubic boxes with 360 molecules were used and the ratio between urea and water molecules was adjusted to reproduce the range of concentrations of interest. According to the Metropolis algorithm, new configurations generated in the simulation procedure should be obtained through translations and rotations of a randomly chosen molecule in the simulation box. The ranges permitted for the translations and rotations for the chosen molecule were set to provide an acceptance of about 40-60% of all the motions attempted. For urea molecules, the ranges for translations and rotations were set to 0.011 nm and 11 degrees, respectively. For water molecules the corres-ponding values were set to 0.015 nm and 15 degrees.
After every 1000 configurations, one volume change of the box was attempted and the range of volume change was set to 0,180 nm3 to provide the same ratio of
acceptance for the new generated configurations. The interactions between any pair of sites were calculated within a cut-off radius of 1.1 nm. No long-range corrections to the Lennard-Jones potential were made beyond the cut-off radius, provided that its contribution to the total intermolecular energy was less than 2%.23 The simulation
boxes were equilibrated by the generation of 1106
configurations and for the averaging procedure, 3106
additional configurations were generated.
The error bars of the equilibrium averages are calculated according to the expressions:24
å
= -= run run run t t t t s (4)å
= = run ))run run
t t t t (5)
This approach assumes that A() is a Gaussian function
and that <A>run is the average of property A evaluated in simulations of
run configurations in the Monte Carlo
Results and Discussion
Simulation with OPLS urea model
The Monte Carlo simulations were carried out in the following concentrations: 4, 5, 6, 7 and 8 mol L-1. This
range was chosen because an interesting behavior of the experimental density of the urea solutions was noted as a function of the concentration and is illustrated in Figure 1, where the first derivative is also plotted. The inflexion point near 6 mol L-1 may be interpreted as a slight expansion
of the whole solution as the concentration is raised from 0 to 6 mol L-1. After this point the solutions appear to contract,
which suggests that the solution is less densely packed at the concentration of 6 mol L-1. This phenomenon may be
related to other important properties of aqueous urea solutions.
The Lennard-Jones intermolecular potential parameters of the OPLS urea model, described in Table 1, were obtained from the works of Duffy et al.17 and Jorgensen and Swenson,25 and the geometric data came from a crystal
electron diffraction study.18
The results for the calculated densities and heats of
vaporization (
vapH) of the studied solutions are
summarized in Table 2 and are in good agreement with the experimental values. As can be noted, errors are less than
0.4% for the densities and around 4% for
vapH. The
experimental vaporization enthalpies have been obtained
from vapor pressure data25 and the densities of urea solutions
at 298 K were taken from reference 26.
Although the OLPS urea model was optimized to reproduce the experimental densities and heats of vaporization of dilute urea solutions, these properties were well reproduced for urea solutions at high concentrations as well as was the behavior of the derivative of the density plot (not shown).
The average interaction energies of urea-urea (Euu), urea-water (Euw), water-water (Eww) and the total energy are plotted in Figure 2. This energy partition is a consequence of the adopted pair additivity approximation, which is represented in equation 6:
ET = Euu + Euw + Eww (6)
The energies Euu, Euw, and Eww show a similar behavior to the interaction energies in a quasi-ideal mixture, that change almost linearly with the molar fraction.
Table 1. Point charges and Lennard-Jones parameters for the urea
models. LJ parameters are the same for both models
Site q (e) q (e)* (kJ mol-1) (Å)
C 0.142 0.963 0.439 3.75
O 0.390 0.578 0.879 2.96
N 0.542 1.004 0.711 3.25
H 0.333 0.406 0.000 0.00
*non-planar urea model
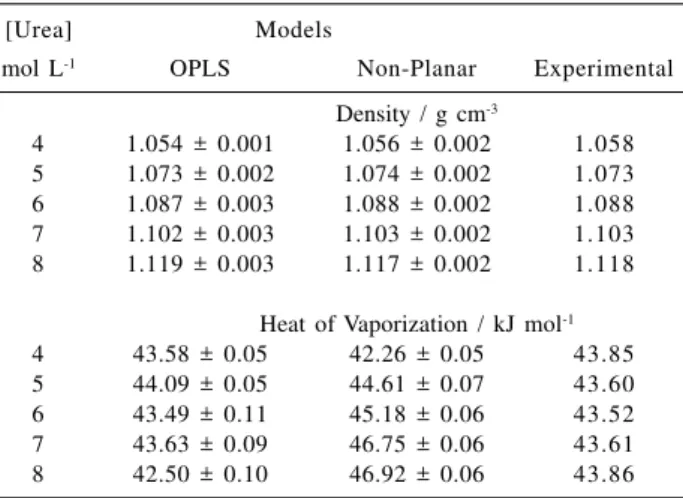
Table 2. Calculated densities and heats of vaporization of the OPLS
and non-planar urea mixtures
[Urea] Models
mol L-1 OPLS Non-Planar Experimental
Density / g cm-3
4 1.054 ± 0.001 1.056 ± 0.002 1.058
5 1.073 ± 0.002 1.074 ± 0.002 1.073
6 1.087 ± 0.003 1.088 ± 0.002 1.088
7 1.102 ± 0.003 1.103 ± 0.002 1.103
8 1.119 ± 0.003 1.117 ± 0.002 1.118
Heat of Vaporization / kJ mol-1
4 43.58 ± 0.05 42.26 ± 0.05 43.85
5 44.09 ± 0.05 44.61 ± 0.07 43.60
6 43.49 ± 0.11 45.18 ± 0.06 43.52
7 43.63 ± 0.09 46.75 ± 0.06 43.61
8 42.50 ± 0.10 46.92 ± 0.06 43.86
Figure 1. Density of urea solutions27 and the first derivative as a function of concentration
The contribution of Euu to the total energy (ET) is very small in the range of concentrations studied, when compared to Euw and Eww. Euu represents only about 3% of the total energy in the least concentrated solution and its contribution to ET increases almost linearly until the most concentrated one. The interaction energy between water molecules is lowered as the solution becomes more concentrated. In the most concentrated solution we observe that Euw is almost equal to Eww suggesting that urea molecules interact with water in almost the same manner as water molecules with other water molecules.
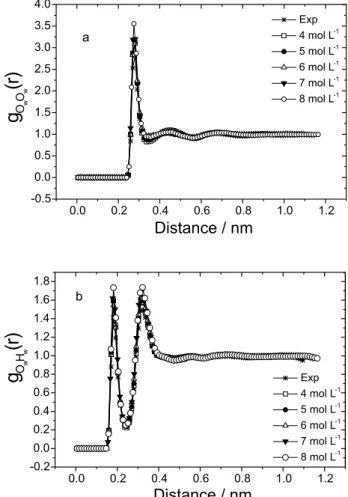
The possible influence of urea on the local water structure can be verified by comparing the radial distribution function (rdf) of pure water to that of the water in urea solutions. The comparison between gOwOw (r) and gOwHw (r) is shown in Figure 3. The first peaks in the plots of gOwOw (r) in Figure 3a show a strong correlation between oxygen atoms near 0.28 nm. Its shape and position are practically unaffected as the urea concentration is changed. The variation of the concentration of urea only causes a small change in the intensity of the peaks of g(r).
The radial distribution functions are defined by equation 7 that shows an inverse dependence of g(r) with rj, the numerical density of sites j.24
j ij
ij
r
r
r
r
r
N
r
g
r
p
D
D
+
=
4
)
,
(
)
(
(7)When urea is added to obtain more concentrated solutions, rj is slightly lowered resulting in an increase of the intensities of peaks in the rdf of water.
The integration of gOwOw(r) from 0 to the first minimum of the non-normalized g(r) functions, shown in Figure 3a, results in the average number of water molecules in its first hydration shell. For pure water it is almost equal to 5 and for the urea + water mixtures, this number is 4, as is shown in Table 3.
The second peak of the rdf plots, shown in Figure 3a, is correlated with the second hydration shell of water. Only a
limited change in the position of this peak was observed, which suggests that urea addition in this concentration range does not disturb the tetrahedral structure of water.
Figure 3b shows the gOwHw(r) rdf, which is correlated with the hydrogen bonds between water molecules. As observed in the previous case, the peaks maintain their shape and positions and are almost invariant from pure water to the most concentrated solution. However, the integration of gOwHw(r) shown in Table 3 indicates significant reduction of
Table 3. Coordination numbers (n) between urea OPLS and water sites obtained from integration of the first peaks of the radial distribution
functions
[Urea]* nOuHu nCuCu nOuHw nCuOw nHuOw nOwOw nOwHw N
0 0.0 0.0 0.0 0.0 0.0 4.8 4.0 0.0
4 0.5 2.2 2.3 15.2 2.8 4.2 1.8 5.1
5 0.5 2.5 2.3 18.0 2.8 4.1 1.7 5.1
6 0.6 3.1 2.4 16.7 2.7 4.1 1.5 5.1
7 0.8 4.2 2.0 16.1 2.4 3.9 1.6 4.4
8 1.0 5.0 1.9 16.9 2.4 3.7 1.4 4.3
*mol L-1 N is the total number of urea-water hydrogen bonds
Figure 3. Experimental radial distribution functions of pure water
the number of hydrogen bonds between water molecules, in agreement with experimental data.8
The results of gOwHw(r) rdf and the integration of the first peak indicate that the addition of urea does not cause a significant perturbation in the water structure, although 50% of the water hydrogen bonds were broken. This conclusion, that the water structure in not disturbed when half of the hydrogen bonds are broken, is apparently contradictory. However, Hoccart and Turrell11 suggested
that the water structure could be maintained by dipole-dipole interactions.
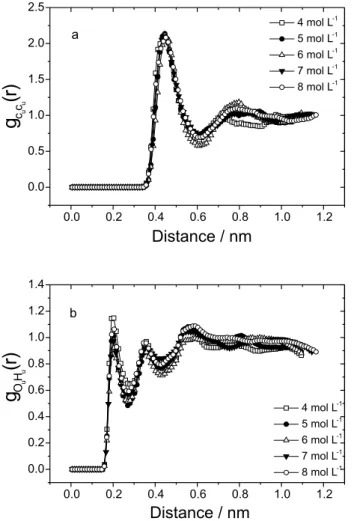
Figure 4 shows the radial distribution functions gCuCu(r) and gOuHu(r) for urea molecules. The first peak of the gOuHu(r) plots, shown in Figure 4b, indicates that hydrogen bonds between urea molecules are centered at about 0.20 nm and the first peak of the gCuCu(r), in Figure 4a, shows that the average distance between these sites (located near the center of mass of the molecule and correlated with the distribution of urea molecules around a reference urea molecule) is about 0.45 nm and does not change with concentration.
The integration of the first peaks in Figures 4b and 4a gives the average number of hydrogen bonds between urea molecules and the average number of urea molecules around a reference urea molecule, as given in Table 3. The increase of the average number of hydrogen bonds and the average number of neighbors can be explained by the tendency of urea to form dimers as the concentration is raised. The energetics of urea-urea interactions, shown in Figure 2, support the conclusions based on the radial distribution functions. This result is in agreement with the experimental observations of Stokes4 and other theoretical investigations,15,16 but it is
contrary to other experimental studies.10,11
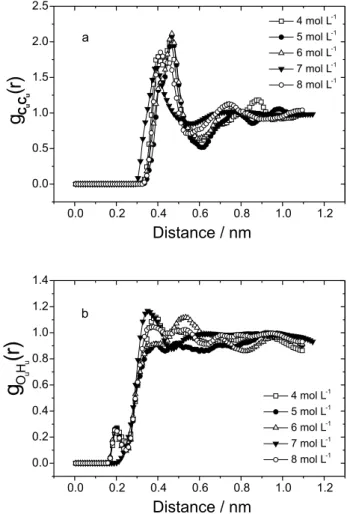
Figures 5a and 5b show the gOuHw(r) and gHuOw(r) radial distribution functions between urea and water sites. The results of the integration (nOuHw and nHuOw) of these rdf (Table 3) show that urea forms hydrogen bonds with water and the average number of these bonds is about 5 in the most dilute solutions, in good agreement with the work of Duffy et al.17 Although the first peak of the g
HuOw(r) rdf is
less than unity, the integration shows that there are hydrogen bonds in this site of urea.
Figure 5. OPLS calculated radial distribution functions between
urea and water molecules in the urea + water mixtures. a) gOuHw(r), b)
gHuOw(r)
Figure 4. OPLS calculated radial distribution functions of urea
The average distance between the centers of mass of urea and water, indicated by the gCuOw(r) rdf in Figure 6, is about 0.4 nm . The corresponding peak of the 6 mol L-1
solution is broader than the others, indicating that, at this concentration, the water molecules are, on the average, more distant from urea molecules, characterizing a less densely packed solution, in very good agreement with the behavior of the experimental and calculated densities shown in Figure 1.
Simulation withnon-planar urea model
In this section, we studied a proposed model for urea in which the hydrogen atoms are out of the plane of the heavy atoms, with dihedral angles of cis and trans hydrogen atoms of about 13 and 150 degrees, respectively.19 The same
concentrations of the previous urea model were used, as well as the Monte Carlo simulation conditions. The intermolecular Lennard-Jones potential parameters were transferred from the planar urea model and the charges were derived from electrostatic potential grid20 (CHELPG)
calculations using the software Gaussian 94.29 The
non-planar urea model, described in Table 1, has a lower dipole moment (3.2 D) than either the OPLS model (4.9 D) or the experimental value (5.7 D).30
The calculated densities and vaporization enthalpies for non-planar urea solutions are shown in Table 2. The results for densities are very good, but we obtained some large deviations in the calculations of the enthalpy of vaporization. In this non-planar model, the less densely packed effect of the 6 mol L-1 solution was not observed.
The partition of the total configurational energy was also analyzed in this model of urea by the pair-wise additivity approximation. The total average configu-rational energy (ET) and the contribution of the individual
pair interaction energies of urea-urea (Euu), urea-water (Euw) and water-water (Eww) to ET show a similar behavior of these partial interaction energies as does the OPLS urea model. Thus, non-planar urea aqueous solutions are also quasi-ideal solutions.
The similarity observed for the interaction energies between the OPLS and the non-planar models was also observed for the gOwOw(r) and gOwHw(r) rdf, for the average number of water molecules in its first hydration shell and for the same significant reduction of the number of hydrogen bonds between water molecules.
Figures 7a and 7b present the gCuCu(r) and gOuHu(r) rdf for non-planar urea sites, where the most significant differences between the non-planar and OPLS urea models are noted . In the non-planar urea model, there is essentially no interaction between urea molecules. The integration of the first peak of gOuHu(r) rdf shows that the average number of hydrogen bonds (nOuHu) is 0.1 in the concentration range studied.
The first peak of gCuCu(r) shows some splitting that is not to be expected and may be due to the small basis set used to optimize the intermolecular potential.
Figure 6. OPLS calculated radial distribution functions between
urea and water molecules in the urea + water mixtures. gCuOw(r)
Figure 7. Non-planar calculated radial distribution functions of
The integration of the first peak of the radial distribution functions gOuHw(r) and gHuOw(r) results in 3 hydrogen bonds between urea and water while there are 5 hydrogen bonds in the OPLS urea model. The difference of the dipole moment between the two urea models may be the cause for the reduction in the number of hydrogen bonds.
Conclusions
Thermodynamic and structural results from liquid state simulations showed that urea has a tendency to form dimers when the concentration of the solutions is above 6 mol L-1.
Moreover, its aqueous solutions exhibit a quasi-ideal solution behavior in the range of concentrations studied. No significant perturbations of the water structure were evident from the data of the radial distribution functions, even in a mixture with a concentration of 8 mol L-1. The
number of hydrogen bonds between water molecules was observed to decrease with the addition of urea; however, the whole structure of water was kept unchanged. Most of the results of the simulations for the non-planar urea solutions were similar to those of the OPLS urea model simulations. There is a difference in the description of the interaction between two urea molecules that was not well described by the intermolecular potential used, which is presumably due to the basis set chosen to minimize the structure and to calculate the charge distributions over the atoms.
The results of the simulation with the two urea molecule models show that urea does not disturb the structure of water, even in a highly concentrated solution. Urea appears to enter the water structure as if it was a large water molecule.
Acknowledgements
The authors are grateful for financial support from CNPq (Conselho Nacional de Desenvolvimento Científico e Tecnológico ) and FAPEMIG (Fundação de Amparo à Pesquisa do Estado de Minas Gerais).
References
1. Brandts, J. F.; Hunts, L. J.; J. Am. Chem. Soc. 1967, 89, 4826. 2. Wetlaufer, D. B.; Malik, S. K.; Stoller, L.; Coffin, R. I.; J. Am.
Chem. Soc. 1964, 86, 508.
3. Shick, M. J.; J. Phys. Chem. 1964, 68, 3585.
4. Stokes, R. H.; Aust. J. Chem. 1967, 20, 2087.
5. Bertran, C. A.; Macedo, M. I. F.; Oliveira, M. A. S.; Thim, G. P.; J. Eur. Ceramic Soc. 2001, 21, 759.
6. Bertran, C. A.; Thim, G. P.; Lima, P. T.; An. Ass. Bras. Quim. 1996, 45, 142.
7. Lima, P. T.;Bertran, C. A.; Quim. Nova1998, 21, 608.
8. Frank, H. S.; Franks, F. J.; J. Chem. Phys. 1968, 48, 4768.
9. Holtzen, A.; Emerson, M. F.; J. Phys. Chem. 1969, 73, 26. 10.Hoccart, X.; Turrell, G.; J. Chem. Phys. 1993, 99, 8498.
11. Hoccart, X.; Turrell, G.; J. Mol. Struct. 1995, 349, 41. 12. Kuharski, R. A.; Rossky, P. J.; J. Am. Chem. Soc. 1984, 106,
5786.
13. Nakanishi, K.; Chem. Soc. Rev. 1993, 177.
14. Tanaka, H.; Touhara, H.; Nakanishi, K.; Watanabe, N.; J. Chem. Phys. 1984, 80, 5170.
15. Tanaka, H.; Nakanishi, K.; Touhara, H.; J. Chem. Phys. 1984, 82, 5184; Hernández-Cobos, J.; Ortega-Blake, I.;
Bonilla-Marín, M.; Moreno-Bello, M.; J. Chem. Phys.1993, 99, 9122. 16. Åstrand, P. O.; Wallqvist, A.; Karlstrom, G.; Linse, P.; J. Chem.
Phys. 1991, 95, 8419.
17. Duffy, E. M.; Severance, D. L.; Jorgensen, W. L.; Isr. J. Chem. 1993, 33, 323.
18. Swaminathan, S.; Craven, B. M.; McMullan, R. K.; Acta Cryst. B1984, B40, 300.
19. Cirino, J. J. V.: PhD Thesis, Universidade Estadual de Campinas,
Brazil, 1999.
20. Brenneman, C. M.; Wiberg, K. B.; J. Comput. Chem. 1990, 11, 361.
21. Jorgensen, W. L.; J. Chem. Phys. 1979, 71, 5034.
22. Freitas, L. C. G.; Programa Diadorim, Universidade Federal de São Carlos, Brazil, 1992.
23. Freitas, L. C. G.; Cordeiro, J. M. M.; Garbujo, F. L. L.; J. Mol. Liq. 1999, 79,1.
24. Allen, M. P.; Tildesley, D. J.; Computer Simulation of Liquids, Oxford: London, 1987, p. 191.
25. Jorgensen, W. L.; Swenson, C. J.; J. Am. Chem. Soc. 1985, 107, 569.
26. Perman, E. P.; Lovett, T.; Trans. Faraday Soc. 1926, 22, 1. 27. Egan Jr., E. P.; Luff, B. B.; J. Chem. Eng. Data 1966, 11, 192.
28. West, R. C., ed.; Handbook of Chemistry and Physics, 58th ed., CRC Press: New York, 1978.
29. Frisch, M. J.; Trucks, G. W.; Schlegel, H. B.; Gill, P. M. W.; Johnson, B. G.; Robb, M. A.; Cheeseman, T. K.; Petersson, G. A.; Montgomery, J. A.; Raghavachari, K.; Al-Laham, M. A.; Zakrzewski, V. G.; Ortiz, J. V.; Foresman, J. B.; Cioslowski, J.; Stefanov, B. B.; Nanayakkara, A.; Challacombe, M.; Peng, C. Y.; Ayala, P. Y.; Chen, W.; Wong, M. W.; Andres, J. L.; Replogle, E. S.; Gomperts, R.; Martin, R. L.; Fox, D. J.; Binkley, J. S.; Defrees, D. J.; Baker, J.; Stewart, J. J. P.; Head-Gordon, M.; Gonzalez, C.; Pople, J. A.; Gaussian 94, Revision D.2, Gaussian, Inc, 1995. 30. Gaumann, T.; Helv. Chim. Acta1958, 41B, 1965.
Received: January 3, 2001 Published on the web: March 18, 2002