http://dx.doi.org/10.1590/bjpt-rbf.2014.0121 original article
398 Braz J Phys Ther. 2015 Sept-Oct; 19(5):398-409
Multicenter trial of motion analysis for injury risk
prediction: lessons learned from prospective longitudinal
large cohort combined biomechanical -
epidemiological studies
Timothy E. Hewett1, Benjamin Roewer2, Kevin Ford4,5,6, Greg Myer2,3,4,5
ABSTRACT | Our biodynamics laboratory group has conducted large cohort biomechanical-epidemiological studies targeted at identifying the complex interactions among biomechanical, biological, hormonal, and psychosocial factors
that lead to increased risk of anterior cruciate ligament (ACL) injuries. The indings from our studies have revealed highly sensitive and speciic predictors for ACL injury. Despite the high incidence of ACL injuries among young athletes, larger cohorts are needed to reveal the underlying mechanistic causes of increased risk for ACL injury. In the current study, we have outlined key factors that contribute to the overall success of multicenter, biomechanical-epidemiological investigations designed to test a larger number of athletes who otherwise could not be recruited, screened, or tested at a single institution. Twenty-ive female volleyball players were recruited from a single high school team and tested at three biodynamics laboratories. All athletes underwent three-dimensional motion capture analysis of a drop vertical jump task. Kinematic and kinetic variables were compared within and among laboratories. Reliability of peak kinematic variables was consistently rated to-excellent. Reliability of peak kinetic variables was consistently rated good-to-excellent within sites, but greater variability was observed between sites. Variables measured in the sagittal plane were typically more reliable than variables measured in the coronal and transverse planes. This study documents the reliability of biomechanical variables that are key to identiication of ACL injury mechanisms and of athletes at high risk. These indings indicate the feasibility of executing multicenter, biomechanical investigations that can yield more robust, reliable, and generalizable indings across larger cohorts of athletes.
Keywords: ACL; adolescents; knee injuries; drop vertical jump; prevention.
HOW TO CITE THIS ARTICLE
Hewett TE, Roewer B, Ford K, Myer G. Multicenter trial of motion analysis for injury risk prediction: lessons learned from prospective longitudinal large cohort combined biomechanical - epidemiological studies. Braz J Phys Ther. 2015 Sept-Oct; 19(5):398-409. http://dx.doi.org/10.1590/bjpt-rbf.2014.0121
1 Mayo Clinic, Rochester, MN, USA
2 Sports Health & Performance Institute, The Ohio State University, Columbus, OH, USA
3 Departments of Physiology and Cell Biology, Orthopaedic Surgery, Family Medicine and Biomedical Engineering, The Ohio State University,
Columbus, OH, USA
4 Division of Sports Medicine, Cincinnati Children’s Hospital Medical Center, Cincinnati, OH, USA
5 Department of Pediatrics and Orthopaedic Surgery, College of Medicine, University of Cincinnati, Cincinnati, OH, USA
6 Department of Physical Therapy, School of Health Sciences, High Point University, High Point, USA
Received: Feb. 05, 2015 Revised: May 12, 2015 Accepted: July 02, 2015
Introduction
Our multicenter, multidisciplinary research group
has conducted several collaborative, multi-institutional
studies that included reliability comparisons of biomechanical and neuromuscular data from three
different sites – the Biodynamics Laboratories at Cincinnati Children’s Hospital (CCH or Site A), The Ohio State University (OSU or Site B) and the University of Kentucky (UK or Site C) – using identical
data collection, reduction techniques, data processing
methods, and data analyses. Reliability studies of this
kind, as with any such impactful study, are important
for the establishment of widespread generalizability, reliability, reproducibility, and acceptability of multicenter
collected data. The authors have previously tested and measured the longitudinal reliability and validity of
all of the data collected during testing from one site
at Cincinnati Children’s Hospital (CCH)1. In order to
conduct a proper measurement of the validity of these prospective cohort study indings, we track injuries prospectively so that we can effectively use these data
Reliability of a prospective biomech trial
399 Braz J Phys Ther. 2015 Sept-Oct; 19(5):398-409 Long-term objectives of multicenter
biomechanical-epidemiologic studies
The primary objectives of our Multicenter Biomechanical-Epidemiologic studies are to determine how individuals become more susceptible to injury, prospectively identifying those athletes
who are more susceptible to injury and to determine the underlying mechanistic cause(s) of increased
risk at the biomechanical level and to optimize the effectiveness of treatments designed to prevent these
injuries. Towards these goals, we test hypotheses
related to multiple biomechanical variables: lower
extremity bone length and body mass maturational stage; neuromuscular performance; whole limb and whole body posture; trunk, hip, and knee joint loading; and injury risk in subsets of athletes.
Our research group has many ongoing studies and
our research interests and activities can be broken down into three areas of study: 1) Mechanistic Studies
using In Sim approaches that combine multiple in vivo, in vitro, cadaveric, computer modeling, and animal
model approaches to answer the most pertinent questions
in our ield; 2) High-Risk Individuals Studies using evidence-based medicine (EBM) datasets to determine
which athletes are at increased risk for anterior cruciate
ligament (ACL) injuries; and 3) Preventive Studies using Randomized Controlled Trial (RCT) designs to determine which interventions decrease risk for ACL
injuries in large cohort populations. We also employ
dual identifying and preventive studies using EBM techniques and datasets and RCT designs to determine which interventions are most eficacious in speciic athletes, both individuals and groups, which are at
increased risk for ACL injuries.
School and community-based research partnerships
Over the past two decades, we have collaborated
with large public geographic county-based schools.
Our primary methods of recruitment were data-driven,
state-of-the-art presentations and cutting-edge tools
used in areas of particular interest, as they it nicely into school administrators’ overall objectives. These
school administrators included superintendents, athletic directors, principals, teachers, and coaches.
Our primary objectives with these studies have been
to collaborate with school administrators, coaches, students, and parents to gain support for our coupled
Biomechanical-Epidemiologic studies, to design and develop screening protocols to identify high-risk athletes who demonstrate identiiable neuromuscular
control deicits that put them at risk, and to develop and implement neuromuscular training interventions to decrease injury risk. Our overall objectives for the
current theoretical construct include understanding the
United States’ National Institute of Health (NIH) funding
opportunities; technology options for recruiting and
retention; tracking options for study/trial management; tips to help avoid time delays in study implementation
and to detail technical research methods and tool options and methods.
Multicenter trial of motion analysis for injury risk prediction in school settings: experimental approach & methods
The goals of our experimental approach are to
determine the injury risk predictive role of speciic
factors such as trunk, hip, and knee position; strength and muscle recruitment at the hip and knee; hip and knee load and neuromuscular control, i.e. adolescent growth and increases in tibia and femur length; and body mass in athletes. Our group utilizes what we
term a ‘Top-down & Bottom-Up’ administrative
approach to implement these studies. We begin our explorations of the school systems with school administrators including superintendents, athletic directors, and principals. We then contact coaches, athletic trainers (ATs), and teachers to get their full support with these research studies.
Overall couple biomechanical-epidemiologic approach
For over a decade, we have conducted prospective longitudinal large cohort combined
biomechanical-epidemiological studies. ACL injury
risk has proven to be a complex, multi-faceted problem that involves biomechanical, biological, hormonal, and psychosocial factors. We have tested the hypothesis
that measures related to dynamic lower extremity
valgus will prove predictive of ACL injury risk in high-risk female athletes. For example, Myer et al.2
demonstrated that female athletes with increased knee
recurvatum had signiicantly increased risk of ACL
injury. We also demonstrated that increased lateral trunk displacement following quick-release perturbation
was indicative of increased risk of anterior cruciate
ligament injury in females, but not males3. In another longitudinal study, we showed that there were changes in both knee joint and general joint laxity with growth
and development that differ between females and
Hewett TE, Roewer B, Ford K, Myer G
400 Braz J Phys Ther. 2015 Sept-Oct; 19(5):398-409
kinematics to dynamic stability of the knee and the
reliability of our 3D Motion Analysis measures1.
We utilized a prospective longitudinal design in county-based school-sponsored soccer, volleyball, and
basketball teams from multiple school systems that
we recruited, tested, and tracked. Female and male
subjects from high school and junior high school were
screened prior to the start of multiple consecutive soccer, volleyball, and basketball seasons. Graphs depicting the standardized means with standard deviations from the demographic variables of the subject population
are shown in Figures 1 and 2.
Subject recruiting
For over two decades, our research group has recruited hundreds of high school teams that have yielded thousands of soccer, volleyball, and basketball players
who were pre-screened, trained, and post-screened5. We faced multiple challenges recruiting soccer players at junior high schools in the public county school
systems. Some of the junior high schools did not have organized teams. We have addressed this challenge via recruitment of teams outside the county system
(e.g. non-public, parochial schools located in the
same county geographic area) in order to ill in all of our randomized blocks. In addition, we captured
those junior high school athletes who went on to play
high school soccer, volleyball, and basketball within
the county school system.
Multicenter reliability biostatistical analyses: biomechanical data
Careful biostatistical analysis should be performed by experienced biostatisticians and biomechanical
proiles should be created for each of the screening movements. Standardized values should be used, as the variables are on different scales with varying mean values. Due to underlying normality assumption, it was necessary to transform some relevant variables to the
loge scale. In addition, the correlations between variables needed to be accounted for, in particular maximum hip and knee angles and moments. We continue to examine biostatistical models and will check them
against data to determine any emergent predictive proiles. Comparison of mean variables, with and
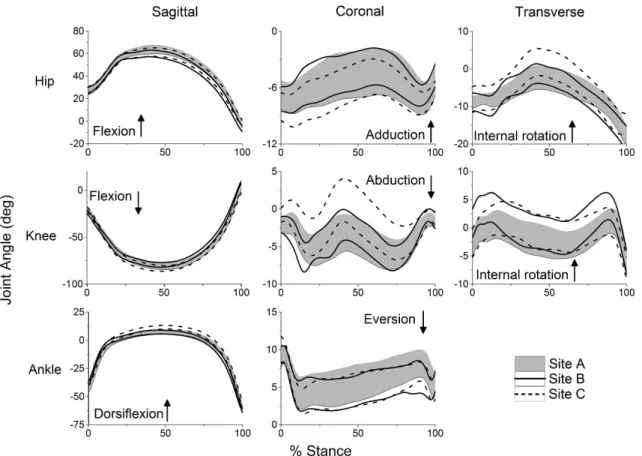
Figure 1. Time series for hip, knee and ankle angles time-normalized to 100% of stance. Lines represent upper and lower 95% conidence
Reliability of a prospective biomech trial
401 Braz J Phys Ther. 2015 Sept-Oct; 19(5):398-409 without adjustment for potential confounders, should
also be the focus of future analyses.
Method
A total of 25 volleyball players from a single High School team were screened in August of 2011. Testing was completed over two weeks in that month. All subjects provided informed consent approved by the institutional review boards at the University of Cincinnati, Cincinnati, OH, USA, The Ohio State University, Columbus, OH, USA, and University of Kentucky, Lexington, KY, USA (approval number 2011H0075, 022-11, and 08-0573, respectively). Each subject was instrumented with forty-three (43) 9-mm retrorelective markers by a different research assistant at each laboratory site. Markers were placed over the spinous process of C7; the midpoint
between the suprasternal notch and the second costal
notch of the sternum; the L5-S1 spinal junction; left
posterior superior iliac spine; and bilaterally on the shoulders, upper arms, elbows, wrists, anterior superior
iliac spines (ASIS), greater trochanters, mid thighs,
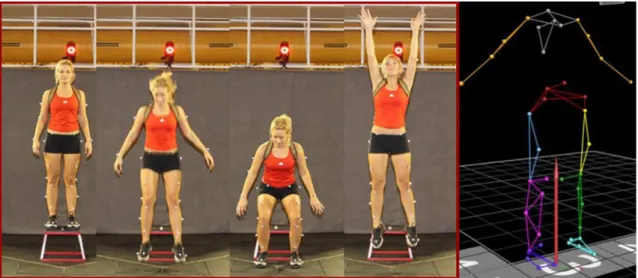
medial and lateral knee joint lines, tibial tubercles, distal and lateral shanks (i.e. lower part of leg), and medial and lateral ankles, as shown in Figure 3. Subjects wore
a small backpack outitted with three non-collinearly
placed markers. Each subject wore the same make and
model of shoes with markers permanently afixed to the heels, dorsal surface of the mid foot, ifth metatarsal, and superior surface of the toe. Marker position and force
data were collected using commonly accepted motion analysis techniques. A static trial was recorded with the subject standing in a neutral anatomical alignment with
his/her foot placement standardized to the laboratory coordinate system. Subjects performed three drop vertical jump (DVJ) maneuvers from a height of 31 cm. Their feet were initially positioned 35 cm apart, and
the subjects were instructed to drop off the plyometric
box and perform a maximal vertical jump, reaching up towards a target placed directly overhead of the force plates at the height of their maximum vertical jump,
as seen in Figure 3.
Data collected at each of the three sites were
obtained using similar equipment and sampling
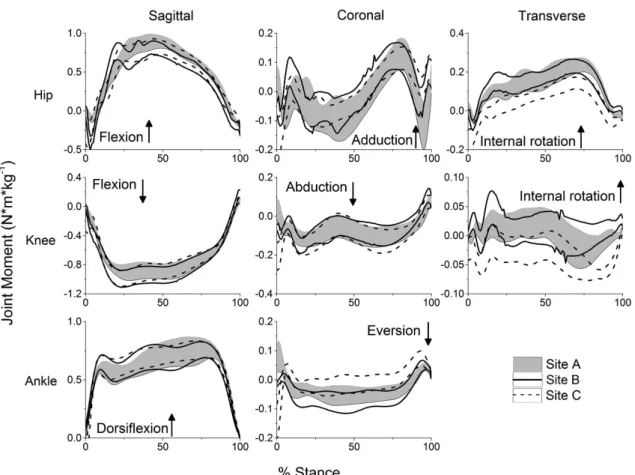
Figure 2. Time series for hip, knee and ankle moments time-normalized to 100% of stance. Lines represent upper and lower 95%
Hewett TE, Roewer B, Ford K, Myer G
402 Braz J Phys Ther. 2015 Sept-Oct; 19(5):398-409
frequencies. Different personnel collected data and
instructed subjects at each site. A detailed equipment
list is speciied in Table 1.
We had internally veriied that 3-D marker position data collected simultaneously on Vicon (VICON, Oxford Metrics Ltd., London, UK) and Motion Analysis (Motion Analysis Corp., Santa Rosa, CA, USA) camera systems using the same 240 Hz sampling
frequency and the same data reduction techniques
yielded no signiicant differences in computed joint
angles6. Data collection procedures were developed
and optimized in order to collect reliable and valid data on a team of athletes (approximately 25 athletes)
in under 3 hours. We utilized multiple stations that included separate check-in, anthropometrics, marker placement, instruction, and data collection.
This provided an opportunity for a large number of
personnel to be appropriately trained in a few key areas instead of a few personnel taking on multiple
responsibilities. Data collection forms with trial names
and randomization order were produced prior to the
data collection session and populated via scripting
techniques within the motion capture software.
A two-step process was utilized to check the quality of the marker coordinates and to determine proper
tracking identiication. First, a technician from each
laboratory performed the quality control of each trial detailing any potential errors within a spreadsheet.
Potential errors, such as marker misidentiication and small gaps, were immediately ixed. Secondly, a senior researcher reviewed the trials and addressed any additional concerns with the data. Gaps in marker position data of less than 10% of the marker sampling frequency (Sites A and B ≤24 frames; Site C ≤20 frames) were interpolated using a cubic spline ill. Due to the inherent high hip and trunk lexion in
combination with clothing, small 9mm markers, and
the rapid rate of data collection, larger gaps in ASIS
marker position data were present in a number of
subjects. Based on the results of this study, we have now modiied camera placement and include redundant pelvis markers. Gaps in ASIS marker position data greater than 10% but less than 25% of the marker sampling frequency were interpolated using a virtual marker ill based on the ixed relative distance from the contralateral ASIS marker and hip joint center
Figure 3. Example of the marker set used in this study as seen during the drop vertical jump (DVJ) task (left). Computerized representation
of the marker used in this study (right).
Table 1. Summary of motion capture data collection equipment and techniques used at each data collection site.
Site A B C
Camera System 10-camera Motion Analysis 8-camera Vicon 18-camera Motion Analysis Force platforms AMTI (600 x 900mm) Bertec (300 x 600mm) Bertec (600 x 900mm) Sampling frequency
(marker / force) 240 Hz/1200 Hz 240 Hz/1200 Hz 200 Hz/1000 Hz
Data processing software Motion Analysis Cortex Vicon Nexus Motion Analysis Cortex
Reliability of a prospective biomech trial
403 Braz J Phys Ther. 2015 Sept-Oct; 19(5):398-409
and the sacrum. Our lab has internally validated this approach and veriied that it creates an acceptable
amount of root mean square error when joint angle
curves are compared between real and virtual illed ASIS marker data. It also creates no clinically relevant
differences in peak computed joint angles.
Motion data were subsequently processed through Visual 3D (v4.86, C-motion Inc. Germantown, MD, USA) using batch scripts via the motion capture software and Matlab (vR2012b, Mathworks Inc. Natick, MA, USA). All marker and force data were subsequently iltered using a low-pass fourth-order Butterworth ilter, sampling at 12 Hz, and post-processed using the same custom Visual 3D and Matlab coding to compute lower extremity joint Euler angles. Force data and
computed kinematic data were used to compute joint moments. All joint kinematic and kinetics data from
each trial were exported from Visual 3D and plotted as an additional quality control step. We have found this identiies a small percentage of erroneous data
from incorrect model based analyses that would not
be identiied when batch processing large amounts
of data.
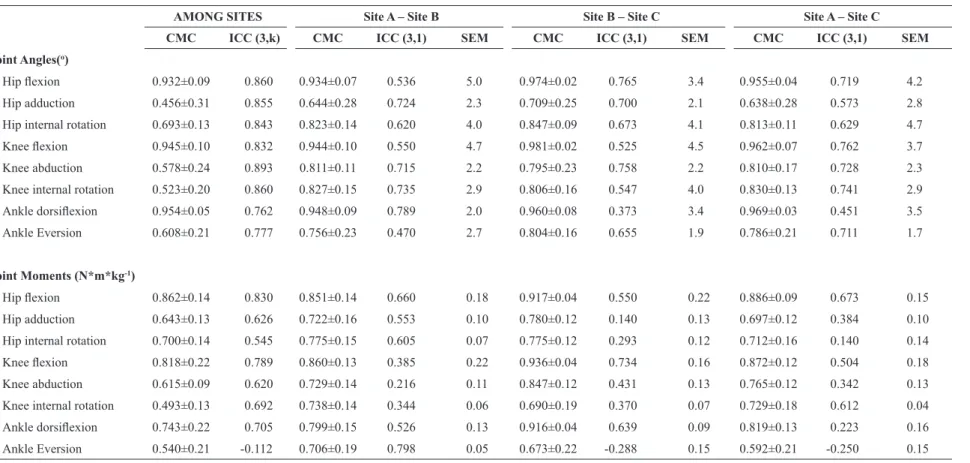
Peak hip, knee, and ankle angles and moments were calculated during stance from the DVJ using Visual 3D. Stance was deined as the time period between initial contact and take-off (i.e. when the vertical ground reaction force (GRF) exceeded 10N and subsequently fell below 10 N). The average of three trials was used
in the current analysis. A two-way, random-effects
model of intraclass correlation coeficients (ICC)
were used to compute the reliability of peak angles and moments from trial-to-trial at each site (3,k),
between each combination of sites (3,1), and among all three sites (3,k). ICC values were classiied as ICC>0.75 = excellent, 0.4≤ICC≤0.75 = good, or ICC<0.4 = poor7. Coeficients of multiple correlation
(CMC) were also computed using the methods described
by Kadaba et al.8 to measure the variability of joint
angle and moment waveforms during stance at each
site, between each combination of sites, and among all three sites8. Standard error of the measurement
(SEM) for each peak kinematic and kinetic variable was also computed and reported. Subject demographic
information was compared across sites using an
Analysis of Variance with one repeated measure. A priori signiicance was set at α<0.05.
Results
The average (± standard deviation) age of subjects at the time of the irst testing session (Site A) was 15.3±1.0 years. The average height and mass at the
same time point were 169.3±4.5 cm and 62.3±6.8 kg, respectively. There were no signiicant changes in height (p=0.248) or body mass (p=0.096) during the
study period.
Kinematics
The reliability of peak kinematic variables among all three sites was rated as excellent (Range: 0.762-0.893; Table 2). There was greater variability in waveforms among all three sites, and CMCs ranged from 0.456 to 0.954. All sagittal-plane waveforms had CMCs >0.9, whereas none of the coronal- or transverse-plane waveforms had CMCs greater than 0.7.
Between sites, there were only four instances in which the reliability of peak kinematics variables
was rated as excellent (Table 2). The majority of peak
variables were rated as good. Peak ankle dorsilexion between sites A and B was the only kinematic variable rated as poor; however, it had the greatest CMC value
among all between-site comparisons.
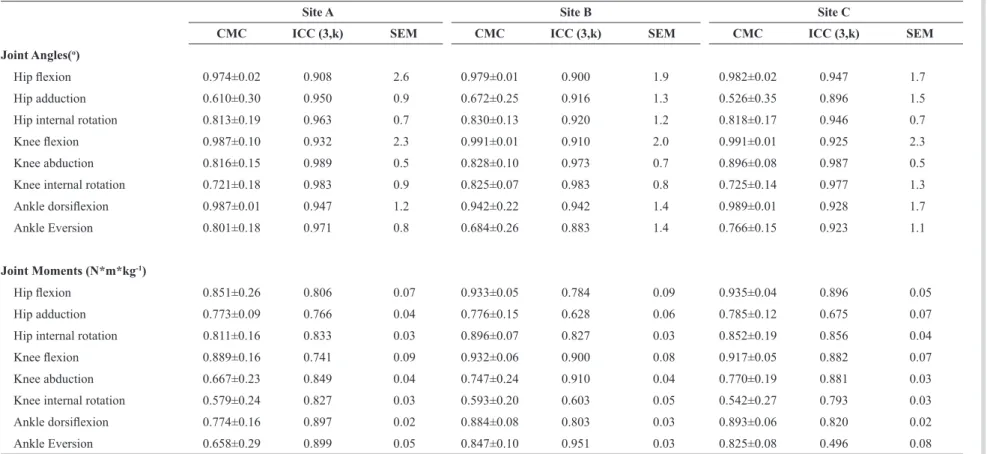
Within each site, the reliability of peak kinematic
variables from trial-to-trial was consistently rated as excellent. CMCs varied from 0.526 to 0.991 (Table 3).
CMCs for each variable were greater in the sagittal plane than the coronal and transverse planes.
Kinetics
The reliability of peak kinetic variables among sites varied greatly (range: –0.112-0.830) (Table 2). ICCs were greatest in the sagittal plane for each variable. CMC values varied from 0.493 to 0.862 and were
consistently greatest in the sagittal plane for each
variable.
Between sites, there was only one instance in which ICCs were rated as excellent. The remaining
comparisons were rated as good or poor. Kinetic
waveforms for each variable had CMC values that were either similar or slightly less than the respective kinematic waveforms.
Within each site, the reliability of peak kinetic
variables from trial-to-trial was consistently rated as excellent with only ive instances in which reliability
was rated as good (Table 3). The kinetic waveforms
had CMC values similar to their respective kinematic
comparisons.
Discussion
In general, the kinematic data were reliable and reproducible for use in large multicenter trials. However,
the reliability of the kinetic data did not appear to be
H
ew
ett TE, R
oew
er
B, F
or
d K, My
er G
404
Br
az J Ph
y
s Ther
. 2015 Sept-Oct; 19(5):398-409
Table 2. Between-site reliability for peak kinematic and kinetic variables.
AMONG SITES Site A – Site B Site B – Site C Site A – Site C
CMC ICC (3,k) CMC ICC (3,1) SEM CMC ICC (3,1) SEM CMC ICC (3,1) SEM
Joint Angles(o)
Hip lexion 0.932±0.09 0.860 0.934±0.07 0.536 5.0 0.974±0.02 0.765 3.4 0.955±0.04 0.719 4.2
Hip adduction 0.456±0.31 0.855 0.644±0.28 0.724 2.3 0.709±0.25 0.700 2.1 0.638±0.28 0.573 2.8
Hip internal rotation 0.693±0.13 0.843 0.823±0.14 0.620 4.0 0.847±0.09 0.673 4.1 0.813±0.11 0.629 4.7
Knee lexion 0.945±0.10 0.832 0.944±0.10 0.550 4.7 0.981±0.02 0.525 4.5 0.962±0.07 0.762 3.7
Knee abduction 0.578±0.24 0.893 0.811±0.11 0.715 2.2 0.795±0.23 0.758 2.2 0.810±0.17 0.728 2.3
Knee internal rotation 0.523±0.20 0.860 0.827±0.15 0.735 2.9 0.806±0.16 0.547 4.0 0.830±0.13 0.741 2.9
Ankle dorsilexion 0.954±0.05 0.762 0.948±0.09 0.789 2.0 0.960±0.08 0.373 3.4 0.969±0.03 0.451 3.5 Ankle Eversion 0.608±0.21 0.777 0.756±0.23 0.470 2.7 0.804±0.16 0.655 1.9 0.786±0.21 0.711 1.7
Joint Moments (N*m*kg-1)
Hip lexion 0.862±0.14 0.830 0.851±0.14 0.660 0.18 0.917±0.04 0.550 0.22 0.886±0.09 0.673 0.15
Hip adduction 0.643±0.13 0.626 0.722±0.16 0.553 0.10 0.780±0.12 0.140 0.13 0.697±0.12 0.384 0.10
Hip internal rotation 0.700±0.14 0.545 0.775±0.15 0.605 0.07 0.775±0.12 0.293 0.12 0.712±0.16 0.140 0.14
Knee lexion 0.818±0.22 0.789 0.860±0.13 0.385 0.22 0.936±0.04 0.734 0.16 0.872±0.12 0.504 0.18
Knee abduction 0.615±0.09 0.620 0.729±0.14 0.216 0.11 0.847±0.12 0.431 0.13 0.765±0.12 0.342 0.13
Knee internal rotation 0.493±0.13 0.692 0.738±0.14 0.344 0.06 0.690±0.19 0.370 0.07 0.729±0.18 0.612 0.04
Ankle dorsilexion 0.743±0.22 0.705 0.799±0.15 0.526 0.13 0.916±0.04 0.639 0.09 0.819±0.13 0.223 0.16 Ankle Eversion 0.540±0.21 -0.112 0.706±0.19 0.798 0.05 0.673±0.22 -0.288 0.15 0.592±0.21 -0.250 0.15
R
eliability of a pr
ospecti
v
e biomech trial
405
Br
az J Ph
y
s Ther
. 2015 Sept-Oct; 19(5):398-409
Table 3. Within-site, trial-to-trial reliability.
Site A Site B Site C
CMC ICC (3,k) SEM CMC ICC (3,k) SEM CMC ICC (3,k) SEM
Joint Angles(o)
Hip lexion 0.974±0.02 0.908 2.6 0.979±0.01 0.900 1.9 0.982±0.02 0.947 1.7
Hip adduction 0.610±0.30 0.950 0.9 0.672±0.25 0.916 1.3 0.526±0.35 0.896 1.5
Hip internal rotation 0.813±0.19 0.963 0.7 0.830±0.13 0.920 1.2 0.818±0.17 0.946 0.7
Knee lexion 0.987±0.10 0.932 2.3 0.991±0.01 0.910 2.0 0.991±0.01 0.925 2.3
Knee abduction 0.816±0.15 0.989 0.5 0.828±0.10 0.973 0.7 0.896±0.08 0.987 0.5
Knee internal rotation 0.721±0.18 0.983 0.9 0.825±0.07 0.983 0.8 0.725±0.14 0.977 1.3
Ankle dorsilexion 0.987±0.01 0.947 1.2 0.942±0.22 0.942 1.4 0.989±0.01 0.928 1.7
Ankle Eversion 0.801±0.18 0.971 0.8 0.684±0.26 0.883 1.4 0.766±0.15 0.923 1.1
Joint Moments (N*m*kg-1)
Hip lexion 0.851±0.26 0.806 0.07 0.933±0.05 0.784 0.09 0.935±0.04 0.896 0.05
Hip adduction 0.773±0.09 0.766 0.04 0.776±0.15 0.628 0.06 0.785±0.12 0.675 0.07
Hip internal rotation 0.811±0.16 0.833 0.03 0.896±0.07 0.827 0.03 0.852±0.19 0.856 0.04
Knee lexion 0.889±0.16 0.741 0.09 0.932±0.06 0.900 0.08 0.917±0.05 0.882 0.07
Knee abduction 0.667±0.23 0.849 0.04 0.747±0.24 0.910 0.04 0.770±0.19 0.881 0.03
Knee internal rotation 0.579±0.24 0.827 0.03 0.593±0.20 0.603 0.05 0.542±0.27 0.793 0.03
Ankle dorsilexion 0.774±0.16 0.897 0.02 0.884±0.08 0.803 0.03 0.893±0.06 0.820 0.02
Ankle Eversion 0.658±0.29 0.899 0.05 0.847±0.10 0.951 0.03 0.825±0.08 0.496 0.08
Hewett TE, Roewer B, Ford K, Myer G
406 Braz J Phys Ther. 2015 Sept-Oct; 19(5):398-409
sites to train individuals. This kinetic data may also be useful for biofeedback training. For instance, feedback
regarding position and technique during sports-related
movements may increase an athlete’s awareness and
allow him or her to make adjustments during training.
Using real-time kinematic biofeedback may provide an intriguing option for delivering augmented feedback and could maximize the effectiveness of traditional neuromuscular intervention programs. Recent studies with real-time gait retraining have reinforced the concept of providing critical feedback with detailed real-time
motion analysis data9-11. Multiple studies support the
idea that real-time feedback modiied potential risk factors related to different knee pathologies. Both immediate and long-term improvements have been identiied9-11.
Challenges of Multicenter Biomechanical-Epidemiologic Studies
Subject Recruiting
We have faced and met many challenges recruiting
subjects (i.e. the athletes) in school systems, but to
a greater extent at the junior high school level than the high school level in the county school systems. For example, some of the county junior high schools do not have organized sports teams. We addressed
this challenge by recruiting teams from recreational leagues and parochial (religious) schools within the county and adjoining counties in order to capture those athletes who go on to play high school sports within the school system.
Data Quality Control
Teams at all sites completed their data processing pipeline for the biomechanical analyses. With data
collected and processed over multiple sites, it was found that a small percentage of movement trials had incorrectly tracked markers, even though all trials had been inspected by a human operator. Due to the high volume of data, it was not possible to do a more
thorough inspection of the raw data; therefore, two
data veriication steps were added to the processing pipeline. The irst step involved a complete tracking
quality control step at the home site. The second step
processed the marker trajectories using a simpliied
skeleton model with a few degrees of freedom. When presented with incorrectly tracked marker coordinates, this analysis reported an error because the
simpliied skeleton was unable to it the data. Trials
where this error was detected were sent back to the
human operator for re-tracking, and the others were processed further into joint kinematics and kinetics. A third quality control step was added at the end of the biomechanics pipeline. A human operator looked at
groups of curves representing the main biomechanical variables, each curve representing one trial. Outlying curves were identiied and the marker tracking of those trials was re-examined for correctness. If correct, the data was used for further statistical analysis. If not,
marker tracking was corrected or, if the data was corrupted or incomplete, the trial was discarded.
The authors are currently developing a fourth quality control step using a conidence interval-based approach
for automatic detection of outliers.
Peak versus Mean Variable Values
Our research group normally reports both peak
and mean variable values across the entire stance
phase in our studies12. We attempt to mitigate the effects of potential moment artifacts by reporting the
peak values averaged across three trials per subject. For example, peak KAM occurs approximately 50ms
after initial contact during a run-cut, a time at which
joint moment artifacts are likely to occur. Conversely, peak KAM during a DVJ does not always occur soon
after initial contact when large artifacts are likely to
occur. Considering the stance time of a typical DVJ is approximately 400 msec, the peak KAM would occur closer to 100ms and therefore not located where
impact artifacts occur during a run-cut13.
Data Filtering
How one decides to ilter and analyze motion
data is both an art and a science that requires careful consideration of both the tasks being analyzed and
the outcome variables of interest. For these reasons, there are several subtleties and some possible laws in other studies that warrant clariication. Our research team understands the beneits of testing the reliability
of kinematic and kinetic data at matched cutoff
frequencies and we have been iltering our motion data at matched frequencies for several years1,14-16.
However, universally dismissing studies that use
unmatched cutoff frequencies or suggesting that earlier
conclusions should be reconsidered – speciically, those from our 2005 study12 – is unfounded. We must
Reliability of a prospective biomech trial
407 Braz J Phys Ther. 2015 Sept-Oct; 19(5):398-409 go on to suffer an injury and those who did not. Thus,
if properly designed, prospective cohort data will result in valid and reliable indings.
The effects of iltering may render measured biomechanical variables less reliable as injury prediction tool than previously thought. This is why it
is important that authors report the reliability of their
data. If investigators do not report the reliability of
their measures in their study paper or elsewhere in the literature, their conclusions should be interpreted with caution.
Data Limitations-Differences in Movement tasks-validity, reliability issues
It is likely incorrect for investigators to assume
that differences in kinematic and kinetic (moment)
calculations for one movement directly relate to all other movements that involve high-impact accelerations. For example, it has been shown that relative loads may vary greatly between a drop vertical jump (DVJ) and a cutting movement. All movement tasks that are subject to large forces and accelerations fall victim to a certain degree of speciicity of angles, loads, and artifacts. For example, a run-cut task is subject to much
larger frontal-plane forces and segment accelerations
than a DVJ task; therefore, Knee Abduction Moment (KAM) measured during a run-cut task is likely more sensitive to cutoff frequency than KAM measured during a DVJ. However, large artifacts are typically reserved for the planes of motion in which these large forces and accelerations occur. For example,
Kristianslund et al.17 reported a mean peak KAM
between 75-150 Nm during a run-cut task, whereas we reported mean peak KAM between 15-45 Nm during a DVJ17. We also previously compared a DVJ to a
jump stop side-cut movement and reported signiicant differences in KAM and Knee Abduction Angle (KAA) between the two movements16. An analysis of our most
recent DVJ data indicate that iltering frequency may have only a small effect on the magnitude of peak KAM, and a negligible effect on the relative ranking of subjects based on peak KAM18.
Validity of Conclusions and Interpretation of Findings
In order to conduct a proper measurement of the validity of investigators’ conclusions from a coupled biomechanical-epidemiologic cohort prospective trial, one would need to examine the idelity with which injuries were prospectively tracked before a study of any task can be effectively evaluated for injury
risk assessment. There are also many potential bias problems introduced in poorly designed cohort and
intervention trials. Potential biases abound such as
selection bias, reporting bias, and absence of blinding.
For example, in a recent study published as a Level One trial in The American Journal of Sports Medicine, signiicant limitations in the design of the study may have affected the results and their interpretation19.
Each coach and all of the athletes knew whether or not
they had been assigned to the intervention program,
and all were well aware of the expected outcomes of using the program, which had a track record of reducing injuries. This knowledge could potentially
have led to a placebo effect among players using the intervention – there was no placebo or “sham”
treatment to blind the researchers or study subjects.
In addition, the players on the teams that did not use the intervention were older (almost two years older on average), taller, and heavier than the athletes on the
teams that took part in the program. One would expect more injuries in bigger, taller athletes independent
of the intervention. At the most basic level, simple
physics apply – the bigger the study subject is, the harder he or she will fall.
Injury tracking – an important effector of validity of follow-up
In order to conduct a proper measurement of the validity of our indings and conclusions, one would need to track injuries prospectively before a run-cut task could be effectively used for injury risk assessment. Many studies are not designed properly
to answer the questions upon which they speculate. A properly designed study requires an approach that includes apples-to-apples comparisons of groups and to other studies using identical data collection, reduction techniques, injury tracking methods, and analyses.
Replication of any study is important for its tenets to
gain widespread acceptability. ACL-injury risk factors
have proven to be complex and multifaceted with
mechanical, biological, hormonal, and psychosocial
components. KAM and KAA are certainly prominent, predictive markers for ACL injury risk, and have been repeatedly validated10,20-23, but are only two of many
important factors. We have new data that indicates that KAA may be as strong a predictor as KAM. These data are important as we move forward with
our secondary kinematic two-dimensional analyses
Hewett TE, Roewer B, Ford K, Myer G
408 Braz J Phys Ther. 2015 Sept-Oct; 19(5):398-409
Significance of coupled biomechanical-epidemiologic study findings
The indings of these coupled biomechanical-epidemiologic studies should provide a foundation
for approaching both the mechanistic questions
underlying injury risk disparities between individuals
and groups, such as sexes, as well as increase our ability
to direct high-risk athletes to effective, neuromuscular interventions targeted at speciic, measured deicits related to pubertal growth and development.
We performed these parallel studies at the three sites all within two weeks of one another. The goals
of these studies were to develop the reliability across
sites in a large cohort in order to conduct large multicenter randomized controlled trials. We tested and
cross-validated three different biodynamics laboratories (at OSU, CCH, and UK) to collect data on the same
medium-sized cohort of subjects. This resulted in adequate statistical power and allowed us to examine
injury events as both secondary and primary outcomes. Though KAA and KAM are prominent markers for ACL injury risk and have been demonstrated repeatedly
to predict increased ACL injury risk12,24, but are only
two of many potentially important factors. We have
new data that indicates that knee abduction angle may
be as strong a predictor as KAM. This is important as we move forward with our secondary kinematic 2D analyses and development of more comprehensive and generalizable clinic-based predictive models.
Summary and conclusions
This extended study method developed with a
multi-institutional, multidisciplinary team will likely yield more robust results with increased generalizability
and applicability to diverse populations. The additional analyses will provide a foundation for addressing important mechanistic questions; however, they are
extremely costly and time-consuming and require
assistance. Nevertheless, the added approaches proposed in this supplement will foster the development of a
clinician-friendly assessment tool that will enhance the translation of the study results into use in the medical community.
We suggest future collaborative, multicenter,
multi-institutional studies that include apples-to-apples comparison of data grouped across sites using identical data collection, reduction techniques, injury tracking
methods, and analyses. Replication of any study is
important for establishing widespread acceptability.
Injury risk factors have proven to be a complex,
multifaceted problem with biological, hormonal,
mechanical, and psychosocial factors. For example, KAM is certainly a prominent marker for ACL injury
risk and has been demonstrated repeatedly, but it is
only one of many important factors. We have new
data that indicates that knee abduction angle may be
as strong a predictor as KAM. This is important as we move forward with our secondary kinematic 2D analyses and developing more comprehensive and generalizable clinic-based predictive models.
Future directions and plans
Our research consortium continues to utilize a
prospective longitudinal design for school-sponsored
soccer and basketball teams from multiple school systems, which are recruited, tested, and tracked.
Female and male subjects from high schools and junior
high schools are being screened prior to the start of
each consecutive soccer, volleyball, and basketball seasons. We have tested the basketball players for several consecutive years. We have previously tested and measured the longitudinal reliability and validity
of all of the data collected during testing from one site at CCH1. The biomechanics and sports medicine research communities should continue to utilize these
analyses to evaluate both the pre-test proiles as well as to determine the effects of prospective randomized
controlled trial study designs. We will conduct sports
injury surveillance on all of the athletes for two consecutive years following the athletes’ enrollment
into the study.
References
1. Ford KR, Myer GD, Hewett TE. Reliability of landing 3D motion analysis: implications for longitudinal analyses. Med Sci Sports Exerc. 2007;39(11):2021-8. http://dx.doi. org/10.1249/mss.0b013e318149332d. PMid:17986911. 2. Myer GD, Ford KR, Paterno MV, Nick TG, Hewett TE. The
effects of generalized joint laxity on risk of anterior cruciate ligament injury in young female athletes. Am J Sports Med. 2008;36(6):1073-80. http://dx.doi.org/10.1177/0363546507313572. PMid:18326833.
3. Zazulak BT, Hewett TE, Reeves NP, Goldberg B, Cholewicki J. Deficits in neuromuscular control of the trunk predict knee injury risk: a prospective biomechanical-epidemiologic study. Am J Sports Med. 2007;35(7):1123-30. http://dx.doi. org/10.1177/0363546507301585. PMid:17468378. 4. Quatman CE, Ford KR, Myer GD, Paterno MV, Hewett TE.
The effects of gender and pubertal status on generalized joint laxity in young athletes. J Sci Med Sport. 2008;11(3):257-63. http://dx.doi.org/10.1016/j.jsams.2007.05.005. PMid:17597005. 5. Hewett TE, Xu YY, Ford KR, Khoury JC, Myer GD.
Reliability of a prospective biomech trial
409 Braz J Phys Ther. 2015 Sept-Oct; 19(5):398-409 potential predictors of increased acl injury risk: randomized
controlled trial. In: Proceedings of the 37th Annual Meeting of the American Society of Biomechanics; 2013 Sept 4-7; Omaha, NE: Publisher; 2013. page 452.
6. Mcnally MP, Roewer BD, Hewett TE. Inter-rater reliability of two commercial 3d motion capture systems. In: Proceedings of the 37th Annual Meeting of the American Society of Biomechanics; 2013 Sept 4-7; Omaha, NE: Publisher; 2013. page 445.
7. Fleiss JL. The design and analysis of clinical experiments. New York: John Wiley & Sons; 1986. http://dx.doi. org/10.1002/9781118032923.
8. Kadaba MP, Ramakrishnan HK, Wootten ME, Gainey J, Gorton G, Cochran GV. Repeatability of kinematic, kinetic, and electromyographic data in normal adult gait. J Orthop Res. 1989;7(6):849-60. http://dx.doi.org/10.1002/jor.1100070611. PMid:2795325.
9. Hewett TE, Myer GD, Ford KR, Paterno MV, Quatman CE. The 2012 ABJS Nicolas Andry Award: The sequence of prevention: a systematic approach to prevent anterior cruciate ligament injury. Clin Orthop Relat Res. 2012;470(10):2930-40. http://dx.doi.org/10.1007/s11999-012-2440-2. PMid:22744203. 10. Myer GD, Ford KR, Khoury J, Succop P, Hewett TE. Clinical
correlates to laboratory measures for use in non-contact anterior cruciate ligament injury risk prediction algorithm. Clin Biomech (Bristol, Avon). 2010;25(7):693-9. http://dx.doi. org/10.1016/j.clinbiomech.2010.04.016. PMid:20554101. 11. Myer GD, Schmitt LC, Brent JL, Ford KR, Barber Foss KD,
Scherer BJ, et al. Utilization of modified NFL combine testing to identify functional deficits in athletes following ACL reconstruction. J Orthop Sports Phys Ther. 2011;41(6):377-87. http://dx.doi.org/10.2519/jospt.2011.3547. PMid:21289456. 12. Hewett TE, Myer GD, Ford KR, Heidt RS Jr, Colosimo AJ, McLean SG, et al. Biomechanical measures of neuromuscular control and valgus loading of the knee predict anterior cruciate ligament injury risk in female athletes: a prospective study. Am J Sports Med. 2005;33(4):492-501. http://dx.doi. org/10.1177/0363546504269591. PMid:15722287. 13. Ford KR, Myer GD, Toms HE, Hewett TE. Gender
differences in the kinematics of unanticipated cutting in young athletes. Med Sci Sports Exerc. 2005;37(1):124-9. http://dx.doi.org/10.1249/01.MSS.0000150087.95953.C3. PMid:15632678.
14. Ford KR, Shapiro R, Myer GD, Van Den Bogert AJ, Hewett TE. Longitudinal sex differences during landing in knee abduction in young athletes. Med Sci Sports Exerc. 2010;42(10):1923-31. http://dx.doi.org/10.1249/ MSS.0b013e3181dc99b1. PMid:20305577.
15. Ford KR, Myer GD, Hewett TE. Longitudinal effects of maturation on lower extremity joint stiffness in adolescent athletes. Am J Sports Med. 2010;38(9):1829-37. http://dx.doi. org/10.1177/0363546510367425. PMid:20522830. 16. Cowley HR, Ford KR, Myer GD, Kernozek TW, Hewett TE.
Differences in neuromuscular strategies between landing
and cutting tasks in female basketball and soccer athletes. J Athl Train. 2006;41(1):67-73. PMid:16619097.
17. Kristianslund E, Krosshaug T, van den Bogert AJ. Effect of low pass filtering on joint moments from inverse dynamics: implications for injury prevention. J Biomech. 2012;45(4):666-71. http://dx.doi.org/10.1016/j.jbiomech.2011.12.011. PMid:22227316.
18. Roewer BD, Ford KR, Myer GD, Hewett TE. The ‘impact’ of force filtering cut-off frequency on the peak knee abduction moment during landing: artefact or ‘artifiction’? Br J Sports Med. 2014;48(6):464-8. http://dx.doi.org/10.1136/ bjsports-2012-091398. PMid:22893510.
19. Longo UG, Loppini M, Berton A, Marinozzi A, Maffulli N, Denaro V. The FIFA 11+ program is effective in preventing injuries in elite male basketball players: a cluster randomized controlled trial. Am J Sports Med. 2012;40(5):996-1005. http://dx.doi.org/10.1177/0363546512438761. PMid:22415208. 20. Myer GD, Ford KR, Khoury J, Hewett TE. Three-dimensional
motion analysis validation of a clinic-based nomogram designed to identify high ACL injury risk in female athletes. Phys Sportsmed. 2011;39(1):19-28. http://dx.doi.org/10.3810/ psm.2011.02.1858. PMid:21378483.
21. Myer GD, Ford KR, Khoury J, Succop P, Hewett TE. Development and validation of a clinic-based prediction tool to identify female athletes at high risk for anterior cruciate ligament injury. Am J Sports Med. 2010;38(10):2025-33. http://dx.doi.org/10.1177/0363546510370933. PMid:20595554. 22. Myer GD, Ford KR, Khoury J, Succop P, Hewett TE. Biomechanics laboratory-based prediction algorithm to identify female athletes with high knee loads that increase risk of ACL injury. Br J Sports Med. 2011;45(4):245-52. http://dx.doi.org/10.1136/bjsm.2009.069351. PMid:20558526. 23. Padua DA, Marshall SW, Boling MC, Thigpen CA, Garrett
WE Jr, Beutler AI. The Landing Error Scoring System (LESS) Is a valid and reliable clinical assessment tool of jump-landing biomechanics: The JUMP-ACL study. Am J Sports Med. 2009;37(10):1996-2002. http://dx.doi. org/10.1177/0363546509343200. PMid:19726623. 24. Paterno MV, Schmitt LC, Ford KR, Rauh MJ, Myer GD,
Huang B, et al. Biomechanical measures during landing and postural stability predict second anterior cruciate ligament injury after anterior cruciate ligament reconstruction and return to sport. Am J Sports Med. 2010;38(10):1968-78. http:// dx.doi.org/10.1177/0363546510376053. PMid:20702858.
Correspondence Timothy E. Hewett