Printed in Brazil - ©2007 Sociedade Brasileira de Química 0103 - 5053 $6.00+0.00
Article
*e-mail: [email protected]
Multi-site PM
2.5and PM
2.5-10Aerosol Source Apportionment in Rio de Janeiro, Brazil
Daniela S. Soluri,a Maria Luiza D. P. Godoy,a José Marcus Godoy*,a,b and Luiz Alfredo Roldãob
a
Departamento de Química, Pontifícia Universidade Católica do Rio de Janeiro, Rua Marquês de São Vicente 225, Gávea, 22453-900 Rio de Janeiro-RJ, Brazil
b
Instituto de Radioproteção e Dosimetria, Comissão Nacional de Energia Nuclear, CP 37750, Barra da Tijuca, 22642-970 Rio de Janeiro-RJ, Brazil
Foi realizada a amostragem de aerossol em dez locais distribuídos em diferentes regiões da cidade do Rio de Janeiro, de setembro/2003 a setembro/2004, em uma base semanal com amostragens de 24 horas. As frações do aerossol PM2.5 e PM2.5-10 foram amostradas usando um
sistema com filtros em série. Foram determinadas: a massa do aerossol, carbono elementar, a concentração dos íons solúveis, assim como a concentração total de alumínio, cálcio, ferro, magnésio, potássio, sódio e titânio. A concentração mássica média anual do PM10 variou de 18 a 38 µg m-3, sem violação dos padrões brasileiros de qualidade do ar. Para as frações fina e
grossa, entre 70 e 90% da massa medida foi identificada como sendo devido à poucas fontes, sendo que a poeira do solo explica 37-63% da massa da fração grossa (PM2.5-10). Por outro lado,
o carbono elementar e o aerossol secundário representam proporções elevadas (45-58%) da massa da fração fina (PM2.5).
Aerosol sampling was performed at ten sites distributed in different location of Rio de Janeiro city, from September/2003 to Sepetember/2004, on a weekly basis with 24 h sampling time interval. PM2.5 and PM2.5-10 aerosol particles were sampled using Stacked Filter Units (SFU). Aerosol mass, black carbon, water soluble ions concentration as well as total aluminum, calcium, iron, magnesium, potassium, sodium and titanium concentration were determined. Mean annual PM10 mass concentration ranged from 18 to 38 µg m
-3, without violation of the
Brazilian air quality standards. For fine and coarse modes, between 70 and 90% of the measured mass was apportioned to relatively few sources, soil dust accounts for 37-63% of the coarse mode mass. On the other hand, black carbon and secondary aerosol, related to anthropogenic sources as fuel burning, represents very high proportions (45-58%) of the PM2.5 mass.
Keywords: Brazil, air pollution, aerosol, source apportionment
Introduction
The city of Rio de Janeiro is one of the twenty biggest urban agglomerations in the world, with 11 million inhabitants in the metropolitan area and the first, among the Brazilian cities, in respect to the population density, with 1700 hab/km2.1,2 Among the metropolitans regions
existing in the country, Rio de Janeiro has the highest degree of urbanization, 96.8%, and responds for 80% of the internal income of the State and 13% of the Country.1,3
Factors such as local topography, irregular occupation of the space, presence of open sea and a fraction of the urban area at the Guanabara Bay influence the urban atmosphere of the city of Rio de Janeiro. These factors
result in an efficient, however complex, regimen of atmospheric circulation, combining winds with the canalizations originated from its topography, and, consequently, contributing to an irregular distribution and dispersion of pollutants. The climatological evaluation of the atmospheric circulation in Rio de Janeiro shows that the highest wind direction frequency is from South-Southeast to Northeast sectors, along the year, with average wind velocity of 8 km h-1.4 The humidity is high
with small variation among the months. Cloud cover is constant due to the proximity of humidity sources, as the ocean and the Guanabara Bay.
secondary pollutants. The regions close to the sea have a natural ventilation that tends to carry pollutants to its inside regions, where physical barriers, as Tijuca and Pedra Branca ridges, parallel to the shoreline, hinder the air circulation.1
Some actions have been implemented with the objective to minimize the emission of pollutants and have resulted in an improvement of the air quality: elimination of domestic incinerators, cleaner fuel used in bakeries and industries, deactivation of some quarries, implementation of control programs for limiting industrial emissions, restriction of the traffic of heavy vehicles in some tunnels of the city, among others.1 Industry emissions, transport
sector and read dust are the main contributors to the observed PM10 levels. Vehicles and buses are the main sources of gaseous pollution, with high emissions of NOx, CO, NMHC and others. Other sources include cons-tructions and activities such as cement fabrication.1
Since 1997, it was observed a decrease in the total particle concentration, tending to stabilization. Despite the observed reduction, during the year 2003, the mean annual PM10 aerosol concentrations was higher than the air quality standards in 3 (Jacarepaguá, Bonsucesso and São Cristovão) from the 8 city quarters monitored, showing the need of the implementation of further abatement programs.1 To optimize a strategy for air pollution level
reductions, it is necessary detailed studies of aerosol source apportionment in the area.
The present work intents to contribute to fill the existing gap related to the aerosol source apportionment in the city of Rio de Janeiro. PM10-2.5 and PM2.5 aerosol particles were collected in ten different areas of the city and sampled on a weekly basis during one year. The samples were analyzed for water-soluble ions and crustal
elements. Based on the measured concentrations a source apportionment study was carried out in order to quantify the contributing sources of particles for the ten sites.
Material and Methods
The city of Rio de Janeiro is composed of different areas, with different air pollution sources and the complex topography of the city complicates the air mass circulation and dispersion of pollutants in areas far from the coast and located in heavy traffic areas. Aerosol sampling was performed at ten sites distributed in different location of Rio de Janeiro city (Figure 1), from September/2003 to September/2004, with an interruption from December/ 2003 to March/2004, on a weekly basis with 24 h sampling time, with a total of 30 sampling weeks, simultaneously in all sites. The existing atmospheric conditions during each sampling day are presented in Table S1. In order to make a careful choice of the sampling sites, it was taking into account the local air pollution sources, meteorology and logistics (free access, electricity and safe of intrusion). Additionally, it should be located far from trees or any other obstacles and not very close to large avenues. Table S2 shows the sampling sites coordinate.
The aerosol particles were collected using the Stacked Filter Units (SFU), 5-7 which uses an inlet providing a 50%
cutoff diameter at 10 µm. The SFU collects coarse mode particles (2.5 < dp <10 µm) on a 47 mm diameter, 8-µm pore size Nuclepore filter while a 0.4 µm pore size Nuclepore filter collects the fine mode particles (dp < 2.5 µm). The sum of both size fractions provides PM10 that refers to aerosol particles smaller than 10 µm aerodynamic diameter. The flow rate was typically 17 L min-1. Particle
bounce at the inlet was minimized by coating the
impaction plate with a thin layer of Apiezon vacuum grease (AP 101). The sample volume was obtained with gas volume meters, calibrated with a primary standard airflow calibrator, “Gilibrator” (Gilian Instruments Corporation).
The aerosol mass concentration was obtained through gravimetric analysis using a electronic microbalance with 1 µg sensitivity (Mettler MT5). Samples were kept under controlled temperature and relative humidity 24 h prior weighting. The detection limit for aerosol mass concentration is about 0.6 µg m-3, while precision is
estimated to be lower than 5%. Black carbon (BC) concentration in the fine mode was measured using a reflectance technique (Smoke Stain Reflectometer, Diffusion System, model M43D), calibrated using BC gravimetric standards. In order to determine the water soluble fraction and the elemental concentrations on the Nuclepore filters, the filters were divided into two pieces, with a stainless steel blade, one containing one quarter and the other the remaining three quarters.
Ten milliliters ultra-pure water (conductivity < 50 nΩ cm-1) was added to the one-quarter filter fraction,
ultrasonically extracted for 30 minutes and centrifuged. The obtained extracted was kept frozen until its analysis. Ammonium, potassium, sodium, calcium, magnesium, nitrate, sulfate and chloride were determined in the water-soluble fraction by ion-chromatography as shown in Table S3. Nitrate, sulfate and chloride determination are regularly tested through the participation on inter-laboratorial exercises. The achieved detection limits are shown in Table S4.
On the other fraction, aluminum, calcium, iron, magnesium, potassium, sodium and titanium were determined using the ICP-MS technique, after total chemical dissolution applying high-purity HNO3 and HF. Filter dissolution was performed by microwave heating in closed Teflon® vessels (microwave oven CEM MARS
5). After boric acid addition to eliminate HF excess, the solution was evaporated to the dryness under vacuum also by microwave heating and the residue was dissolved with 10 mL 2% HNO3.8
Mass spectrometric analysis was performed in a Perkin-Elmer ELAN 6000 ICP-MS instrument applying an ultra-sonic nebulizer with membrane desolvator (CETAC U-6000AT+) (Table S5). Comparing with the previous results,8 the use of an ultra-sonic nebulizer instead
a cross-flow nebulizer, increasing the sensibility by a factor of ten and reducing by a factor of five the achieved detection limit (Table S4). Reference materials, NIST SRM-1648 (urban dust) and NIST SRM-2783 (air particulate on filter), were used to check the analytical
procedure applied, including the sample dissolution and the ICP-MS analysis.
Histograms, normal and lognormal distributions were generated to validate the data and to remove outliers. For each element, a stepwise linear regression was performed on the validated data set to analyze outliers that were above or bellow 3 standard deviations. Those elements that could not be significantly predicted by any other element were excluded from the dataset. In general, were those with most of the results bellow or close to the quantification limit, such as calcium in the water-soluble fraction. Some samples were also excluded from the data set due to equipment failure or unusual activities, such as vegetation burning, close to the sampler. After the data validation, between a minimum of 207 values per variable (potassium, PM2.5 water soluble fraction) and a maximum of 298 values
per variable (among others, PM2.5 black carbon and PM2.5-10 gravimetry) were included in the dataset.
Results and Discussion
The obtained results for the analysis of the standard reference materials NIST SRM-1648 (urban dust) and NIST SRM-2783 (air particulate on filter) are shown on Tables S6 and S7, respectively. The NIST SRM-2783 is provided with two loaded filter and two blank filter, therefore, applying it, it was only possible to evaluate the method accuracy. Calcium is normally susceptible to interferences when determined by quadrupole ICP-MS and was the element with the highest bias, 23%.9 Due to the
high background associated to sodium a bias of 15% was observed. The other elements have shown a bias lower than 10%. Similar result was observed for sodium with the NIST SRM-1648 (urban dust), 23% bias, but no reference value for calcium is reported for this SRM. For the others elements, it was again observed a bias lower than 10%. Based on the NIST SRM-1648 results it was possible to evaluate precision of the elemental concentration measurement, which is in the range of 3%. Table S8 presents PM2.5, PM2.5-10, PM10 black carbon (BC) and mass concentration results according each sampling site. No violation to the PM10 Brazilian air quality standard was observed, one of the possible reason for this is the fact the chosen sampling sites were located far from heavy traffic avenues. FEEMA has two automatic air monitoring stations installed in Rio de Janeiro, one downtown and the other in Jacapepaguá, the same neighborhood of sampling site 5. The PM10 mean annual values reported for the year 2003,1 40 and 30 µg m-3, respectively, are in the range
hand, during the same year, 3 from 8 sites of FEEMA’s
manual PM10 sampling network have shown mean
annual value higher than 50 µg m-3 (Jacarepaguá,
Bonsucesso and São Cristovão). Mariani10 has reported
a PM10 mean annual value of 62 µg m-3 during the year
1999 at sampling site 2 (Maracanã), where lower values were observed, both, by FEEMA,1 for the year 2003,
and in the present work. Sampling point 6 (site Honório Gurgel) was that with the highest mean black carbon, coarse (PM2.5-10) and total inhalable (PM10) particle mass concentration, while sampling point 3 (site Ilha do Fundão) has shown the highest fine (PM2.5) particle mean mass concentration. Both are sampling points located near regions with the influence of industries and of one of the main Rio de Janeiro roads (Avenida Brasil), with a very heavy traffic. However, for all sampling points it was observed that the coarse particle
fraction represents 59-71% of the PM10 mass
concentration (Table S8). On the other hand, black carbon account for 17-29% of the fine particle fraction indicating that traffic emissions are responsible for a large fraction of the aerosol mass in the fine fraction, since buses and truck emissions are the largest contributors to black carbon in the urban area.5 The
lowest values were observed on sampling points 4 (site Recreio dos Bandeirantes) and 7 (site Guaratiba), both located at the Western area of the city. The Western area of city represents its expansion area and the present values could be used in the future to evaluate the influence of the present growing urbanization on the local air quality.
The observed black carbon (BC), the PM2.5, the PM10-2.5 and the PM10 mass concentrations are in the range of the reported in the literature for urban areas such as Bern and Zurich,11 Edinburgh,12 Auckland,13 Porto Alegre,14
Brisbane,15 but lower when compared to cities like Ho
Chi Minh,16 São Paulo,17 e Santiago5 (Table S9).
Taking into account only the Brazilian cities, São Paulo e Porto Alegre, the results obtained in the present work are quite compatible with the values observed in
Porto Alegre14 and those found during the summer
season in São Paulo,17 but lower than the winter season
results in this city, when thermal inversion layers provide unfavorable conditions for the dispersion of pollutants.17 When comparing the two largest Brazilian
cities, the BC/PM2.5 and PM2.5-10/PM10 ratios observed in Rio de Janeiro (Table S10) are quite similar to those ratios observed by Castanho and Artaxo17 in São Paulo,
about 0.25 and 0.60, respectively, despite all the existing geographical differences between these two cities. On the other hand, Braga et al.14 have observed
in Porto Alegre, a 6 million inhabitants city, located in South Brazil, a lower PM2.5-10/PM10 ratio, 0.45.
Figure 2 shows the mass concentration temporal variation for sampling point 3 and sampling point 7. They represent two extreme points located quite apart one from the other (Figure 1) but, notwithstanding, both figures are quite similar, with the highest concentrations during dry periods (end October/2003 and June/2004) and the lowest after rain episodes as mid-October/2003 and April/2004. Showing also that, its seasonality is similar for several sampling sites along the city.
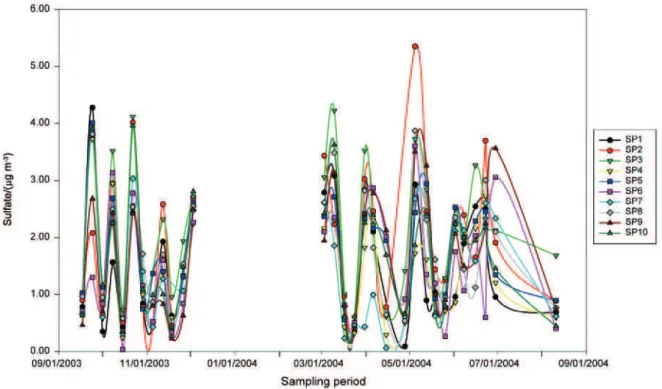
The descriptive statistics of concentration of the determined water-soluble components, in the fine and coarse fraction, are shown in Table S11 and S12, respectively. As for fine particle mass concentration, sampling point 3 (site Ilha do Fundão) was where the highest ammonium, nitrate and sulfate concentration were observed. Similarly, probably associated to road dust resuspension, sampling point 6 (site Honório Gurgel), with the highest observed coarse particle mass concentration, presents the highest nitrate and sulfate concentrations. Sampling point 1 (site Gávea) is relatively close to the beach and to a brackish lagoon and, as a consequence, it has the highest sodium and chloride concentrations. As observed for the mass concentration, in general, sampling point 4 and 7 are those with the lowest water-soluble concentrations. As expected, water-soluble sodium, magnesium and chloride are mainly present in the PM2.5-10 fraction reflecting the sea spray contribution, being the PM2.5/PM2.5-10 ratio similar among all the sampling points. Due to the secondary aerosol formation, ammonium and sulfate are predominately found in the fine particle fraction. The water soluble fraction of the coarse mode is composed by neutral salts while the presence of ammonium salts in the fine mode gives it an acidic character. Figure 3 shows the temporal variation of the sulfate concentration in the fine mode, despite the differences on the concentration, the secondary aerosol formation process seems to be quite similar among the sampling points.
In the water soluble fraction of the coarse mode, the observed Mg/Na ratio (0.10) is quite similar to that based on the seawater composition (0.12). The calculated Cl/ Na ratio was 1.15, lower than 1.8, expected based on the seawater composition, the chloride deficit in relation to sodium can be also the reason why nitrate is mainly observed in the coarse mode. After an adsorption of nitric acid on sea-salt particles, it reacts with sodium chloride forming gaseous HCl, following the reaction:18-20
According to Morales et al.21 and Wang et al.,22
seawater and non-seawater potassium and sulfate concentrations can be estimate using the water-soluble sodium concentration:
[SO42–]
non-seawater = [SO4
2–] – [Na+] 0.245 (1)
[K+]
non-seawater = [K
+] – [Na+] 0.0355 (2)
In the fine mode, more than 95% of potassium and sulfate are not related to the seawater. Although in lower percentage, potassium and sulfate in the coarse made are also the mainly non-seawater related. In the fine mode, sulfate is clearly associated to ammonium (Figure 4), the observed angular coefficient (2.21) is close to the (NH4)2SO4 mass ratio (2.67). The presence of sulfate as (NH4)2SO4 in the fine mode can be verified also calculating the non-sulfate excess to ammonium (equation 3), the obtained values have shown that (NH4)2SO4 accounts to at least 90% of sulfate in the PM2.5 fraction:
Excess [SO42–]
non-seawater = [SO4 2–]
non-seawater – 2.67 [NH4 +] (3)
Interesting to note that similar findings were observed by de Mello23 for rainwater collected in metropolitan
region of Rio de Janeiro. Sodium was strongly correlated with chloride and magnesium showing the effect of sea-salt aerosols. A Cl– deficit of 9% in respect to sodium was
reported. The non-seawater potassium and sulfate were 87% and 82% of their total concentration. Also strong correlations were observed among NH4+, NO
3
– and
nss-SO42–, indicating potential relationships between those ion
pairs and common natural and anthropogenic sources. Ammonium, nitrate and sulfate mean annual concentrations in the fine mode are lower than the value reported by Mariani10
for sampling site 2 (Maracanã) and those by Hueglin et al.11 for
Bern and Zurich (Switzerland) (Table S9). But, higher than the mean annual values reported by Wang and Shooter13 for Brisbane
(Australia) and Hien et al.16 Auckland (New Zealand), two large
sub-tropical coastal cities, indicating a larger secondary aerosol production. Similar water-soluble chloride, sodium and magnesium concentrations in the coarse mode are observed for coastal cities like Auckland,16 Brisbane13 and Rio de Janeiro.
The descriptive statistics of the elemental concentration of Na, K, Ca, Mg, Al, Fe and Ti in the PM2.5 and in the PM2.5-10 fractions are shown in Table S13 and S14, respectively. Due
Figure 5. Correlation between the ICP-MS and IC results for sodium (a) and magnesium (b) in the coarse mode aerosol samples.
Figure 4. Sulfate and ammonium correlation observed for the fine mode aerosol samples.
their potential sources, sea-spray, soil and road dust resuspension, the observed PM2.5/PM2.5-10 ratio shows that all these elements are mainly present in the coarse mode. In general, those results with higher PM2.5-10 mass concentration are also those with the highest concentration of crustal elements as aluminum, iron and titanium (Table S9).
Since the highest concentrations of water soluble cations were observed for Na and Mg in the coarse mode, these were chosen in order to compare ICP-MS to IC results. Figures 5a and 5b show the correlation between obtained results. Based on the angular coefficient, it is possible to verify that 75-80% of Na and Mg are water-soluble, that means originated from sea-spray.
Correlation analysis shows a clear association among Al, Ca, K, Fe and Ti in the PM2.5-10 fraction indicating to be
soil resuspension the main source of these elements. The same clear correlation was not observed for the fine mode, may due to the lower concentration of these elements in this fraction or the presence of additional sources.
The source apportionment was evaluated based on the following assumptions, and the obtained results are shown
in Figure 6a and 6b: (i) the silicon concentration was estimated using the mean Al/Si ratio calculated applying the paved road dust SPECIATE version 3.2 data 24 (0.340,
sd=0.051, n=24), which is similar to the Al/Si ratio for soils applying the same databank (0.325, sd=0.076, n=31) and to the value observed by Cohen et al.25 for Australian
soils (0.367); (ii) the soil contribution was calculated as proposed by Cohen;26 (
iii) sea-spray contribution was evaluated based on the water soluble sodium concentration and includes sodium, chloride, magnesium, potassium and sulfate of marine origin;26 (iv) in the fine mode, secondary
aerosol was evaluated assuming non-seawater sulfate and nitrate as ammonium salts; (v) in the coarse mode, non-seawater sulfate and nitrate were evaluated as potassium salts;
Except sampling point 1, located close to two salty water sources, the source apportionment for all sampling points is quite similar. It is possible to observe that for both modes between 70 and 90% of the mass contributors could be identified. The fraction “Others” should include inorganic and organic carbon as well as water. For the PM2.5-10 fraction, the soil resuspension, that in, reality, include road dust, accounts for 37-63% of the coarse mode mass; consequently, the implementation of actions aiming the reduction of this kind of dust should improve considerably the air quality of the Rio de Janeiro city. On the other hand, black
carbon and secondary aerosol, related to anthropogenic sources as fuel burning, represents 45-58% of the PM2.5 fraction, taking into account the association between the fine mode aerosol and respiratory diseases, a reduction of this contribution should have a substantial impact on the population health.27,28
Conclusions
Sampling point 6 (site Honório Gurgel) was that with the highest mean black carbon, coarse (PM2.5-10) and total inhalable (PM10) particle mass concentration, while sampling point 3 (site Ilha do Fundão) has shown
the highest fine (PM2.5) particle mean mass
concentration. Both are sampling points located on a region under the influence of industries and of one of the main Rio de Janeiro avenues (Avenida Brasil), with a very heavy traffic. However, for all sampling points it was observed that the coarse particle fraction represents 60-70% of the PM10 mass concentration. On the other hand, black carbon account for 17-29% of the fine particle fraction and 6-11% of the PM10 mass concentration. The lowest values were observed on sampling points 4 (site Recreio dos Bandeirantes) and 7 (site Guaratiba), both located at the Western area of the city. The Western area of city represents its expansion area and the present values could be used in the future to evaluate the influence of the present growing urbanization on the local air quality.
For both modes, between 70 and 90% of the mass contributors were identified. For the PM2.5-10 fraction, the soil resuspension accounts for 37-63% of the coarse mode mass; consequently, the implementation of actions aiming the reduction of this kind of dust should improve considerably the air quality of the Rio de Janeiro city. On the other hand, black carbon and secondary aerosol, related to anthropogenic sources as fuel burning, represents 45-58% of the PM2.5 fraction. Taking into account the association between the fine mode aerosol and respiratory diseases, a reduction of this contribution should have a substantial impact on the population health.
Supplementary Information
Tables S1 to S14 are available free of charge via the Internet at http://jbcs.sbq.org.br, as PDF file.
Acknowledgments
To Paulo Artaxo (IF-USP), who has helped us since the beginning of the present work. To Fundação Carlos
Chagas Filho de Amparo a Pesquisa do Estado do Rio de Janeiro (FAPERJ), which has partially supported the present work. To the Instituto Nacional de Metereologia (INMET) to provide us the informations about the atmospheric conditions. To all those who have allowed us to install the samplers inside their proprieties and have helped us during one year sampling.
References
1. Fundação Estadual de Engenharia do Meio-Ambiente – FEEMA. Relatório anual da qualidade do ar 2003. Available at h t t p : / / w w w . f e e m a . r j . g o v . b r / a d m i n _ f o t o s / RELATORIO_AR_%202003.pdf (accessed December/2005) 2. Fernandes, M.B.; Brickus, L.S.; Moreira, J.C.; Cardoso, J.N.;
Chemosphere2002, 47, 417.
3. Azevedo, D.A.; Moreira, L.S.; Siqueira, D.S.; Atmos. Chem. 1999,33, 4987.
4. Fundação Estadual de Engenharia do Meio-Ambiente – FEEMA; Qualidade do ar da região metropolitana do Rio de
Janeiro. Joint report FEEMA/GTZ (Deutsche Gesellschaft für Technische Zusammenarbeit GmbH), 1995.
5. Artaxo, P.; Oyola, P.; Martinez, R.; Nucl. Instrum. Methods Phys. Res. Sect. B1999, 150, 409.
6. Hopke, P. K.; Xie, Y.; Raunrmaa, T.; Biegalski, S.; Landsberger, S.; Maenhaut, W.; Artaxo, P.; Cohen, D.; Aerosol Sci. Technol. 1997, 27, 726.
7. Maenhaut, W.; François, F.; Cafmeyer, J.; The “GENT”
Stacked Filter Unit (SFU) Sampler for the Collection of
Atmospheric Aerosols in two Size Fractions: Description
and Instructions for Installation and Use. Report No. NAHRES-19, International Atomic Energy Agency, Vienna, 1993.
8. Godoy, M.L.D.P.; Godoy, J.M.; Artaxo, P.; Atmos. Environ. 2005, 39, 5307.
9. Patterson, K.Y.; Veillon, C.; Moser-Veillon, P.B.; O’Haver, T.C.;
J. Anal. At. Spectrom. 1999, 14, 1673.
10. Mariani, R.L.N.C.; Ph.D Thesis, Universidade Federal Fluminense, Niterói, Brazil, 2001.
11. Hueglin, C.; Gehrig, R.; Baltensperger, U.; Gysel, M.; Monn, C.; Vonmont, H.; Atmos. Environ. 2005, 39, 637.
12. Heal, M.R.; Hibbs, L.R.; Agius, R.M.; Beverland, I.J.; Atmos. Environ.2005, 39, 1417.
13. Wang, H.; Shooter, D.; Sci. Total Environ.2005, 340, 189. 14. Braga, C.F.; Teixeira, E.C.; Meira, L.; Wiegand, F.; Yoneam,
M.L.; Dias, J.F.; Atmos. Environ.2005, 39, 1801.
15. Chan, Y.C.; Simpson, R.W.; McTainsh, G.H.; Vowles, P.D.; Cohen, D.D.; Aailey, G.M.; Atmos. Environ.1999, 30, 2079. 16. Hien, P.D.; Binh, N.T.; Troung, Y.; Ngo, N.T.; Sieu, L.N.; Atmos.
Environ.2001, 35, 2669.
17. Castanho, A.D.A.; Artaxo, P.; Atmos. Environ.2001, 35, 4889. 18. Bardouki, H.; Liakakou, H.; Economou, C.; Sciare, J.; Smolik, J.; Zdimal, V.; Eleftheriadis, K.; Lazazidis, M.; Dye, C.; Mihalopoulos, N.; Atmos. Environ. 2003, 37, 195.
19. Ho, K.F.; Lee, S.C.; Chan, C.K.; Yu, J.C.; Chow, J.C.; Yao, X.H.;
Atmos. Environ.2003, 37, 31.
20. Manahan, S.E.; Environmental Chemistry, 6th edition, Lewis
Publishers, London, 1994.
21. Morales, J.A.; Pirela, D.; de Nava, M.G.; de Borrego, B.S.; Velásquez, H.; Duran, J.; Atoms. Res.1998, 26, 307. 22. Wang, G.; Wang, H.; Yu, Y.; Gao, S.; Feng, J.; Gao, S.; Wang,
L.; Atmos. Environ.2003, 37, 2893.
23. de Mello, W.B.; Environ. Pollut.2001, 114, 235.
24. SPECIATE version 3.2, free version available at http:// www.epa.gov/ttn/chief/software/speciate/index.html, 2006. 25. Cohen, D.D.; Stelcer, E.; Hawas, O.; Garton, D.; Nucl. Instrum.
Methods Phys. Res. Sect. B2004, 219-220, 145.
26. Cohen, D.; Nucl. Instrum. Methods Phys. Res. Sect. B1998, 136-138, 14.
27. Marmur, A.; Park, S-K; Mulholland, J.A.; Tolbert, P.E.; Russell, A.G.; Atmos. Environ.2006, 40, 2533.
28. Hopke, P.K.; Ito, K.; Mar, T.; Christensen, W.F.; Eatough, D.J.; Henry, R.C.; Kim, E.; Laden, F.; Lall, R.; Larson, T.V.; Liu, H.; Neas, L.; Pinto, J.; Stolzel, M.; Suh, H.; Paatero, P.; Thurston, G.D.; J. Expos. Sci. Environ. Epidem.2006, 16, 275.
Received: July 11, 2006
Printed in Brazil - ©2007 Sociedade Brasileira de Química 0103 - 5053 $6.00+0.00
Supplementary Information
*e-mail: [email protected]
Multi-site PM
2.5and PM
2.5-10Aerosol Source Apportionment in Rio de Janeiro, Brazil
Daniela S. Soluri,a Maria Luiza D. P. Godoy,a José Marcus Godoy*,a,b and Luiz Alfredo Roldãob
a
Departamento de Química, Pontifícia Universidade Católica do Rio de Janeiro, Rua Marquês de São Vicente 225, Gávea, 22453-900 Rio de Janeiro-RJ, Brazil
b
Instituto de Radioproteção e Dosimetria, Comissão Nacional de Energia Nuclear, CP 37750, Barra da Tijuca, 22642-970 Rio de Janeiro-RJ, Brazil
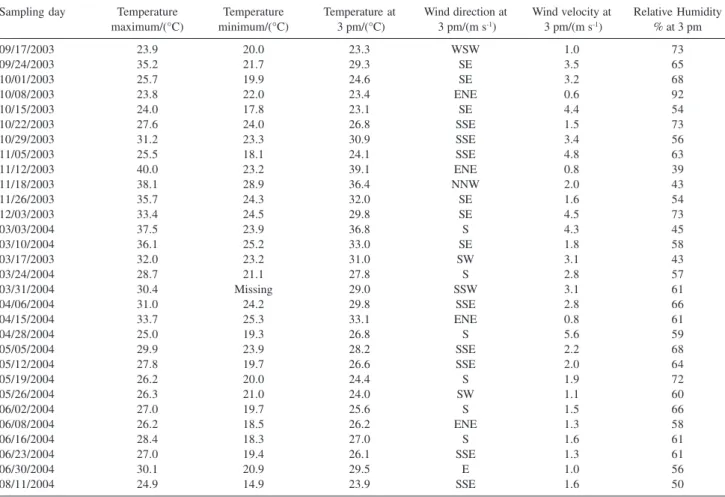
Table S1. Atmospheric conditions existing at each sampling day, measured at the Rio de Janeiro city center
Sampling day Temperature Temperature Temperature at Wind direction at Wind velocity at Relative Humidity maximum/(°C) minimum/(°C) 3 pm/(°C) 3 pm/(m s-1) 3 pm/(m s-1) % at 3 pm
09/17/2003 23.9 20.0 23.3 WSW 1.0 73
09/24/2003 35.2 21.7 29.3 SE 3.5 65
10/01/2003 25.7 19.9 24.6 SE 3.2 68
10/08/2003 23.8 22.0 23.4 ENE 0.6 92
10/15/2003 24.0 17.8 23.1 SE 4.4 54
10/22/2003 27.6 24.0 26.8 SSE 1.5 73
10/29/2003 31.2 23.3 30.9 SSE 3.4 56
11/05/2003 25.5 18.1 24.1 SSE 4.8 63
11/12/2003 40.0 23.2 39.1 ENE 0.8 39
11/18/2003 38.1 28.9 36.4 NNW 2.0 43
11/26/2003 35.7 24.3 32.0 SE 1.6 54
12/03/2003 33.4 24.5 29.8 SE 4.5 73
03/03/2004 37.5 23.9 36.8 S 4.3 45
03/10/2004 36.1 25.2 33.0 SE 1.8 58
03/17/2003 32.0 23.2 31.0 SW 3.1 43
03/24/2004 28.7 21.1 27.8 S 2.8 57
03/31/2004 30.4 Missing 29.0 SSW 3.1 61
04/06/2004 31.0 24.2 29.8 SSE 2.8 66
04/15/2004 33.7 25.3 33.1 ENE 0.8 61
04/28/2004 25.0 19.3 26.8 S 5.6 59
05/05/2004 29.9 23.9 28.2 SSE 2.2 68
05/12/2004 27.8 19.7 26.6 SSE 2.0 64
05/19/2004 26.2 20.0 24.4 S 1.9 72
05/26/2004 26.3 21.0 24.0 SW 1.1 60
06/02/2004 27.0 19.7 25.6 S 1.5 66
06/08/2004 26.2 18.5 26.2 ENE 1.3 58
06/16/2004 28.4 18.3 27.0 S 1.6 61
06/23/2004 27.0 19.4 26.1 SSE 1.3 61
06/30/2004 30.1 20.9 29.5 E 1.0 56
Table S2. Sampling points coordinates
Sampling point City Quarter Coordinates
1 Gávea S 22o58´46.08² W43o13´56.00²
2 Maracanã S 22o54´52.52² W43o13´25.32²
3 Ilha do Fundão S 22o51´59.54² W43o13´32.16²
4 Recreio dos Bandeirantes S 22o59´34.90² W43o25´13.40²
5 Jacarepaguá S 22o57´10.30² W43o20´47.00²
6 Honório Gurgel S 22o50´42.60² W43o21´21.00²
7 Guaratiba S 23o00´03.88² W43o34´54.21²
8 Campo Grande S 22o54´32.63² W43o33´32.65²
9 Realengo S 22o53´05.53² W43o26´07.64²
10 Santa Cruz S 22o56´18.48² W43o40´05.72²
Table S3. Dionex DX-120 ion chromatograph operation conditions
Parameter Cations Anions
Guard column CG-12 (4mm) AG-14 (4mm)
Analytic column CS-12 (4mm) AS-14 (4mm)
Loop volume/(µL) 450 450
Eluent H2SO4 10 mmol L-1 Na
2CO3 10 mmol L -1/NaHCO
3 0.6 mmol L -1
Flow rate/(mL min-1) 1.2 1.2
Detector Electric conductivity Electric conductivity
Temperature/(oC) 25 25
Table S4. Achieved (LOD) for the determination of water soluble cations and anions and elemental concentration in aerosol samples
Species LOD/(ng m-3)
PM2.5 PM2.5-10
Na+ 50 50
NH4+ 10 10
K+ 50 20
Mg2+ 10 20
Ca2+ 100 300
Cl– 20 50
NO3– 30 130
SO42– 30 30
Na 6.4 5.8
Mg 8.5 11
Al 16 18
K 4.6 3.7
Ca 12 8.7
Ti 0.8 0.9
Fe 4.1 3.8
Table S5. Instrument and data acquisition settings for the ICP-MS and ultrasonic nebulizer with desolvator
Instrument settings
RF power 1150 W
Nebulizer Ultrasonic with membrane
desolvator
Sample cone Nickel, 1.1 mm orifice diameter Skimmer cone Nickel, 0.9 mm orifice diameter Argon flow rates:
Plasma gas 15 L min-1
Auxiliary gas 1.2 L min-1
Nebulizer gas 1.17 L min-1
Ultrasonic Nebulizer settings
Sample uptake rate 2.5 mL min-1
Heating temp 140 °C
Cooling temp 3 °C
Membrane desolvator heating temp 160 °C
Sweep gas flow 2.0 L min-1
Data acquisition settings
Acquisition mode Peak hopping
Lens scanning Enabled
Read delay 40 s
Concentration measurements: Totalquant mode Internal standard In and Tl
Sweeps/Replicate 6
Replicates 1
Dwell time 50 ms
Table S6. Obtained results with the ICP-MS for the analysis of the stan-dard reference material NIST-1648 (urban dust), analysis in triplicate, values in mg kg-1
Element Certified Found RSD Bias
value value (%) (%)
Na 4250 5236 1 23
Mg 8000 7711 3.3 -3.6
Al 34200 32117 2.2 -6.1
K 10500 10586 2.4 0.8
Ca Not reported 71376 0.5
Ti 4000 3622 2.6 -9.5
Fe 39100 41114 2 5.2
Table S7. Obtained results with the ICP-MS for the analysis of the stan-dard reference material NIST-2783 (air particulate on filter), values in ng/filter
Element Certified value Found value Bias (%)
Na 1860 2131 15
Mg 8620 8172 -5.2
Al 23210 22666 -2.3
K 5280 5390 2.1
Ca 13200 16199 23
Ti 1490 1565 5
Fe 26500 29063 9.7
Table S8. Descriptive statistics of the aerosol mass concentration, as well as black carbon concentration, according to the different sampling points
Sampling Point PM2.5 /(µg m-3) PM
2.5-10 /(µg m
-3) PM
10 /(µg m
-3) BC /(µg m-3)
Mean SD Mean SD Mean SD Mean SD
1 7.8 4.4 12 3.8 19.7 7.4 2.1 1.3
2 11 6 16.5 9.2 28 14 3.1 1.7
3 13 6.8 19.1 9.1 32 15 2.9 1.8
4 7.5 4.2 11.8 4.5 19.5 7.4 1.31 0.76
5 11 4.6 18.7 5.9 29.7 9.7 2.7 1.2
6 11 5 27 13 38 16 3.2 1.8
7 7.1 4.4 11.1 3.7 18.2 6.8 1.21 0.86
8 11.1 4.4 18.6 6.2 29.7 9 2.4 1.1
9 10.4 4.8 19.7 9.2 30 12 2.5 1.3
Table S9. Comparison between the obtained results in the present work and results obtained by other authors (values in µg m-3)
Rio de Niterói Rio de São Paulo Porto Santiago Edinburgh Brisbane Auckland Zurich Bern Ho Chi Janeiro (a) (10) Janeiro (10) (17, b) Alegre (14) (5) (12) (15) (13) (11) (11) Minh (16)
Fine Mode (PM2.5)
PM2.5 7.0-13 24 31 15-30 15 36-54 7.1 7.3 8.2 20 24.6 16
BC 1.2-3.2 4.1-7.6 3.5-10.4 5.7 1.8 1.2 1.8 4.2
NH4+ 0.44-0.74 0.98 0.90 0.08 2.1 1.6
Na+ 0.17-0.30 0.40 0.45 0.28 0.45 0.094 0.094
K+ 0.12-0.23 0.36 0.45 0.055 0.049 0.18 0.18
Mg2+ 0.020-0.030 0.086 0.10 0.037 0.046 0.011 0.009
Cl– 0.13-0.32 0.24 0.29 0.15 0.49 0.072 0.10
NO3– 0.26-0.50 0.70 2.4 0.18 0.23 3.5 3.0
SO42– 1.5-2.2 0.71 2.7 0.79 0.50 3.5 2.8
Na 0.16-0.28 0.096 0.084 0.20
K 0.091-0.17 0.12-0.41 0.25 0.056 0.22 0.19 0.83
Mg 0.015-0.030 0.017 0.013 0.27
Ca 0.049-0.11 0.068-0.15 0.064 0.03 0.054 0.11 0.21
Al 0.067-0.15 0-0.44 0.033 0.011 0.048 0.026 0.55
Fe 0.069-0.14 0.18-0.53 0.13 0.028 0.05 0.02 0.124 0.20 0.26
Ti 0.017-0.025 0.015-0.031 0.0037 0.006 0 0.10
Coarse Mode (PM2.5-10)
PM2.5-10 11-27 34 31 19-46 12 41-94 6.3 10.4 9.9 6.3 19.6 31.8
NH4+ 0.20 0.20 0 0 0.2
Na+ 0.73-1.19 0.32 1.14 0.90 1.24 0.11 0.75
K+ 0.14-0.18 0.32 0.23 0.043 0.059 0.028 0.048
Mg2+ 0.09-0.19 0.079 0.38 0.13 0.16 0.021 0.037
Cl– 0.82-1.26 3.7 1.6 1.31 2.14 0.042 1.0
NO3– 0.92-1.44 1.6 1.6 0.45 0.19 0.6 1.1
SO42_ 0.51-1.05 1.7 1.1 0.31 0.38 0.2 0.7
Na 1.02-1.53 0.14 0.85 0.86
K 0.16-0.49 0.20-0.49 0.43 0.078 0.037 0.10 1.76
Mg 0.14-0.22 0.043 0.076 0.64
Ca 0.31-1.21 0.52-1.20 0.40 0.24 0.18 1.14 1.20
Al 0.31-1.17 0.51-1.52 0.19 0.10 0.037 0.13 2.13
Fe 0.28-0.66 0.67-1.98 0.66 0.15 0.20 0.13 0.41 2.0 1.22
Ti 0.04-0.10 0.079-0.22 0.003 0.033 0.016 0.37
aMaximum and minimum mean annual value among the 10 sampling sites; bSummer and winter mean values, respectively; (#): Reference source.
Table S10. Fine, coarse, total inhalable and black carbon mass concentration ratios according to the different sampling points
Sampling Point PM2.5/PM10 PM2.5-10/PM10 PM2.5/PM2.5-10 BC/PM2.5
1 0.39 0.60 0.65 0.27
2 0.41 0.59 0.69 0.28
3 0.41 0.59 0.68 0.22
4 0.39 0.63 0.62 0.18
5 0.37 0.63 0.58 0.25
6 0.29 0.71 0.41 0.29
7 0.39 0.61 0.64 0.17
8 0.37 0.63 0.58 0.22
9 0.33 0.67 0.50 0.25
Table S11. Descriptive statistics of the water soluble cations and anions concentration in the fine mode particles (values in µg m-3)
Sampling point Sodium Ammonium Potassium Chloride Nitrate Sulfate
Mean SD Mean SD Mean SD Mean SD Mean SD Mean SD
1 0.24 0.16 0.56 0.37 0.136 0.090 0.22 0.36 0.26 0.27 1.5 1.1
2 0.22 0.16 0.67 0.44 0.18 0.16 0.14 0.11 0.39 0.46 1.9 1.2
3 0.30 0.52 0.74 0.47 0.21 0.14 0.28 0.55 0.47 0.46 2.2 1.1
4 0.23 0.16 0.44 0.31 0.16 0.12 0.15 0.12 0.30 0.29 1.43 0.94
5 0.23 0.19 0.54 0.35 0.22 0.19 0.13 0.10 0.50 0.44 1.75 0.92
6 0.24 0.20 0.53 0.38 0.23 0.24 0.32 0.60 0.35 0.31 1.52 0.98
7 0.18 0.12 0.45 0.28 0.120 0.046 0.28 0.64 0.35 0.35 1.5 1.0
8 0.20 0.10 0.59 0.35 0.18 0.11 0.15 0.15 0.39 0.37 1.7 1.0
9 0.17 0.11 0.55 0.39 0.169 0.088 0.21 0.29 0.35 0.31 1.7 1.1
10 0.26 0.22 0.50 0.33 0.21 0.19 0.31 0.56 0.33 0.32 1.7 1.0
Table S12. Descriptive statistics of the water soluble cations and anions concentration in the coarse mode particles (values in µg m-3)
Sampling point Sodium Magnesium Potassium Chloride Nitrate Sulfate
Mean SD Mean SD Mean SD Mean SD Mean SD Mean SD
1 1.19 0.60 0.18 0.07 0.09 0.05 1.26 0.95 1.25 0.78 0.79 0.67
2 0.76 0.40 0.15 0.08 0.11 0.09 0.82 0.71 1.3 1.0 0.68 0.65
3 0.92 0.49 0.17 0.07 0.14 0.13 0.97 0.67 1.5 1.1 0.67 0.62
4 0.94 0.45 0.14 0.05 0.09 0.05 1.06 0.70 1.07 0.57 0.54 0.38
5 0.93 0.47 0.16 0.07 0.10 0.06 0.98 0.67 1.44 0.87 0.74 0.53
6 0.91 0.49 0.17 0.10 0.19 0.11 0.97 0.70 1.7 1.0 1.05 0.89
7 0.86 0.49 0.14 0.06 0.14 0.17 0.94 0.68 0.92 0.59 0.51 0.39
8 0.73 0.48 0.15 0.08 0.11 0.07 0.91 0.69 1.26 0.89 0.60 0.36
9 0.73 0.38 0.14 0.07 0.10 0.08 0.92 0.70 1.24 0.87 0.76 0.63
10 0.90 0.38 0.15 0.07 0.10 0.07 0.98 0.68 1.22 0.81 0.56 0.40
Table S13. Descriptive statistics of the elemental mass concentration in the fine mode particles according to the different sampling points (values in µg m-3)
Sampling point Sodium Magnesium Calcium Potassium Aluminium Titanium Iron
Mean SD Mean SD Mean SD Mean SD Mean SD Mean SD Mean SD
1 0.26 0.17 0.026 0.069 0.122 0.082 0.091 0.018 0.13 0.33 0.018 0.006 0.088 0.039
2 0.18 0.095 0.015 0.05 0.057 0.062 0.107 0.011 0.119 0.03 0.02 0.055 0.136 0.007
3 0.2 0.11 0.017 0.096 0.084 0.09 0.137 0.012 0.126 0.048 0.025 0.066 0.13 0.007
4 0.21 0.11 0.021 0.072 0.052 0.05 0.094 0.014 0.112 0.043 0.017 0.04 0.088 0.006
5 0.21 0.12 0.02 0.067 0.074 0.085 0.122 0.013 0.145 0.03 0.023 0.04 0.11 0.005
6 0.165 0.097 0.017 0.06 0.108 0.094 0.128 0.014 0.15 0.06 0.021 0.073 0.14 0.005
7 0.2 0.13 0.03 0.068 0.049 0.052 0.093 0.041 0.067 0.035 0.018 0.046 0.069 0.005
8 0.18 0.12 0.019 0.065 0.088 0.074 0.169 0.014 0.154 0.038 0.022 0.042 0.145 0.005
9 0.16 0.11 0.017 0.072 0.087 0.078 0.119 0.014 0.135 0.035 0.021 0.039 0.1 0.004
10 0.28 0.16 0.028 0.075 0.115 0.079 0.155 0.021 0.125 0.041 0.022 0.036 0.092 0.008
Table S14. Descriptive statistics of the elemental mass concentration in the coarse mode particles according to the different sampling points (values in µg m-3)
Sampling point Sodium Magnesium Calcium Potassium Aluminium Titanium Iron
Mean SD Mean SD Mean SD Mean SD Mean SD Mean SD Mean SD
1 1.53 0.72 0.187 0.057 0.31 0.19 0.158 0.07 0.37 0.2 0.04 0.17 0.298 0.019
2 1.06 0.52 0.18 0.066 0.6 0.28 0.269 0.066 0.67 0.42 0.06 0.31 0.624 0.035
3 1.15 0.47 0.205 0.073 0.82 0.27 0.345 0.073 0.57 0.49 0.08 0.29 0.66 0.042
4 1.16 0.53 0.155 0.055 0.43 0.19 0.197 0.055 0.31 0.23 0.04 0.15 0.283 0.02
5 1.36 0.63 0.222 0.065 0.8 0.81 0.365 0.065 0.82 0.34 0.08 0.26 0.608 0.035
6 1.22 0.54 0.225 0.063 1.21 0.41 0.492 0.063 1.17 0.53 0.1 0.53 0.892 0.053
7 1.05 0.61 0.139 0.054 0.49 0.24 0.205 0.054 0.29 0.31 0.05 0.19 0.319 0.029
8 1.11 0.64 0.203 0.068 0.86 0.35 0.351 0.068 0.77 0.45 0.08 0.29 0.57 0.042
9 1.02 0.45 0.191 0.057 0.91 0.3 0.38 0.057 1.01 0.48 0.09 0.31 0.611 0.044